XIII. COMMUNICATIONS BIOPHYSICS* Prof. W. A. Rosenblith Prof. M. Eden Prof. M. H. Goldstein, Prof. W. T. Peake Prof. W. M. Siebert Dr. J. S. Barlowt Dr. M. A. B. Brazierl W. A. Clark:** Dr. B. G. Farley** Margaret Z. Freeman Dr. G. L. Gerstein
Jr.
R. C. Beal A. G. Braun R. J. Creasy Dr. R. D. HallTf Dr. N. Y-S. Kiang Dr. T. T. Sandel** Dr. D. C. Teas$$ Dr. Eda Berger Vidale Dr. T. Watanabe*** Aurice Albert J. Allen R. M. Brown J. F. Buoncristiani F. T. Cummings A. E. Ferry K. Kotovsky R. R. Capranicaff" J. W. Davisjjj N. Gothard J. L. Hall II R. G. Mark**** C. E. Molnarfttt Clare Monck D. F. O'Brien C. E. Robinson R. W. Rodieck T. F. Weiss T. D. Laase K. L. Macoul J. J. SullivanA. RESPONSES FROM SINGLE AUDITORY CORTEX
UNITS IN THE UNANESTHETIZED
The role of cortex in the transactions of the nervous system is, in spite of much experimentation, not yet clearly understood. The problem is somewhat simplified by examining cortex involved in a sensory system, since at least some portion of the input is then under the experimenter's control. Auditory cortex in the cat is particularly convenient to study, both from the standpoint of anatomical location and because of the ease of stimulus manipulation.
It has recently become technically possible to record with microelectrodes the single unit activity at many locations in the nervous system, including the auditory cortex. Most work done in this area has been with anesthetized preparations (1, 2, 3). Unfortunately, electrical activity in the cortex is extremely susceptible to modification by the anesthetic. Some recordings of single unit activity in anesthetized cats have
This work was supported in part by the U.S. Air Force under Contract AF19(604)-4112.
Research Associate in Communication Sciences from the Neurophysiological Laboratory of the Neurology Service of the Massachusetts General Hospital.
Research Associate in Communication Sciences from the Brain Research Institute, University of California at Los Angeles.
Staff Member, Lincoln Laboratory, M. I. T.
tPostdoctoral Fellow of the National Institute of Mental Health.
"Postdoctoral Fellow of the National Institute of Neurological Diseases and Blindness.
Research Associate in Communication Sciences; also at the Massachusetts Eye and Ear Infirmary. Communications Development Training Program Fellow of the Bell Telephone Laboratories. 1
IlNational Science Foundation Cooperative Fellow. National Science Foundation Graduate Fellow. ttStaff Associate, Lincoln Laboratory.
(XIII. COMMUNICATIONS BIOPHYSICS)
been made at this laboratory (4). As expected, such preparations revealed a dis-tressing paucity of active units. However, sufficiently interesting results were ob-tained to warrant further investigation. A technique for microelectrode recording from the cortex of unanesthetized and unrestrained animals was developed along lines suggested by Hubel (5). Repeated recordings can be made from these relaxed and con-tented animals while acoustic stimuli are presented over a loudspeaker.
Such preparations show significantly more single unit activity than is found in anes-thetized cats. The increased activity is demonstrated both by a greater incidence of single units that respond to acoustic stimuli as well as a greater density of spontane-ously active units.
Data obtained during such experimental sessions were recorded onto magnetic tape and were subsequently processed with the TX-O computer, as previously described (4).
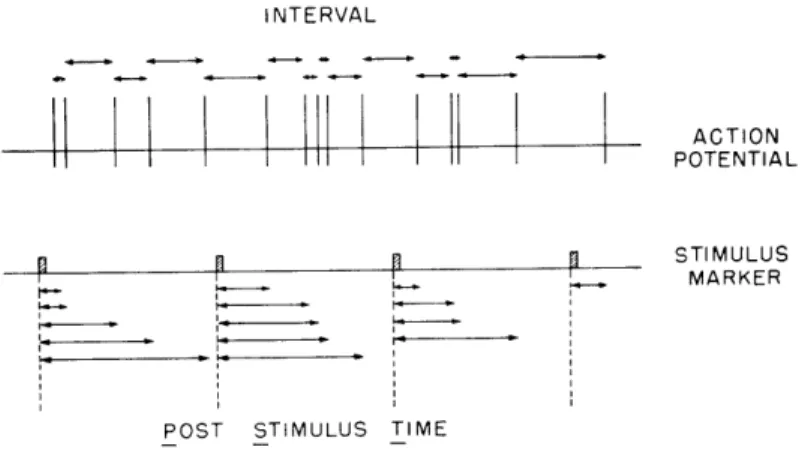
The two most frequently used types of computation are the Post Stimulus Time histo-gram (PST) and the Interval histohisto-gram. The measurements that are involved are shown in Fig. XIII-1 (it should be emphasized that both computations describe the average pattern of the unit activity).
INTERVAL ACTION POTENTIAL
pa
pr
p
STIMULUS , MARKER i i -- I I I -ALPOST STIMULUS TIME
Fig. XIII-1. Diagram of the measurements involved in the PST histogram and interval histogram.
In order to compile a preliminary catalog of response patterns, we have selected our arbitrary standard condition of stimulation: clicks are presented at the rate of
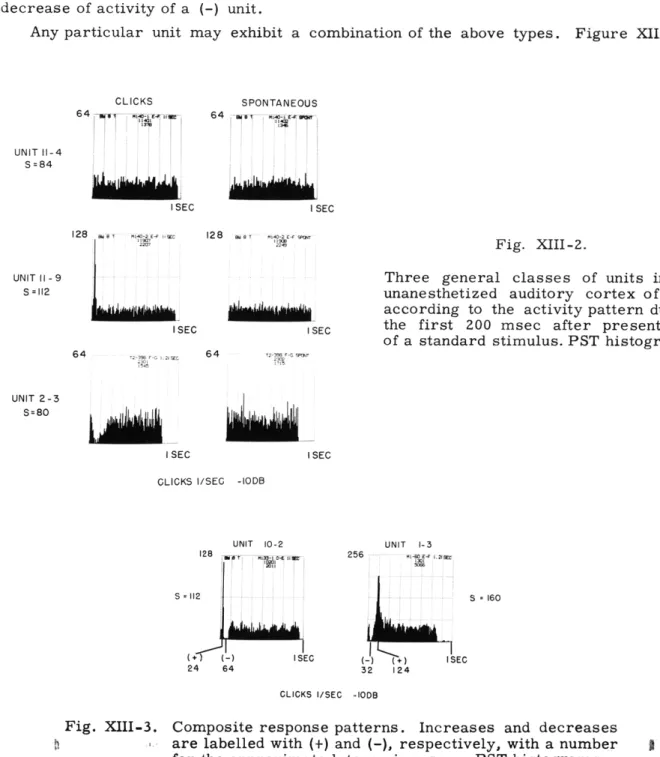
1/sec, at approximately 50 db above human threshold, 15 seconds of clicks alternate with 15 seconds of silence, allowing a direct comparison of spontaneous activity with the activity during stimulus presentation. The response patterns shown in PST histo-grams during the first 200 msec after presentation of the standard stimuli can be used to divide units into three general classes. These are shown in Fig. XIII-2. The three basic classes are characterized by the following behavior:
(XIII. COMMUNICATIONS BIOPHYSICS)
(a) No change in activity in comparison to the spontaneous PST histogram--"(O) unit" (b) An initial increase in activity in comparison to the spontaneous PST
histogram--"(+) unit"
(c) An initial decrease in activity in comparison to the spontaneous PST histogram--"(-) unit".
Characteristically the increase of activity of a (+) unit does not last as long as the decrease of activity of a (-) unit.
Any particular unit may exhibit a combination of the above types. Figure XIII-3
CLICKS 114 64 ISEC SPONTANEOUS 64 " i i; igt'. ISEC 128 a T .Mo-2 E 22 ISEC ISEC 64 1 64
Fig. XIII-2.
Three general classes of units in the
unanesthetized auditory cortex of cats
according to the activity pattern during
the first 200 msec after presentation
of a standard stimulus. PST histograms.
I SEC
CLICKS I/SEG -IODB
UNIT 10-2 128 :W... S 112 (+) I SEC 24 64 UNIT 1-3 256 S - 160 -) (+) ISEC 32 124 CLICKS I/SEC -10DB
Fig. XIII-3.
Composite response patterns. Increases and decreases
are labelled with (+) and
(-),
respectively, with a number
for the approximate latency in msec.
PST histograms.
UNIT 11-4 S=84 UNIT 11-9 S=112 UNIT 2-3 S=80 I SEC
ri~u~
256 Aws , W411-C I. ,E 128 ii ".. ... . 2i-, 9 21
CLICKS
I/SEC -IODB I SEC 256 , - 2, SPONTANEOUS I SEC UNIT 6 - 2 256 MS 128 i 256 MS N -1024Fig. XIII-4. Interval histograms for
(-)
Unit 6-2, at two different values of time
resolution. At the left, bin width 8 msec; at the right, bin width 2
msec. The small difference between the stimulated and spontaneous
conditions is due to the relatively high rate of spontaneous activity.
UNIT 6- 2
0 40 80 120
t (MSEC)
160 200 240
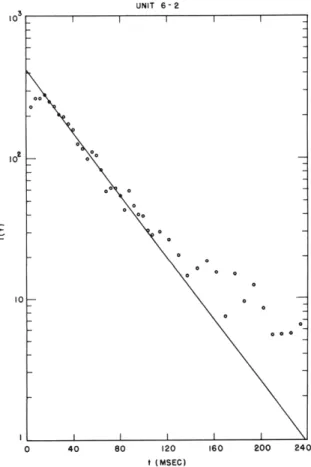
Fig. XIII-5.
Semi-logarithmic plot of an interval histogram for
(-)
Unit 6-2
(same as Fig. XIII-4) with bin width of 4 msec. The straight
line is intended as a guide to show that the tail of the
distribu-tion drops less slowly than an exponential does.
(XIII. COMMUNICATIONS BIOPHYSICS)
shows two examples of such pattern variations, a (+ -) unit, and a (- +) unit. While it is tempting to associate these firing patterns with events at the level of the cell mem-brane (ref. 6 Kandel); it is perhaps more prudent not to draw close parallels until intracellular recordings from such auditory units are obtained. We have not found cor-relations of the type of firing pattern with either the depth of the electrode in the cortex or the topographical location on the surface of the cortex.
There is considerable evidence that our reference stimulus does not by itself pro-vide for an adequate classification of response patterns in all auditory units. We have found units whose activity pattern changes in response to tones or noise bursts, but not to clicks.
The PST histogram of spontaneous activity (with respect to a dummy time marker) is always flat and "uninteresting." However, interval histograms do have "interesting" shapes, as shown in Fig. XIII-4. Any model which attempts to describe the physiolog-ical processes that underlie the patterns of spontaneous activity in a single unit must be capable of predicting such interval histograms.
We might, for example, postulate as a generator of the spontaneous activity, a Poisson process (in which the probability of finding k spikes in time t is: p(k, t) =
k -Rt
(Rt) ek ! where R is the average firing rate). For this type of process the interval -Rt
histogram would be, I(t) = Re or a decaying exponential. Examination of Fig. XIII-4 reveals that the interval histogram is not exponential, both because of an initial "dead time" of more than 3 msecs and because of the "tail." This tail is examined more closely on a semi-logarithmic plot (Fig. XIII-5). Most cells we have studied do not fit a Poisson Model.
G. L. Gerstein, N. Y-S. Kiang References
1. S. D. Erulkar, J. E. Rose, and P. W. Davies, Single unit activity in the auditory cortex of the cat, Bull. Johns Hopkins Hospital 99, 55-86 (1956).
2. Y. Katsuki, Neural mechanism of hearing in cats and insects, in Electrical Activity of Single Cells (Igakushoin, Hongo, Tokyo, 1960).
3. J. Hind (J. E. Rose, P. W. Davies, C. N. Woolsey, R. M. Benjamin, W. S. Welkes and R. F. Thompson), Unit activity in the auditory cortex, in Neural Mechanisms
of the Auditory and Vestibular Systems, Edited by G. L. Rasmussen (Charles C. Thomas Publishers, Springfield, Ill., 1960).
4. G. L. Gerstein, Firing patterns of single cells in the auditory cortex, Quarterly Progress Report No. 56, Research Laboratory of Electronics, M. I. T. , Jan. 15, 1960, pp. 189-192.
5. D. M. Hubel, Single unit activity in striate cortex of unrestrained cats, J. Physiol. (Great Britain) 147, 226-240 (1959).
6. E. R. Kandel, W. A. Spencer, and F. J. Brinley, Electrophysiology of hippo-campal neurons, J. Neurophysiol. 24, 225-242 (1961).
(XIII. COMMUNICATIONS BIOPHYSICS)
B. RELATIONS BETWEEN COCHLEAR MICROPHONIC POTENTIALS AND AUDITORY NERVE RESPONSES
Previous studies have shown how auditory nerve responses to acoustic clicks vary when click intensity and polarity are changed (1). The changes in the gross-electrode responses resulting from variations in these stimulus parameters can be described as follows:
(a) At low intensities (0-40 db re VDL), the N1 response is approximately the same
for both rarefaction and condensation clicks. As the intensity is increased within this intensity range the amplitude of the response increases and its peak latency decreases. (b) At high intensities (60-100 db), the response amplitude is approximately equal for both click polarities, but the peak latency of an N1 response to a rarefaction click is 0.2 msec shorter than the corresponding latency of a response to a condensation click. As intensity is increased in this range, the amplitude of the response increases, although its latency changes very little.
(c) In the intermediate intensity range (40-60 db), the waveforms of responses to the two click polarities are quite different from each other.
These observations have been interpreted in terms of a model according to which two different excitatory mechanisms are involved in producing the neural response. One mechanism is active in the low-intensity range, and another in the high-intensity range. It has also been suggested that the cochlear microphonic (CM) potential is related to the high-intensity mechanism and that a "slow-potential" (2) is related to the low-intensity mechanism.
The work reported here was designed to test this model further, by observing neural responses to acoustic stimuli that differ somewhat from those used previously. In pre-vious studies the stimuli were produced by applying 0. l-msec rectangular pulses to the PDR-10 earphone that is connected by a tube to the external meatus of a cat's ear. The acoustic waveform that results is quite complex, and the resulting motion of the inner
ear, as reflected by the cochlear microphonic potential, is also complicated. In the experiments reported here several pulses were delivered to the earphone at slightly different times and with adjustable amplitudes, in a manner that allows us to test some of the properties of our model. In other respects, the experimental procedure was identical to that reported previously (1).
Earlier workers have reported that the neural response is initiated when the micro-phonic potential (as observed with a round-window electrode) is changing from negative to positive (3, 4). To test this statement experimentally, we need a stimulus that gives rise to a unidirectional microphonic potential. It is, of course, impossible to achieve this with a system in which neither the power amplifier, nor acoustic coupling, nor the cochlea are direct-coupled. We were, however, able to approach a unidirectional
(XIII. COMMUNICATIONS BIOPHYSICS)
STIMULUS WAVE SHAPE RAREFACTIONI
CALIBRATION
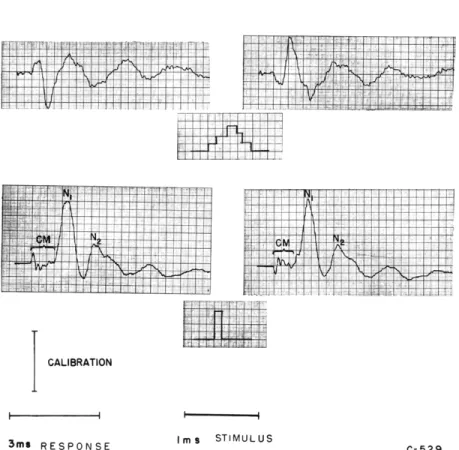
3ms RESPONSEFig. XIII-6.
Ims STIMULUS C-529The upper traces show the averaged waveforms of CM produced by the
multipulse stimulus waveform shown. The neural contribution to the
responses has been minimized by adding a high level of background noise
to the multipulse stimulus.
(Peak amplitude of multipulse stimulus, -50
db re 4. 9 volts; noise level, -30 db re 1 volt rms; traces obtained by
averaging 256 responses; voltage calibration marker, 30 iiv.) The lower
traces show averaged responses to 0. 1-msec rectangular pulses as
recorded from the same electrode. The neural components (N
1, N
2), of
these responses are prominent, since no masking noise had been added.
(Stimulus level, -50 db re 3.8 volts; average of 64 responses; voltage
calibration, 60 Lv.)microphonic by tailoring the stimulus in such a way as to maintain the microphonic in
one direction as long as possible. Figure XIII-6 illustrates the microphonic waveform
obtained in this situation, as compared with the CM response to 0. 1-msec pulses.
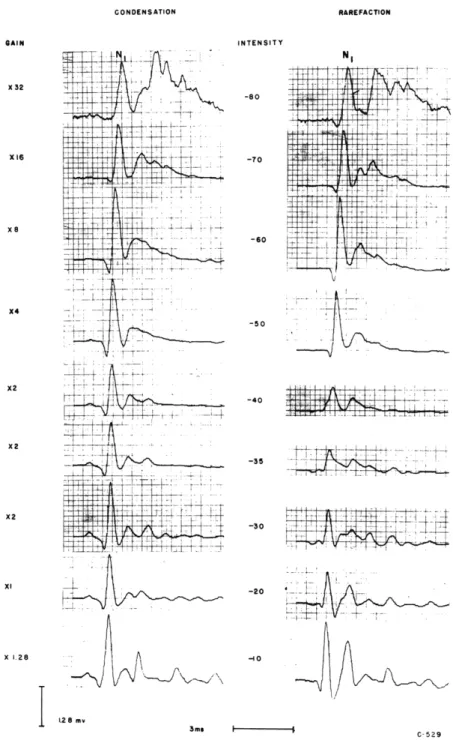
Figure XIII-7 shows the neural responses obtained when the multipulse stimuli of
Fig. XIII-6 were varied over a wide range of intensities. Plots of amplitude and latency
of the responses versus intensity are given in Fig. XIII-8b. The neural responses to
these multipulse stimuli change with intensity and polarity in a way that is similar to
the behavior of responses to 0. 1-msec pulses (Fig. XIII-8a). At low intensities, the
CONDENSATION i l I I I I 1 I 4K '~'''''''~'~'''"'''"1'~~"1''1~1"~''~ T. . ' . I ! 1 t -1 =A1 i I ; I
CONDENSATION GAIN INTENSITY N - - i i : 0 -70
I
-40 -350-5
X20 -40 X .28 x30 -- '" I J-I L2 my1 3m2 6C-529 )Fig. XIII-7. Intensity series for both stimulus polarities for multipulse stimuli as shown in the upper part of Fig. XIII-6. Responses were recorded from
concentric electrodes in the auditory nerve. (Stimulus reference level, 4. 9 volts; number of responses averaged, 256 at -80 and -70 db; 64 at higher intensities.)
2.2
~)0
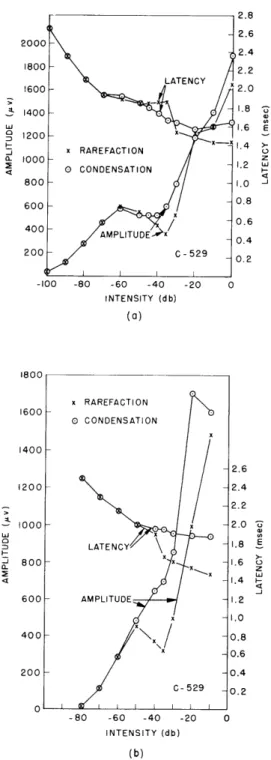
-LATENCY x 2.0 )0 1.8 " 0x _1.4 x RAREFACTION x .4 10 -1.2 w 0 CONDENSATION O - 1.0 0 0.8 O - AMPLITUDE x 0.6 0.4 0 - C-529 0.2 4I I 1 -100 -80 -60 -40 -20 0 INTENSITY (db) (a) x RAREFACTION 0 0 CONDENSATION 0 2.6 0 2.4 2.2 - x 2.0 -j LATENCY 1.8 E -1.6 0 1.4 H 3 AMPLITUDE 1.2 x 1.0 -80 -60 -40 -20 0 INTENSITY (db) (b)Fig. XIII-8.
Intensity functions for neural responses. (a) To 0. 1-msec
pulses.
(b) To multipulse stimuli (see Fig. XIII-6).
In
both cases the amplitude measurement is made from the
base line to the N
1peak, and latency is measured from
the application of the stimulus at the earphone to the N
peak.
CONDENSATION NOTCHED CM STIMULUS RAREFACTION WAVESHA PE
I1
A 1-I- ' 41W " F l i L 'I SMOOTH CMI
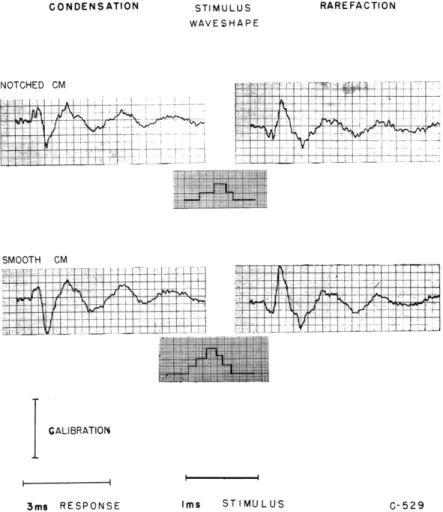
ALIBRATION 3ms RESPONSE I i Ims STIMULUSFig. XIII-9.
Upper traces: Notched microphonic response for the multipulse
stimulus
shown directly below.
The recording was made from a round-window
electrode.
The neural response has been minimized by the addition of
background noise.
(Peak amplitude of multipulse stimulus, -50 db re
2. 6 volts; noise level, -30 db re 1 volt rms; voltage calibration,
60 pv;
number of responses averaged, 256.) Lower traces: Unnotched
micro-phonic recorded in response to stimulus waveform shown.
(Stimulus
intensity, -50 db re 4. 9 volts; other parameters same as in (a).)
Fig. XIII-10.
Schematized CM responses showing: (a) the usual
shape obtained with 0. 1-msec pulses, and (b) the
modified response with a "dead space" before the
first downward deflection.
SPACE
C-529
_A
W
4I ,
(XIII. COMMUNICATIONS BIOPHYSICS)
CONDENSATION STIMULUS WAVESHAPE
RAREFACTION
Ims RESPONSE
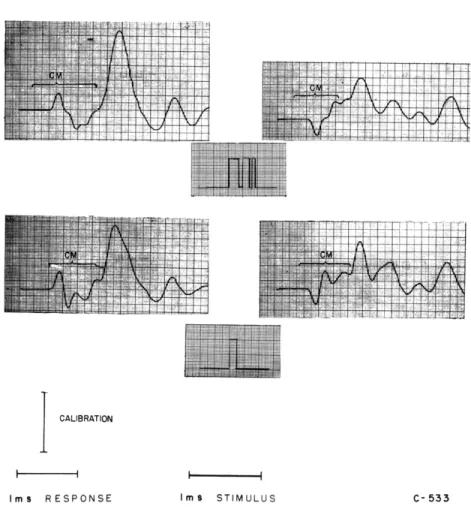
Fig. XIII- 1I.
i STIMULUS
Ims STIMULUS C- 533
Upper traces: Microphonic response with "dead space" as recorded from the round window. Note that the first part of the trace is microphonic but that the neural is superimposed on CM. (Multipulse stimulus level, -40 db re 1 volt; number of responses averaged, 32; voltage calibration, 125 iv.) Lower traces: Same as upper traces, except that the stimulus is 0. 1-msec pulse.
responses for the two polarities are similar. At high intensities, the rarefaction
response has a shorter latency. The differences between these neural responses and
responses to simple 0. 1-msec pulses are: (a) the threshold for visual detection of
single responses (VDL) is approximately 20 db higher for the multipulse stimulus;
(b) the latency difference of 0.4 msec for responses to rarefaction and condensation
stimuli at high intensities is larger for the multipulse stimuli than it is for the
rectan-gular pulses for which this difference is only 0.2 msec.
These differences can now be compared with predictions from the model (1):
(XIII. COMMUNICATIONS BIOPHYSICS)
(a) since the low intensity mechanism is presumably respresented by the "slow-potential"
and we have not measured this potential in response to the multipulse stimulus, we
cannot say whether this aspect of the model is supported or not; (b) since the first
occurrence of a positive (downward) swing of the microphonic response for the
conden-sation polarity is delayed for multipulse stimuli, we would predict that the latency
dif-ference between neural responses to condensation and rarefaction stimuli at high
intensities would be increased to approximately 0. 4 msec.
Hence, we can say that the
results obtained with multipulse stimuli agree reasonably well with the predictions of
the model
-
insofar as we are able to compare observations with predictions.
2.4
2.2
2.0
S1.8
-E
Fig. XIII-12. Superimposed plots of N
1peak latency
z 1.6 . versus intensity for 0. 1-msec pulses and
- 0.1 msec CLICK
for
the "dead-space" stimulus shown inRAREFACTION
Fig.
1.
1.4 - CONDENSATION MULTIPULSE STIMULUS 1.2 _ RAREFACTION D CONDENSATION C - 533 -100 -80 -60 -40 -20 0 INTENSITY (db)Although the experiment just described indicates that the timing of responses at
high intensities depends on the waveform of the microphonic, it does not clearly
indi-cate what properties of the microphonic determine the latency of the neural response.
Two experiments were designed to test whether neural latency is related to the
occur-rence of a microphonic potential of either positive value or positive slope.
In one experiment a prolonged microphonic such as that shown in the top trace of
Fig. XIII-6 (and repeated in the bottom trace of Fig. XIII-9) was modified slightly by
placing a notch in the first deflection, which introduced both positive and negative
slopes, without allowing the value of the potential to reverse (top trace of Fig. XIII-9).
It was observed that the insertion of this notch made little difference in the response
latencies; this suggested that the microphonic may have to become positive before it
can initiate the neural.
(See Blatt (5) for a complete set of data.) This interpretation
was supported by the results of another experiment in which the stimulus pulses were
manipulated so as to produce a "dead space" in the microphonic response, as shown
(XIII. COMMUNICATIONS BIOPHYSICS)
schematically in Fig. XIII-10. Again, for this waveform a positive (downward) slope occurs (relatively) long before the microphonic actually goes positive. The actual waveforms of CM obtained are shown in Fig. XIII-11, compared with microphonic responses to a 0. 1-msec pulse. Latency versus intensity curves are shown for these two stimulus waveforms in Fig. XIII-12. It is observed that the latency of the condensation-click response is increased with the "dead-space" stimulus. Since the first positive swing of the microphonic is delayed, while the first positive sloping micro-phonic is not, this result supports the hypothesis that the initiation of the neural is asso-ciated with an event in which our electrodes record a positive CM.
It should be pointed out, that we have not used the two-mechanism model to predict the response amplitude. Although some of the data presented suggest that further
prop-erties might be added to the model to include a description of amplitude changes, we shall defer discussion of these aspects until a later report.
H. Blatt, W. T. Peake References
1. W. T. Peake, An Analytical Study of Electric Responses at the Periphery of the Auditory System, Technical Report 365, Research Laboratory of Electronics, M.I.T., March 17, 1960.
2. N. Y-S. Kiang and W. T. Peake, Components of electrical responses recorded from the cochlea, Ann. Otol. Rhinol. Laryngol. 69, 448-458 (1960).
3. H. Davis, C. Fernandez, and D. R. McAuliffe, The excitatory process in the cochlea, Proc. Nat. Acad. Sci. 36, 580-587 (1950).
4. W. A. Rosenblith and M. R. Rosenzweig, Latency of neutral components in round window response to pure tones, Fed. Proc., Vol. 11, p. 132, 1952.
5. H. Blatt, An Investigation of Relations Between Cochlear Microphonic Potentials and Auditory Nerve Responses, S. M. Thesis, Department of Electrical Engineering, M.I.T., January 1961.
C. LATERALIZATION OF ANTIPHASIC CLICKS
Previous experimental results appeared to show a correlation between judgments made by humans in psychoacoustic experiments and neuroelectric responses from anes-thetized cats (1). Previously, we had data from only one human subject. A test of the generality of those findings has revealed certain difficulties that lead us to qualify our previous conclusions.
The pertinent neurophysiological data are responses to acoustic clicks recorded from the auditory nerve with gross electrodes (2). Certain differences are observed in the responses which depend on whether the clicks produce initial inward or outward motion of the eardrum. The two click polarities are referred to as condensation clicks
(XIII. COMMUNICATIONS BIOPHYSICS)
(CC) and rarefaction clicks (RC), respectively. At low intensities (0-40 db re VDL) the responses are nearly the same for both polarities. At high intensities (70-100 db), CC and RC response waveforms are similar, but the RC response occurs with a latency that is approximately 0. 2-msec shorter than the CC response. For intermediate intensities
(50-60 db) CC and RC responses differ considerably in waveform.
These data suggested that interesting results might be obtained for "antiphasic" click stimuli in a lateralization experiment, that is, CC to one ear, RC to the other. In such an experiment, clicks are delivered through earphones to a subject who is asked to make judgments about the apparent location of the sound source. If clicks of equal intensity are presented to the two ears simultaneously, the subject reports that the apparent source lies midway between the ears. If one click precedes the other slightly, the apparent source moves toward the ear that is stimulated first (3, 4).
A simple model would postulate that the location of the source is determined in part by a comparison of the latencies of the neural responses from the two ears. One would
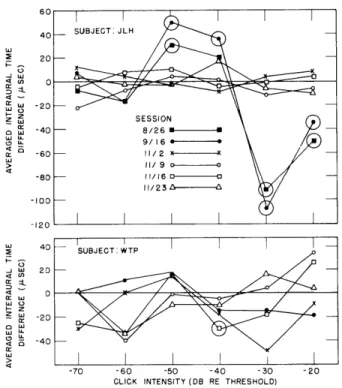
SUBJECT: WTP
-70 -60 -50 -40 -30 -20
CLICK INTENSITY (DB RE THRESHOLD)
Fig. XIII-13.
Averaged interaural time difference versus intensity for two subjects
(several sessions for each subject).
Large circles around points
indi-cate that they differ from zero at a 1 per cent significance level.
In a
few cases a centered apparent source was judged to occur with
inter-aural time differences of more than 300 isec. Since these points seemed
to be distinct from other judgments, all values above 300 isec were
discarded.
Except in these few instances, each point represents an
average of 8 judgments.
(XIII. COMMUNICATIONS BIOPHYSICS)
predict from this model that for high-intensity antiphasic clicks, subjects would require that the CC precede the RC if the apparent source is to be centered. At low intensities, a centered apparent source would be produced with a zero interaural time difference.
Our previous results on one subject bore out this prediction (1). However, we have since obtained more equivocal results from two other subjects. By using the same technique as previously reported, the subjects adjusted interaural time delay to obtain a centered apparent source for 6 stimulus intensities. Averages of 8 judgments at each intensity are plotted in Fig. XIII-13 for several sessions in which the experiment was repeated.
In the first two sessions (9/16 and 11/2) subject JH's judgments were similar to those obtained previously (1). A statistically significant shift away from zero occurs for moderate and high intensities. The shift at the high intensities is in the predicted direction. However, in four later sessions this subject showed no significant shifts away from zero. In the last of these six sessions, this subject sometimes had great difficulty making the judgments, and several of the settings exceeded 300 msec. The other sub-ject's (WTP) judgments showed no significant tendency to deviate from zero. This intra-subject and even interintra-subject variability is disturbing.
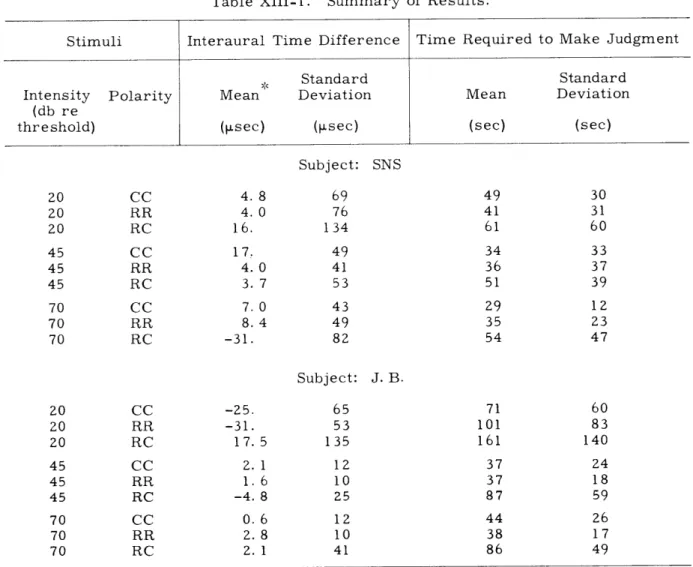
A different experiment was then attempted in order to bring out a correlation between psychophysical and neuroelectric data. Instead of measuring an interaural time differ-ence and interpreting it in terms of the latency-differdiffer-ences in N1 responses, we asked the question "Are condensation and rarefaction clicks equivalent at low intensities, but not at high intensities ? " To answer this question, we required subjects to adjust the interaural time difference to give a centered apparent source, and then we compared the variability in the interaural time differences for antiphasic clicks with the varia-bility obtained at the same intensities with "cophasic" clicks. We predicted that no dif-ference would appear between antiphasic and cophasic presentations at low intensities, but that the variability would be larger at moderate and high intensities because the central nervous system would experience greater difficulty in comparing responses that differ in waveform. The details of the experimental procedure are reported elsewhere (5). A summary of the results obtained on two subjects is given in Table XIII-1. The statistics were calculated from 40 judgments made for each stimulus condition. In all cases except one, the standard deviations obtained with antiphasic stimuli are signifi-cantly larger (at the 1 per cent significance level) than those obtained at the same inten-sity with cophasic clicks (exception, subject SNS at 45 db). The mean times required to make the judgments are also larger for the antiphasic cases. Hence, these psycho-physical data seem even less correlated with the electrophysiological findings than those
described previously. They show that a difference exists between the cophasic and anti-phasic situations even for low intensities. These findings indicate either that the brain
Table XIII-1. Summary of Results.
Stimuli Interaural Time Difference Time Required to Make Judgment
Standard Standard
Intensity Polarity Mean Deviation Mean Deviation
(db re
threshold) (isec) (4sec) (sec) (sec)
Subject: SNS 20 CC 4. 8 69 49 30 20 RR 4. 0 76 41 31 20 RC 16. 134 61 60 45 CC 17. 49 34 33 45 RR 4.0 41 36 37 45 RC 3. 7 53 51 39 70 CC 7. 0 43 29 12 70 RR 8.4 49 35 23 70 RC -31. 82 54 47 Subject: J.B. 20 CC -25. 65 71 60 20 RR -31. 53 101 83 20 RC 17. 5 135 161 140 45 CC 2. 1 12 37 24 45 RR 1. 6 10 37 18 45 RC -4.8 25 87 59 70 CC 0. 6 12 44 26 70 RR 2. 8 10 38 17 70 RC 2. 1 41 86 49
For cophasic stimuli a lus channel leads the other. tion click precedes.
positive interaural time difference indicates that one stimu-For antiphasic stimuli positive indicates that the
rarefac-(XIII.
COMMUNICATIONS BIOPHYSICS)
responses at all intensity levels, or that our observations on N1 in the cat do not reflect all of the significant differences that determine the response behavior.
In conclusion, we feel that we have shown some correlation between certain neuro-physiological data and certain psychophysical judgments. As is often the case, the parallel between the two sets of results is by no means complete, since there are many mechanisms involved in lateralization judgments that we know nothing about. An addi-tional complication is introduced at high intensities because the acoustic stimuli can spread from one earphone to the opposite ear, so that the stimulation of the two ears is not equivalent to that used in the physiological experiments in which the cats were stimu-lated monaurally. It has recently been reported that similar lateralization experiments, carried out at Bell Telephone Laboratories, Inc., have shown an interaural time differ-ence of 200 4sec for fusion of antiphasic clicks (6). Both their psychophysical method and stimulus equipment differ from ours, so that it is difficult to determine the source of the discrepancy in results.
F. T. Cummings, J. L. Hall II, W. T. Peake
References
1. R. C. Beal, T. N. Hastings, J. L. Hall II, and W. T. Peake, Lateralization of clicks of opposite polarity, Quarterly Progress Report No. 58, Research Laboratory of Electronics, 237-240, July 15, 1960.
2. W. T. Peake, An Analytical Study of Electric Responses at the Periphery of the Auditory System, Technical Report 365, Research Laboratory of Electronics, M.I. T., March 17, 1960.
3. B. H. Deatherage and I. J. Hirsh, Auditory localization of clicks, J. Acoust. Soc. Am. 31, 486-492 (1959).
4. E. E. David Jr., N. Guttman, and W. A. van Bergeijk, Binaural interaction of high-frequency complex stimuli, J. Acoust. Soc. Am. 31, 774-782 (1959).
5. F. T. Cummings, Auditory Lateralization of Clicks, S. B. Thesis, Department of Electrical Engineering, M. I. T., June 1961.
6. J. L. Flanagan, E. E. David Jr., and B. J. Watson, Binaural lateralization of cophasic and antphasic clicks, Sixty-first Meeting of the Acoustical Society of America, May 10-13, 1961 (Paper H9, Abstract).
D. LOW-FREQUENCY ELECTRIC RESPONSES FROM THE AUDITORY CORTEX
Low-frequency electrical activity in the brain has been studied much less than activity that is more readily amplified. Kohler (1), Gumnit (2, 3), and Arduini (4) have reported slow potential shifts in the cat's cortex resulting from auditory stimulation. Our objective here was to examine such slow responses with the use of the Average Response Computer (ARC-1) (5).
(XIII. COMMUNICATIONS BIOPHYSICS)
Records were obtained with silver-silver chloride macroelectrodes at the center of Al
in the auditory cortex; the reference electrode was placed in the exposed muscle of
the
neck. Stimuli were bursts of 200 clicks/sec, having durations of 400 msec, or
less;
these stimuli were delivered through a type PDR-10 earphone.
The response was
amplified with a Keithley 603 electrometer amplifier and recorded, together with
a
stimulus marker, by an FM tape recorder.
VOLTS
Fig. XIII-14. Average of 30 responses computed on ARC-1.
Stimulus: burst of clicks
of 100-msec duration at a rate of 200 clicks per second; one burst every
10 seconds; click intensity,
10 db above VDL; nembutal anesthesia;
rezero time and magnitude are defined on the drawing.
The parameters used to describe the responses are displayed in Fig. XIII-14.
The
averaged response shown is the type most frequently observed. It consists of
the
pri-mary response, followed by a 200- v surface positive shift which lasts approximately
1. 6 sec. This is followed by a slight negative shift with a gradual return to the
base
line. Considerable variability was observed.
In one series of measurements, the
positive shift began to decay to the base line immediately after its onset. In another
series a second surface positive shift formed after the surface negative shift.
Several relations between stimulus and response parameters were noted.
The
"magnitude" of the response increases with an increase in the stimulus intensity.
On
the other hand, as stimulus duration is increased, there is a decrease in the
"rezero"
time. An increase in the time between stimulus bursts was weakly reflected
in an
increase of the response magnitude.
When stimuli were repeated at 10-second intervals (as shown in Fig. XIII-14)
a second slight positive shift was often prominent in single ink-writer traces
approxi-mately 6 seconds after the stimulus. The magnitude of any deflection on an averaged
response depends on the timing (with respect to the stimulus) and the amplitude
of the
Z44
(XIII. COMMUNICATIONS BIOPHYSICS)
response. Thus a high-amplitude, but poorly time-locked, response might appear as a small deviation in the averaged plot. This seems to be the situation in the present case. Direct observation of the response, with an ink-writer, shows that the second positive shifts are similar, in general shape and size, to spontaneous "spindle burst" activity. This activity is thought to be due to the anesthetic (4). It is suggested that the second positive shift is similar to spindle activity, and that there is a significant
time-locking between stimulus and the envelope of this activity.
A. G. Braun, R. J. Creasy, G. L. Gerstein
References
1. W. Kohler, W. D. Neff, and J. Wegener, Currents of the auditory cortex in the cat, Supplement 1, J. Cellular Comp. Physiol., 1955.
2. R. L. Gumnit, D. C. potential changes from auditory cortex of cat, J. Neuro-physiol. 23, 667-675 (1960).
3. R. J. Gumnit and R. G. Grossman (Personal communication, April 1961). 4. A. Arduini, M. Mancia, and K. Mechelse, Slow potential changes elicited in the cerebral cortex by sensory and reticular stimulation, Arch. Ital. Biol. (Pisa) 95,
127-138 (1957).
5. W. A. Clark, R. M. Brown, M. H. Goldstein, Jr., C. E. Molnar, D. F. O'Brien, and H. E. Zieman, The average response computer (ARC): A digital device for com-puting averages, and amplitude and time histograms of electrophysiological response, Trans. IRE, Vol. BME-8, pp. 46-51, 1961.