HAL Id: halshs-01649493
https://halshs.archives-ouvertes.fr/halshs-01649493v2
Preprint submitted on 28 Feb 2018
HAL is a multi-disciplinary open access archive for the deposit and dissemination of sci-entific research documents, whether they are pub-lished or not. The documents may come from teaching and research institutions in France or abroad, or from public or private research centers.
L’archive ouverte pluridisciplinaire HAL, est destinée au dépôt et à la diffusion de documents scientifiques de niveau recherche, publiés ou non, émanant des établissements d’enseignement et de recherche français ou étrangers, des laboratoires publics ou privés.
Ownership and Hospital Behaviour: Employment and
Local Unemployment
Andrew E. Clark, Carine Milcent
To cite this version:
Andrew E. Clark, Carine Milcent. Ownership and Hospital Behaviour: Employment and Local Un-employment. 2018. �halshs-01649493v2�
WORKING PAPER N° 2017 – 51
Ownership and Hospital Behaviour:
Employment and Local Unemployment
Andrew E. Clark Carine Milcent
JEL Codes:
Keywords: France, Hospitals, Management, Competition, Public Employment, Unemployment
P
ARIS-
JOURDANS
CIENCESE
CONOMIQUES48, BD JOURDAN – E.N.S. – 75014 PARIS
TÉL. : 33(0) 1 80 52 16 00= www.pse.ens.fr
CENTRE NATIONAL DE LA RECHERCHE SCIENTIFIQUE – ECOLE DES HAUTES ETUDES EN SCIENCES SOCIALES
ÉCOLE DES PONTS PARISTECH – ECOLE NORMALE SUPÉRIEURE
1
Ownership and Hospital Behaviour:
Employment and Local Unemployment
A
NDREWE. C
LARK ANDC
ARINEM
ILCENT*
Paris School of Economics (PSE) - CNRS Paris School of Economics (PSE) - CNRS
February 2018
Abstract
In this paper, we address two issues: i) how hospital employment changes with local unemployment, according to the type of hospital ownership, and ii) whether this relationship changed after the implementation of a pro-competitive reform that made hospitals more similar. A 2006-2010 French panel of 1,695 hospitals over five waves allows us to consider within-hospital employment changes. We first find that higher local unemployment is associated with greater employment in State-owned hospitals, but not for any other hospital ownership type: French local authorities then seem to respond to depressed local labour markets by increasing employment in State-owned hospitals. After the full implementation of the pro-competitive reform hospital funding became based only on activity and no longer on some historical budget. Theoretically, the new reimbursement system should break the relationship between public-hospital employment and local unemployment. Our results reveal that the reform worked as expected in less-deprived areas: reducing employment and eliminating the correlation between local unemployment and State-owned hospital employment. However, in higher-unemployment areas, public-hospital employment remains
2
counter-cyclical. Poor local labour-market health then seems to trump financial incentives in determining employment in public hospitals.
Keywords: France, Hospitals, Management, Competition, Public Employment,
Unemployment.
* Corresponding Author: Carine Milcent, PSE (UMR 8545), 48 Boulevard Jourdan, 75014 Paris, France. Tel: +33-1-80-52-19-08; E-mail: carine.milcent@psemail.eu.
We are grateful to minar participants at Fudan University, the “Hôpital: Regards croisés” workshop (Paris), and the Shanghai Forum conference for help and useful remarks.
3
Ownership and Hospital Behaviour:
Employment and Local Unemployment
A
NDREWE. C
LARK ANDC
ARINEM
ILCENT1. Introduction
The way that healthcare is organised will affect the behaviour of healthcare suppliers, including hospitals. The healthcare system can be characterised not only by the private-sector share of hospitals, including those that are for-profit, but also by the list of publicly-available performance indicators and the way in which actors are reimbursed. Kolstad (2013) shows that information on performance that was unrelated to patient demand led to an intrinsic response by hospitals that was larger than their response to profit incentives.
In this paper, we consider the employment behaviour of different kinds of hospitals according to their ownership. In particular, we examine the relationship between local politics, hospital ownership, and changes in payment systems on the one hand, and hospital employment on the other. Our analysis extends earlier cross-sectional work and shows that local politics affect public-sector employment.
Economic efficiency is a central question here, trading off healthcare expenditure for healthcare quality. As a chapter in the Handbook of Health Economics (Sloan, 2000) notes, one of the three fundamental questions in the economic literature is which form of ownership is the most efficient in the healthcare industry. The scope for public intervention in markets has been discussed all over the world (Le Grand and Bartlett, 1993). The public sector accounts for a significant share (15-20%) of employment in most industrialised countries (Melly and Puhani, 2011). However, the exact definition of what ‘public’ means in terms of
4
employment is not fixed and has changed over time. In European countries, the status of employees working in the public sector has changed from being civil servants to long-term contract employees. This hybridisation of hospital staff types and the focus on economic efficiency has not come without conflict (Choi et al., 2011). A number of recent papers have developed methods to quantify management practices in order to measure managerial quality across different firms (Jacobs et al., 2006; Bloom and Van Reenen, 2007; Bloom et al., 2010).
We here consider employment decisions as one aspect of management practice. Public-hospital employment in France may be expected to reflect both healthcare needs and political prerogatives, as the director of French public-hospital Boards (at the time of our data) was a local politician. Controlling for the greater healthcare needs in high-unemployment regions, we ask whether local unemployment has a different effect on public-hospital employment than on that of other hospital types.
Our work is particularly relevant to the debate over the role of competition in improving hospital productivity. Bloom and Van Reenen (2007) suggest that poor management practices are more prevalent in firms that are faced with less product-market competition. Our work here underlines the potential presence of other factors that may distort the link between competition and hospital productivity.
Our paper is also closely related to the literature on healthcare providers (Brekke et al., 2011, Chalkley and Malcomson, 2000, Ellis and McGuire, 1986, and Mougeot and Naegelen, 2008). One strand of this literature has focused on competition in healthcare (Gowrisankararan and Town, 2003, Propper, 2008, Shortell and Hughes, 1988, and Volpp et
al. 2003). In recent years, policymakers in many countries have experimented with various
ways of increasing the effective competition in healthcare in order to raise productivity. A mainly US literature has suggested that under certain conditions (regulated prices and observable quality) competition may improve quality (Kessler and McClellan, 2000), even
5
though the consensus in the literature is not complete. The effect of competition on mortality is likely to depend on the reimbursement rate (Shen, 2003). If hospitals are underpaid for patients with a given insurance, such as Medicare patients, they have little or no incentive to compete for them by improving quality. Recent pro-competitive hospital reforms in the UK have been argued to have increased quality (Cooper et al., 2011, and Gaynor et al., 2013). Bloom et al. (2015) exploit political concerns over one particular policy, healthcare provision, and use the share of marginal political constituencies around each hospital as an instrument for the number of nearby competing hospitals. Politicians in the UK almost never close hospitals in politically-marginal constituencies, which produces greater hospital competition in areas with more marginal constituencies. This competition is shown to result in better hospital management.
In France, healthcare provision is mixed: the providers of outpatient care are largely private, while hospital beds are mainly public or private non-profit. In the private sector, for-profit hospitals compete with each other. Until the 2000s, the public sector was largely immune from standard market forces. A global budget was adopted for public-sector hospitals, mainly based on their historical budget rather than being related to their real level of activity. This changed over 2004 to 2008, with the gradual introduction of a prospective payment system based on hospital activity (diagnosis-related groups, or DRGs) to promote efficiency by competition. In a DRG-based system with fixed prices, the competition is on quality. A hospital does well by admitting many patients and releasing them at as low a cost as possible with an attractive level of quality.
The financial situation of the public system has deteriorated since the 1980s, and the DRG-pricing system on its own offers no way of controlling the volume of care. To avoid radical increases in the volume of care, the introduction of DRG-based pricing was accompanied by a fixed global budget envelope for hospital spending. According to the Law
6
on the financing of social security (LFSS), this budget is voted on annually by the French parliament. With this fixed budget there is no way for total costs to rise. The incentive to admit as many patients as possible through a competitive market is even stronger than without the fixed budget. This DRG-based payment rule was introduced across the whole set of hospitals, all of which are now reimbursed according to the same rules. The competitive market is now composed of public-sector hospitals (State-owned hospitals and Not-for-Profit hospitals) and For-Profit hospitals.
The outcome we consider here is employment in 2006-2010 panel data on the universe of French hospitals; we in particular ask how this is related to local unemployment. We are able to exploit two features of French hospitals to identify a particular relationship between public-sector employment and local unemployment. First, there are three different hospital types: For-Profit, Non-Profit, and Public hospitals. Non-Profit hospital staff are managed in the same way as staff in the private sector, but at the same time Non-Profit hospitals have a public-service mission in the same way as hospitals in the public sector (See Section 2.1). Second, we appeal to the pro-competitive reform that was fully-implemented in all hospitals in 2008. We thus ask i) whether there is a link between hospital employment and local unemployment, according to hospital ownership, and ii) if so whether the implementation of the DRG-based system affected this relationship.
Our analysis of employment incorporates hospital fixed effects to control for time-invariant hospital attributes that may determine their employment. In further sensitivity analysis we also incorporate time-varying within-hospital variables. For-profit hospitals can decide who they treat, while this is not the case for public and NFP hospitals due to their public-service mission. We find that public hospitals employ more staff than do private and
7
NFP hospitals, conditional on size and the illnesses treated; we also show that this employment gap is systematically correlated with local unemployment.
The above two results are found in Clark and Milcent (2011). However, the analysis there was cross-sectional, using only one year of data (1999). The key potential concern is then that of unobserved heterogeneity between hospitals. We here show that this relationship between public-hospital employment and local unemployment holds also using within-hospital variation.
The second question is whether the implementation of this DRG-based system affected the relationship between unemployment and public-hospital employment. We estimate employment equations both before and after the introduction of the pro-competition hospital reform using the same hospital fixed-effect model as above. The reform was expected to reduce the gap in hospital staff per bed according to ownership: this is indeed what we find. However, the reform has not completely broken the link between public-hospital employment and local unemployment, with local deprivation playing a key role. We find that the reform worked as expected in less-deprived areas: it reduced employment and eliminated its correlation with local unemployment in public hospitals. On the contrary, in higher-unemployment areas public-hospital employment continues to be counter-cyclical.
The remainder of this paper is structured as follows. Section 2 explains the French context and the reform that took place in the years up to 2008. The data are described in Section 3, and Section 4 presents the empirical results. Section 5 discusses a number of extensions and robustness checks, and Section 6 concludes.
8
2. French hospital types and the introduction of competition
2.1 The French hospital system
We here first present the French public health-insurance system, and then set out the different types of French hospitals according to their ownership.
Public National Health Insurance (the Sécurité Sociale) is compulsory in France, and covers all of the resident population; it is financed by employee and employer contributions as well as increasingly via taxation. This public insurance is a single-payer system: this eliminates any concerns about potential cost-shifting behaviour by providers, negotiation between providers and payers, or different reimbursement schemes for different patients. The reimbursements cover almost all medical services in hospital, except for the additional fixed fee per day for catering and accommodation and particular requirements (such as having a private room): over 80% of inpatient-care costs whatever the sector are covered by public insurance.
In this paper, ‘hospitals’ refers to all healthcare establishments with an acute care unit. As in many countries, France has both private- and public-sector hospitals. There are two broad types of the latter, according to whether they are non-profit (NFP) or State-owned hospitals (SOH). We shall refer to these three hospital types as NFP, private and public (or SOH), for simplicity. All three hospital types have a non-negligible share of the French healthcare market. As a rough guide, considered in terms of full-time equivalent employees in our current data over the 2006-2010 period, State-owned hospitals accounted for just over 80 per cent of this sector, with the corresponding figures for NFP and private hospitals being 6 and 12 per cent respectively.
Hospital location is mainly historical. Any attempt to establish or relocate a hospital has to be accepted by the French regional health organisation. This is a long process with a
9
number of complex constraints and parameters. We will therefore mostly take the location of hospitals to be exogenous in our sample (although we will consider a role for changing numbers of rival hospitals in Section 5).
Staff employment contracts are similar in private and NFP hospitals, where staff are either self-employed (mainly the Doctors), salaried with a long-term contract, or salaried under a variety of short-term contracts (these latter include the contrat nouvelle embauche (CNE) of 2005 and the four main types of contrats aidés between 2005 and 2009). On the
contrary, public-hospital employees are either civil servants (which workers are very difficult to fire) or employed under the same variety of short-term contracts as above. These short-term contracts are restricted in terms of the number of times they can be renewed; they in practice mainly cover lower-skilled workers. The government’s aim here is to encourage establishments to transform these short-term contracts into long-term employment contracts in NFP and private hospitals, and into permanent civil-servant jobs in public hospitals.
Hospitals also differ in how they make decisions. The management of public hospitals is quite bureaucratic, with decisions following administrative procedures. The hospital’s Board of Directors determines public-hospital employment. Over the period of our data, this Board included local-government representatives and its President was systematically a local politician (and often the Mayor). The managerial reform that was introduced as part of the HPST Law (Hôpital, patients, santé, territoires) of July 21st 2009 (which came into force
starting in 2010) weakened this local political influence in public hospitals, replacing the Board of Directors by an Advisory Board, the president of which, elected by the Board’s members, may be a local politician but also some other competent person. It is worth emphasising that this reform only started to be introduced during the last year of our data: we therefore do not expect it to influence our results.
10
It is important in the context of our analysis to note that the Boards of Directors of private and NFP hospitals include neither local government representatives nor the Mayor, with decisions being more likely to be made jointly by the medical and administrative staff.
The particularity of the French system is therefore the presence of a specific type of private hospital: NFP hospitals that are managed like for-profit private hospitals but which are regulated (particularly in terms of not being able to turn patients away) like public hospitals.
In addition to employment contracts and management decision-making, the three hospital types also differ in their reimbursement schemes. These are discussed below.
2.2 Hospital reimbursement and the introduction of competition
Hospital reimbursement in France depends only on hospital ownership and the illnesses treated. It progressively changed over the 2004-2008 period.
Prior to 2004, SOH and NFP hospitals received a global budget, which was historically-determined and did not reflect current hospital activity. Starting in 2004, a DRG-based payment system (widely known in the US as a Prospective Payment System - PPS) was progressively implemented in both SOH and NFP hospitals. In the PPS, the portion of these hospitals’ budgets reflecting actual (previous-year) activity, as measured by French-DRGs, rose over time from zero in 2003 to 10% in 2004, 25% in 2005, 35% in 2006, 50% in 2007 and 100% in 2008.
For-Profit hospital reimbursement is somewhat different to that in the public sector. Prior to 2005, private hospitals were paid on a fee-for-service basis, with the fee differing from one region to another. With the above reimbursement reform, private hospitals switched in 2005 from being paid by the act to being paid 100% according to the French-DRG. Figure 1 sets out a timeline showing these changes in reimbursement for the different hospital types, as
11
well as the hospital-management reform described above, for the period over which hospitals are observed in our data.
The reimbursement scheme for all French hospitals can therefore now be summarised as follows.
• F is the total budget for all hospital activity, as voted by Parliament.
• The total number of French-DRG points in hospital i (French-DRGi) is the weighted
sum (also known as the cost weight) of all the activities that were carried out in the hospital in the previous year.
• The value of the point, v (which determines hospital reimbursement), is F/(sum of
French-DRGi over all hospitals). This calculation of v ensures that the budget F is
exactly spent.
• The reimbursement of hospital i is then given by French-DRGi*v.
A hospital that carries out more activities (via care or surgery, for example) will then earn more as its DRG score will be higher; however, other hospitals will earn less as the value of the point v will fall.
From 2008 onwards, the reimbursement rule has therefore been the same for all hospital types. The only remaining difference by ownership type regards the number of DRG points assigned to a particular intervention or care activity, which may be higher or lower in private as compared to public or NFP hospitals. The budget for SOH and NFP hospitals as well as FP hospitals is entirely determined by their current activity. The system thus now represents a zero-sum game, where each hospital has an incentive to try to outdo the others. A hospital that maintains the same activity from year to year, while other hospitals increase theirs, will see its budget fall over time.
12
2.3 Hospital employment and the labour market
Our first goal is to consider the relationship between hospital employment and local unemployment. Using 1999 cross-sectional data, Clark and Milcent (2011) found that hospital employment in France was consistently higher in public hospitals than in NFP or private hospitals. By matching in local labour-market information, they were also able to show that public-hospital employment was strongly positively correlated with the local unemployment rate, with no such relationship being found for the other hospital types. They concluded that these results were consistent with public hospitals providing employment in depressed areas.
However, even with detailed information on what hospitals do, this previous work may have suffered from omitted variables that were correlated with public-hospital activity and the local unemployment rate (which latter we cannot instrument successfully). One potential example might be local-area deprivation, the health effects of which are mainly felt in public hospitals (and in a way that is not picked up by number of patients and cost weight). More generally, patient type and hospital type may be correlated in an unobserved way. For example, public hospitals may admit more low-income patients who require more low-skilled staff to follow-up after medical procedures, for a given pathology and level of severity.
We here have panel data on hospitals, so that we can look at the relationship of hospital employment to local unemployment within the same hospital over time. As such, we avoid any problem of confounding unobserved time-invariant hospital characteristics: all of our results come from comparing the same hospital in different years.
Although panel data allows us to introduce hospital fixed effects, the types of activity that hospitals carry out may have changed over this five-year period, with knock-on effects on employment in the different types of hospitals: some of the jobs in all types of hospital are short-term contracts, making employment fairly easy to adjust both upwards and downwards. We formally control for hospital activity via the cost weight, from hospital administrative
13
records. Each hospital stay is associated with a Diagnosis-Related Group (DRG), and each DRG is allocated a ‘weight’ depending on the average cost of the inputs (e.g. nursing, diagnostic services and procedures) required to achieve the appropriate patient outcome. The hospital cost weight is the sum of all the DRGs of the stays in the hospital over the year. This index was first used in US; it is also used in France where it is called the ISA (‘indice
synthétique d’activité’).
Using hospital cost-weight data leads to the loss of some observations as a result of the merge. We systematically check that our results are robust to the omission of the cost-weight variable. Our analysis below will also control for illness severity (as measured by the severity level of each DRG) and a number of local-population characteristics (at the municipality level). The descriptive statistics of all of the variables used in the analysis appear in Table A1. Our second goal is to assess the impact of the introduction of competition between hospitals, as described in Section 2.1 above, on the relationship between public-hospital employment and local unemployment. One way of reducing the cost of care is to cut hospital employment. One hypothesis is then that (relative to private hospitals, for which payment schemes have remained unchanged since 2005) public hospitals became progressively less reactive to local labour-market unemployment as competition rose progressively between 2004 and 2008. We thus ask whether the different hospital types now look more similar to each other in staffing terms. In other words, we should observe no correlation between local unemployment and hospital employment, whatever the hospital type.
Further, assuming that employment was initially ‘too high’ in State-owned hospitals, as compared to the others, we should also see falling employment over this period, and in particular over the 2006-2008 period when the policy was being progressively implemented.
The regressions include year dummies. The estimated coefficients on these will reveal the time trend in employment in different types of hospitals. This movement over time will likely
14
reflect the economic cycle and various reforms, but also other macro factors such as hospital technology and aging populations.
We evaluate the determinants of the log of hospital employment for different ownership types in Table 2 using the specification given in equation (1) below.
log (𝐸𝑚𝑝𝑙𝑜𝑦𝑚𝑒𝑛𝑡)!,! = 𝛽!𝑈!,! + 𝛽!+ 𝛽!+ 𝐶𝑜𝑛𝑠𝑡𝑎𝑛𝑡 + 𝑣!,! (1)
Here U!,! is the unemployment rate (in %) of the area where hospital h is located at time 𝑡, β! is the vector of year dummies, β! the vector of hospital fixed effects, and v!,! the vector of residuals. The results will be discussed below in Section 4; before we do so, Section 3 describes the data used in our analysis.
3. Data
Our administrative data comes from the 2006-2010 SAE (Statistiques Annuelles des
Etablissements) survey, which collects information on hospital staff and activities. We match
in local-area information on municipality age distribution, unemployment and nationality from the 2006-2010 French Census. The unemployment rate used here is the unemployment rate in the municipality in which the hospital is located. The data covers the universe of French hospitals. This data is obtained from the French Health Ministry (DREES-BES No.070/12) and the Agency of Hospital Information (ATIH) (CNIL decision DE-2012-020).
The SAE includes information on hospital size (the number of beds and the number of annual admissions) and the type of care that is provided to patients. It also provides information on the number of staff in five different professional categories: administrative staff, support staff, medical staff, paramedical staff and Doctors. The support staff generally consists of unqualified workers, such as those working on buildings and grounds. Paramedical
15
staff covers, for example, those providing social assistance to patients. This includes qualified and unqualified staff such as psychologists, physical therapists and dieticians and social-service workers. Medical staff includes Nurses (including Specialised Nurses) and nursing auxiliary staff. These five staffing groups differ notably by qualification level: the support staff are the least-qualified and Doctors the highest-qualified. Nursing, paramedical staff and administrative staff include both qualified and unqualified workers. For example, some of the nursing auxiliaries do not have professional training (namely the ASH: ‘agent de service
hospitalier’).
The number of administrative, support and (salaried) medical staff in each hospital are calculated from readily-available information on hours worked to produce full-time equivalent figures. This figure is comparable between the three hospital types.
Table 1 shows the mean number of hospitals observed per year over our five-year period. These figures refer to the universe of French hospitals. Table 1 shows that hospitals are split roughly 50:50 between public and non-public status. Amongst the latter, just over 20% are NFP, while the rest are private. The standard deviations in column 2 are only small, as perhaps might be expected: the number of hospitals changes only little over time. These changes come about via new hospitals opening, existing ones shutting down, or mergers between units. In fact, it is the latter that has predominated. Table A2 in the Appendix shows that the total number of hospitals (and indeed the number of each type of hospital) has fallen monotonically over the period under consideration. There were 125 fewer hospitals in 2010 than in 2006, representing a fall of 7%.
Table 1 also presents hospital staffing levels. Public hospitals employ more staff than do not-for profit or for-profit hospitals. One natural explanation here is hospital size. As is well-known, and as is shown in column 3 of Table 1, public hospitals are on average much larger than other hospitals, with just over 750 employees per hospital, as opposed to under 300 in
16
NFP hospitals and just over 160 in private hospitals. Large research and teaching health establishments are by regulation public-sector in France. This larger average size of public hospitals does however mask great disparities. There are both many large public hospitals (including the three agglomerated hospitals at the city level in Lyon, Marseille and Paris), and at the same time a considerable number of small public hospitals. Considering as ‘small’ hospitals with fewer than 75 employees, we find that 29% of private hospitals and 20% of NFP hospitals are small, but equally 23% of public hospitals.
We split hospitals up into four categories according to the number of annual admissions (up to 5 000, 5 000-10 000, 10 000-16 000, and over 16 000), which are the size cut-points used by the French Ministry of Health in their hospital comparisons. As expected, total employment increases in the number of admissions. However, the rise in total employment with the number of admissions is steeper in State-owned than the other hospitals. Similar results pertain if we use the number of beds as the measure of hospital size. Apart from within the first size-class, Public-sector hospitals employ more workers than do their non-public counterparts on average over the period (and by year).
The detailed structure of staff differs by hospital type. On average over 2006-2010 unqualified staff (namely support staff) represented 13% of employment in State-owned hospitals but between 8% and 6% in private hospitals (not-for-profit and for-profit). On the other hand, nurses represented 28% of State-owned hospital staff but 34% of staff in for-profit hospitals.
Figure 2 shows how hospital employment has changed over time. Here there is at first sight no evidence of any structural break in the employment series, which rise gradually over time. In particular, public-hospital employment grew over the 2006-2010 period (by 8.5%). But so did employment in NFP and private hospitals (by 14.4% and 12% respectively).
17
4. Results
The argument developed in Section 2 above suggested two potential elements affecting public-hospital employment over the period of our data: i) the response of French local authorities to depressed local labour markets by increasing employment in State-owned hospitals; and ii) the 2004-2008 pro-competitive reform that was progressively implemented. We expect the competitive reform to yield a smaller or even zero correlation between employment and local unemployment in public hospitals. The overall effect on public-hospital employment is then ambiguous and will depend on the relative size of these two phenomena. We will evaluate this empirically by the estimation of the coefficient on local unemployment in a public-hospital employment regression.
Our first simple regressions analyse the relationship between the log of hospital employment, the local unemployment rate, and four year dummies (with the first year, 2006, being the omitted category). Unemployment is calculated at the municipality level. As there are a few cases with more than one hospital of a given type within the same municipality, the standard errors in all regressions are clustered at the municipality level. We run regressions separately for each hospital type. These are linear regressions with hospital fixed effects: as such, the effect of local unemployment on hospital staff is identified solely by seeing how employment within a given hospital changes with the evolution of the local unemployment rate. No between-hospital information is used in the estimation of these coefficients.
We introduce the local unemployment rate in levels, rather than logs. One reason for doing so is that the data prefer a log-level to a log-log specification (in the sense that the R2 statistic is higher in the former). A second reason is that using the log of the unemployment rate compresses the variation in high-unemployment areas, and it is exactly this variation that we wish to exploit. It should be noted that all of our results do continue to hold in log-log
18
specifications. We have also checked for the influence of outliers by ensuring that all of the results below are robust to the omission of the three very large city-level hospitals in our data (and more generally to the omission of research and teaching hospitals).
The results appear in Table 2. The local unemployment rate is positively correlated with employment in public-sector hospitals in column 1. Columns 2 and 3 of Table 2 then carry out analogous regressions for NFP and private hospitals respectively. Here we find no significant employment correlation with the local unemployment rate. From the estimated coefficient in column 1, a one percentage-point increase in local unemployment will produce a 1.26% rise in employment in public hospitals (as exp(.0125) = 1.0126). It is worth emphasising that there is no unemployment effect on NFP employment. NFP hospitals have the same reimbursement rules as do State-owned hospitals, but local authorities have no power to determine hospital employment there. Staffing in public hospitals can then be viewed as a tool to counter local labour-market difficulties.
The estimated coefficients on the year dummies are of interest. These reveal continuing employment growth in NFP hospitals, and an essentially flat time profile in private hospitals. However, there does seem to be evidence of some kind of break for public hospitals, with employment higher in 2007 and 2008 than it was in 2006, but then lower in the last two years. This may be thought to be correlated with the complete application of the new reimbursement rules for public hospitals in 2008.
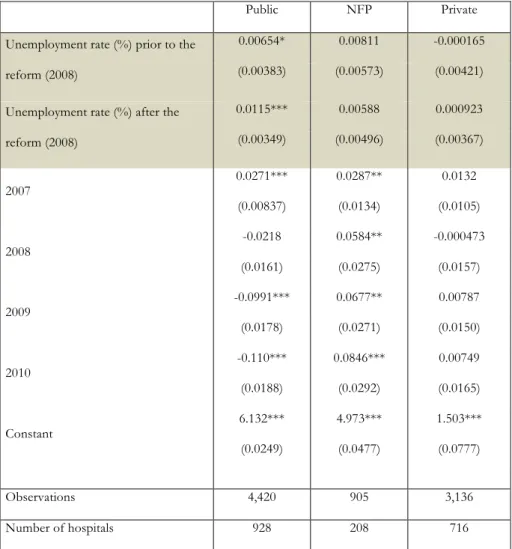
Table 3 explicitly introduces the date of the reform, by interacting local unemployment with two time dummies: one for the period before the reform was fully implemented (2006-2008), and another for the post-reform period (2009-2010). As the goal of this reform was to make public-sector and non-public sector hospitals more similar, we might expect the coefficient on local unemployment to be reduced after 2008. The question we ask here is whether the reform managed to break the link between public-hospital employment and local
19
unemployment: Have public hospitals become less Keynesian? The results in column 1 of Table 3 show no evidence of such an effect. The role of local unemployment continues to hold post-reform with an estimated coefficient that is significant at the 1% level. The estimated coefficients on the year dummies in Table 3 are very similar to those in Table 2.
One interpretation of this continued relationship is that the link between employment and the local labour market in public hospitals is larger when unemployment is higher. The reform period was marked by the financial crisis, which began in 2008 with the Lehman scandal and the crash of the housing-market bubble. Economic activity in the U.S. and many other countries subsequently declined significantly, with an associated rise in unemployment. In France, unemployment fell between 2006 and 2008 (from around 9% to 7.5%), but then rose to 9.1% in 2009 and 9.3% in 2010. Preserving employment then arguably became more salient at this time, leading to a greater correlation between unemployment and public-hospital employment as the financial crisis unfolded. In Table 3, the post-reform unemployment coefficient is indeed larger than that found pre-reform. This correlation would be counter-intuitive in terms of the incentives from the public-hospital reimbursement rules but can be explained by the labour-market context, with local political authorities using public-sector employment as a tool to mop up part of the associated rise in unemployment.
As a test, we appeal to the cross-section variation in unemployment. We split our sample according to whether the local unemployment rate is above or below the median level in our sample (which turns out to be 10%), and run panel regressions as in Table 3. The results in Table 4 show that for State-owned hospitals in municipalities with below-median unemployment, the estimated unemployment coefficient is barely significant pre-reform (significant at 13%) and totally insignificant post-reform. Any link between employment and the local labour market in public hospitals has then totally disappeared after the reform in better-off areas.
20
On the contrary, in ‘high-unemployment’ municipalities, the coefficient on unemployment is positive and significant for public hospitals both pre- and post-reform (with the latter coefficient being a little larger than the former). A plausible interpretation is then that public-hospital employment is used more intensively as a labour-market policy tool in slack labour-market conditions.
However, this does not mean that the reform ended up having no effect on hospitals. In Table 4, as in our other regression tables, the year dummies are significantly negative in 2009 and 2010 for public-hospital employment but not for the other hospital types. It is tempting to read these as reflecting the reform: faced with greater competition, the trend in public hospital employment became negative, even though it continued to react to local unemployment.
We next consider Table 3’s specification estimated separately by employee qualifications. The link from State-owned hospital employment to local unemployment appears for low- to medium-qualified employees in Table 5. Equally, the negative time trend in public hospital employment (conditional on the other control variables) only took place for these low- to medium-skill employees. There is no evidence of any time trend in the employment of high-skill workers in any type of hospitals. These results are consistent with the hypothesis that local authorities respond to depressed local labour markets by increasing employment in public hospitals. The qualified have more opportunities to find work, and the most vulnerable are the unskilled. These do seem to be the workers who benefited from local authorities’ public-hospital employment policy: a far less healthy labour market produced incentives for local unskilled job creation that trumped any dampening effect of the health reforms.
Our regressions so far have not included time-varying within-hospital variables. We might worry about there being more health demand as local unemployment rise. Table 6 includes a number of such variables. One of these is the hospital cost weight (as described in
21
Section 3), which picks up the different types of patient (in terms of illness gravity) appearing in a given hospital in different years. The regressions also control for the percentage of each level of illness severity admitted in hospital, the presence of an emergency unit, the number of beds (which is quite stable over the period) and the number of patients admitted, the percentage of day-surgery and the percentage of sessions (such as chemotherapy-sessions, for instance). The local demand for health is picked up by the municipality fixed effects, which are multicollinear with the hospital fixed effects. The standard errors continue to be clustered at the municipality level.
Table 6 displays the results after controlling for time-varying within-hospital variables. The results here can be compared to those in Table 3, which did not include these variables. There continues to be a significant effect of local unemployment on public-hospital employment in Table 6. For NFP hospitals, which are reimbursed like public hospitals, there remains no effect, as is the case also for FP hospitals. The employment trend for public hospitals is still negative, with no trend for the other hospital types. NFP and FP hospitals are then similar in terms of their employment trends and there being no employment correlation with the local unemployment rate. On the contrary, the reform does seem to have changed the employment behaviour of public hospitals, with a clear fall in employment post-reform. However, we find no evidence that the reform has changed employment behaviour with respect to local unemployment. The answer to the question of whether the reform has managed to break the link between public-hospital employment and local unemployment is then ‘No, but’. The reform does seem to have reduced public-hospital employment, but has not touched its local cyclical nature.
22
Our observed data period here covers the introduction and full roll-out of this pro-competitive reform. The establishment of a new hospital is a long-term process, and we have assumed no changes in the hospital market structure over this period. It can however be argued that the local unemployment results above for public hospitals reflect market structure changing with the pro-competitive reform. We address this issue by explicitly adding a hospital-competition variable to the specification in Table 3: this is the number of local rival hospitals, calculated as the number of other hospitals within a 20 km radius (we have also checked the results for distances of 30 km and 50 km). The results appear in Appendix Table A4. The addition of rival-hospital information leaves our conclusions unchanged. The correlation between public-hospital employment and local unemployment does not reflect changing hospital market structure.
We have here considered hospital location to be exogenous, being based on historical factors and fairly difficult to change subsequently. These historical factors behind hospital location may be argued to include the local labour-market conditions at the time the hospital opened. We here estimate all our equations in panel. As such, the effect of local unemployment is identified by deviations from the mean unemployment level for each hospital. The fixed effect controls for any differences in the initial unemployment levels.
Public hospitals are of two types: Research and Teaching Hospitals and regular public hospitals. Patients with severe conditions are transferred to Research and Teaching Hospitals, whatever the hospital type at the first admission. There is then differential selection of patients into Research and Teaching Hospitals compared to non-teaching hospitals and NFP hospitals. Following a recession or a financial crisis, we may then have an inflow of new patients with more severe health problems to this type of hospital. To see whether this can explain the rise in employment in public hospitals we have re-run all of our analyses excluding the Research and Teaching hospitals: the results are not affected.
23
If the recession produces greater health demand and there is differential selection of patients by hospital type, we may see NFP hospitals serving relatively healthy patients compared to public hospitals (if there is a difference in their motivation to cure patients). We have so far assumed that NFP hospitals do not attempt to seek out the most profitable patients and leave more expensive patients to public hospitals. This assumption is based on i) the obligation of the public-service mission and the associated grant given by the local Regional Health Authority to both public and NFP hospitals, and ii) there being no self-selection of patients in the public sector. The patient is blind to hospital ownership in the public sector: patients do not actually know which kind of public hospital they are in (public non-teaching hospital or NFP hospital). Besides, the Not-for-profit hospitals in the public sector are fairly unique compared to NFP hospitals in other countries. Historically, these were usually linked to religious orders/organisations and were private NFP hospitals. For historical reasons, they are more concentrated in the East of France. During the 1980s-90s, the State put pressure on them to integrate into the public sector: this was an easy way to extend the supply of public-sector healthcare. For the NFP hospitals themselves, this integration was a way of obtaining grants and ensuring a captive volume of demand. Being part of the public sector implies no patient selection and the acceptance of a public-service mission that was already part of their original mission as religious organisations.
However, we cannot totally exclude some phenomenon of selection, which is why we introduced the time-varying hospital variables above. It might be argued that these are only imperfect measures of patient health and hospital activity, even though the cost weight is widely-used as a measure of hospital activity all over the world. Note that for differential selection between SOH and NFP hospitals to be a problem in our fixed-effect analysis, the differential selection would have to change over time, and in a way that is correlated with the local unemployment rate. Overall we do not believe this to be likely.
24
The main difference between SOH and NFP hospitals is then how employment decisions are taken rather than which patients are treated. There is a political role in employment decisions in SOH hospitals that we do not see in NFP hospitals.
6. Conclusions
We have here used five years of panel data on the universe of French hospitals to evaluate the effect of pro-competitive reforms on hospital reimbursement. We first ask whether there exists a within-hospital relationship between employment and local unemployment in public-sector hospitals, and then whether the implementation of a pro-competitive reform changed the nature of this relationship.
Regarding the latter, the DRG-basis payment reform of the French hospital system ‘worked’. The downward post-reform employment trend we find in State-owned hospitals is not observed for other hospital types (NFP hospitals and FP hospitals): different hospital types have converged as far as employment is concerned.
However, if this reform was meant to have blurred, or even removed, the distinction between the health and large local employer roles of public hospitals, then it seems to have failed. The fact that this continuing relationship is only found in higher unemployment areas suggests that in times of labour-market crisis, local politicians are able to continue to exert pressure on the hiring behaviour of public hospitals. In this context, it will be of interest to see whether the HPST reform that started in 2010, which aimed to dilute the power of local politicians in hospital management, will affect the way in which hospitals react to local unemployment.
Our work here has contributed to the debate over public regulation versus open markets in healthcare. There has been a great deal of interest in recent years regarding competition in education, a domain that is similar to health, both theoretically and empirically (Epple et al.,
25
2004, and Hoxby, 2000). The initial findings in this field were in favour of competition in education, although this conclusion has become more mitigated in recent work, depending on the context (Bayer and McMillan, 2005, and Rothstein, 2007).
Much has been made of the comparison of the efficiency of different ownership types, asking whether the private sector is a more efficient provider of some goods and services than the public sector. The first difficulty in making such comparisons is the measurement of output, as State-owned institutions are often present in areas where the measurement of output or value added is not obvious. This is, for example, the case in both education (where it is not a paper certificate or the simple number of years spent in school) and health (which is not only being alive on discharge, but a more general measure of quality of life following treatment).
The second issue is that of standardising the inputs that are used to determine the output. One key question here concerns selection. In the domain we have examined here, it is easy to imagine that some health providers will cherry-pick their patients, leaving those who are deemed to be difficult or expensive to treat to public hospitals. As we noted in the Discussion Section above, differential selection into public and NFP hospitals should not be a major issue in the French data that we have analysed here.
The third point, which is at the heart of what we have discussed here, concerns the perhaps intractable question of what is meant by efficiency in a social-welfare sense. What is it, as a society, we want hospitals to do? From a purely health-provision standpoint, hospitals should be efficient, in the sense of producing the best-quality healthcare for a given set of inputs. However, other prerogatives may come into play. In particular, one of the main inputs that hospitals use is labour, and one community priority may be lower unemployment. A hospital can reduce local unemployment by hiring more staff, producing a positive societal externality.
26
We can have diverse beliefs about whether this hiring difference is valuable. One point of view is that the public sector, by doing so, spends public money to create little in terms of extra output, and crucially little in terms of lower unemployment (as it crowds out the private sector). Towards the other end of the spectrum, we may consider that the negative externalities from unemployment (and therefore the positive externalities from employment) are considerable, and we may also think that extra staff produce noticeably better healthcare (which, as noted above, is notoriously difficult to measure).
We cannot settle this argument here. The private sector may well produce the same output with less employment. But the greater employment in the public sector may also yield positive societal spillovers. Competition here may then run the risk of increasing productive efficiency but reducing social welfare. In the debate on the effect of pro-competitive reform, our results call for caution in comparing hospital performance across different types of ownership.
27 REFERENCES
Alesina, A., Baqir, R. and Easterly, W. (2000). “Redistributive Public Employment”. Journal
of Urban Economics, 48, 219-241.
Bayer, P. and McMillan, R., (2005). “Choice and Competition in Local Education Markets”. NBER Working Paper 11802.
Bloom, N. and J. Van Reenen (2007), “Measuring and Explaining Management practices acrossfirms and nations”, Quarterly Journal of Economics, 122, 1351–1408.
Bloom, N. and J. Van Reenen (2010), “Human resource management and productivity”, in Ashenfelter, O. and D. Card (Editors), Handbook of Labor Economics Volume IV.
Bloom, N., C. Propper, S. Seiler and J. Van Reenen (2015), “The Impact of Competition on Management Quality: Evidence from Public Hospitals”, Review of Economic Studies, 82, 457-489.
Brekke, K., L. Siciliani, and O. Straume (2012), “Quality competition with profit constraints”,
Journal of Economic Behavior and Organization, 84, 642-659
Chalkley, M. and Malcomson, J. (1998). “Contracting for Health Services when Patient Demand Does Not Reflect Quality”, Journal of Health Economics, 17, 1-19.
Choi, S., Holmberg, Löwstedt, J., Brommels, M. (2011), “Executive management in radical Change – the case of the Karolinska University Hospital merger”, Scandinavian Journal
of Management, 27, 11-23.
Clark, A.E., and Milcent, C. (2011). “Public Employment and Political Pressure: The Case of French Hospitals”. Journal of Health Economics, 30, 1103-1112.
Cooper, Z., Gibbons, S., Jones, S. and A. McGuire (2011), “Does hospital competition save lives? Evidence from the English patient choice reforms”, Economic Journal, 121, F228– F260
28
Ellis, R. and McGuire, T. (1986), Provider Behavior under Prospective Reimbursement: Cost Sharing and Supply, Journal of Health Economics, 5, 129-151.
Epple, D., Figlio, D. and Romano, R.E. (2004). “Competition between private and public schools: testing stratification and pricing predictions”. Journal of Public Economics, 88, 1215-1245.
Gaynor, M., Moreno-Serra, R. and C. Propper (2013), “Death by market power: reform, com- petition and patient outcomes in the National Health Service”, American Economic
Journal: Economic Policy, 5(4).
Gowrisankaran, G., and Town, R. (2003). “Competition, Payers and Hospital Quality”,
Health Services Research, 38, 1403–1422.
Hoxby, C.M., (2000). Does competition among public schools benefit students and taxpayers?”, American Economic Review, 90, 1209–1238.
Jacobs, R., S. Martin, M. Goddard, H. Gravelle and P. Smith (2006) “Exploring the determinants of NHS performance ratings: lessons for performance assessment systems”
Journal of Health Services Research and Policy, 7, 211-217.
Kessler, D. and McClellan, M. (2000). “Is Hospital Competition Socially Wasteful?,
Quarterly Journal of Economics, 115, 577-615.
Kolstad, J. (2013). “Information and Quality When Motivation is Intrinsic: Evidence from Surgeon Report Cards”, American Economic Review, 103(7), 2875–2910.
Le Grand, J. and Bartlett, W. (1993) Quasi-markets and Social Policy, Macmillan.
Melly, B. and P. Puhani (2013). “Do Public Ownership and Lack of Competition Matter for Wages and Employment? Evidence from Personnel Records of a Privatized Firm”,
Journal of the European Economic Association, 11, 918-944
Mougeot, M. and Naegelen, F. (2008). “Supply-side risk adjustment and outlier payment policy”, Journal of Health Economics, 27, 1196-1200.
29
Propper, C., S. Burgess and D. Gossage (2008). “Competition and Quality: Evidence from the NHS Internal Market 1991-99”, Economic Journal, 118, 138-170.
Rothstein, J., (2007). “Does competition among public schools benefit students and taxpayers? Comment”. American Economic Review, 97, 2026–2037.
Shen Y. (2003), “The effect of financial pressure on the quality of care in hospitals”, Journal
of Health Economics, 22, 243-269.
Shortell, M. and Hughes, E. (1988). “The Effects of Regulation, Competition, and Ownership on Mortality rates among Hospital Inpatients”, The New England Journal of Medicine,
318, 1100-1107.
Sloan, F. (2000). “Not-for-profit ownership and hospital behavior”, Handbook of Health Economics, Volume 1, Part B, 1141-1174, Edited by A.J. Culyer and J.P Newhouse Volpp, K. and S. Williams, J. Waldfogel, J. Silber, S. Schwartz, and M. Pauly. (2003).
“Market Reform in New Jersey and the Effect on Mortality from Acute Myocardial Infarction”, Health Services Research, 38, 515-533
30
Figure 1. Timeline of Reforms and Data
Notes: In the top panel, the bold figure refers to the percentage of budget reimbursed according to fee per DRG in public and NFP hospitals, and the italic figure to the same percentage in private hospitals. Non-DRG reimbursement in the private sector was via fee-for-service prior to 2005, and in the public sector via a (historically-determined) global budget in public and NFP hospitals, phased out from 2004 to 2008. The red period on the time line corresponds to our data.
31
Figure 2. Number of employees by year and hospital type
Note: Number of employees measured in FTEs.
Table 1. Descriptive statistics
Hospital type
No. of hospitals (mean per year), rounded Std. Dev. No. of employees (mean) Std. Dev. Minimum Maximum Public 886 21.4 754.1 2829.0 16.1 76527.1 NFP 181 3.7 287.0 303.0 8.3 1868.6 Private 628 21.5 161.0 142.6 6.7 1712.5
Note: Data from the DREES (Ministry of Health). 2006-2010 (5 waves)
0 100 200 300 400 500 600 700 800 900 2006 2007 2008 2009 2010
Number of employees per year
32
Table 2. Log employment and local unemployment: Panel results
Public NFP Private Unemployment rate (%) 0.0125*** 0.00475 0.00175 (0.00353) (0.00498) (0.00359) 2007 0.0325*** 0.0257** 0.0152 (0.00847) (0.0126) (0.0106) 2008 0.0254*** 0.0370*** 0.0108 (0.00794) (0.0117) (0.00930) 2009 -0.0533*** 0.0483*** 0.0178* (0.0108) (0.0148) (0.0102) 2010 -0.0642*** 0.0656*** 0.0171 (0.0121) (0.0178) (0.0129) Constant 6.091*** 5.000*** 1.492*** (0.0200) (0.0400) (0.0743) Observations 4,427 906 3,137 Number of hospitals 928 208 716
33
Table 3. Log employment and local unemployment: pre- and post-reform
Public NFP Private Unemployment rate (%) prior to the
reform (2008)
0.00654* 0.00811 -0.000165 (0.00383) (0.00573) (0.00421) Unemployment rate (%) after the
reform (2008) 0.0115*** 0.00588 0.000923 (0.00349) (0.00496) (0.00367) 2007 0.0271*** 0.0287** 0.0132 (0.00837) (0.0134) (0.0105) 2008 -0.0218 0.0584** -0.000473 (0.0161) (0.0275) (0.0157) 2009 -0.0991*** 0.0677** 0.00787 (0.0178) (0.0271) (0.0150) 2010 -0.110*** 0.0846*** 0.00749 (0.0188) (0.0292) (0.0165) Constant 6.132*** 4.973*** 1.503*** (0.0249) (0.0477) (0.0777) Observations 4,420 905 3,136 Number of hospitals 928 208 716
34
Table 4. Log employment and local unemployment: above- and below-median
unemployment municipalities
Local unemployment: Below median Local unemployment: Above median Public NFP Private Public NFP Private Unemployment rate (%)
prior to the reform (2008)
0.00625 0.0127 0.00389 0.0127** 0.00587 0.00105 (0.00417) (0.0155) (0.00734) (0.00602) (0.00895) (0.00630)
Unemployment rate (%) after the reform (2008)
0.000282 0.0150 -0.00202 0.0169*** -0.00418 0.00273 (0.00814) (0.0138) (0.00753) (0.00528) (0.00769) (0.00533) 2007 0.0188 0.0353 0.0180 0.0280** 0.0239 0.0201 (0.0114) (0.0223) (0.0123) (0.0141) (0.0170) (0.0200) 2008 -0.0222 0.0170 0.0489 -0.0190 0.162*** -0.00755 (0.0403) (0.0517) (0.0315) (0.0357) (0.0567) (0.0385) 2009 -0.107** 0.0382 0.0528 -0.0823** 0.177*** 0.00592 (0.0440) (0.0500) (0.0339) (0.0364) (0.0579) (0.0368) 2010 -0.127*** 0.0280 0.0688** -0.0923** 0.213*** -0.00394 (0.0452) (0.0518) (0.0344) (0.0368) (0.0595) (0.0397) Constant 6.194*** 4.937*** 1.475*** 6.015*** 5.961*** 5.459*** (0.0450) (0.118) (0.0817) (0.0769) (0.0957) (0.0687) Observations 2,346 444 1,440 2,074 461 1,696 Notes: Standard errors in parentheses. *** p<0.01, ** p<0.05, * p<0.1. The regressions include hospital fixed-effects. The median unemployment rate across municipalities is 9.73%.
35
Table 5. Log employment and local unemployment: level of employee qualification
Very low-qualified Low-qualified
Public NFP Private Public NFP Private Unemployment rate (%)
prior to the reform (2008)
0.114*** 0.0313* -0.00613 0.0961*** 0.00769 0.00390 (0.0114) (0.0165) (0.00693) (0.00813) (0.0147) (0.00679) Unemployment rate (%)
after the reform (2008)
0.119*** 0.0123 -0.00121 0.0973*** -0.00981 0.00573 (0.00777) (0.0118) (0.00520) (0.00583) (0.00999) (0.00536) 2007 (0.0766) 0.152** (0.138) 0.0794 (0.0550) 0.0427 (0.0580) 0.0957* (0.115) 0.0359 (0.0558) 0.0323 2008 (0.146) 0.0832 (0.251) 0.253 (0.105) 0.0243 (0.107) 0.0347 (0.211) 0.221 0.0164 (0.108) 2009 -0.0930 (0.152) (0.262) 0.267 (0.111) 0.0624 (0.113) -0.140 (0.218) 0.250 0.0206 (0.114) 2010 (0.154) -0.103 (0.262) 0.340 (0.113) 0.0799 -0.0390** (0.0176) (0.219) 0.310 0.00931 (0.118) Medium-qualified High-qualified
Public NFP Private Public NFP Private Unemployment rate (%)
prior to the reform (2008)
0.0788*** 0.0252 0.00755 0.000368 0.0269*** 0.00791** (0.00912) (0.0166) (0.00609) (0.00283) (0.00896) (0.00309) Unemployment rate (%)
after the reform (2008)
0.0772*** 0.00970 0.00548 0.00139 0.0214*** 0.0110*** (0.00642) (0.0117) (0.00415) (0.00189) (0.00632) (0.00200) 2007 (0.0652) 0.120* (0.147) 0.0408 (0.0425) 0.0432 (0.0182) -0.0109 (0.0648) -0.0373 (0.114) -0.161 2008 (0.120) 0.0867 (0.255) 0.194 (0.0840) 0.0399 5.34e-05 (0.0388) -0.0754 (0.127) -0.00693 (0.0397) 2009 (0.0589) -0.106* (0.264) 0.205 (0.0870) 0.0897 (0.262) 0.250 -0.0268 (0.127) (0.0418) -0.0259 2010 -0.143*** (0.041) 0.137*** (0.0400) (0.0890) 0.0722 (0.127) 0.0698 -0.00412 (0.128) (0.0466) -0.0479 Notes: Standard errors in parentheses. *** p<0.01, ** p<0.05, * p<0.1. The regressions include hospital fixed-effects. The very low qualified are low-skilled manual workers; low-qualified includes some administrative and medical support staff; medium qualified includes Nurses and higher-level administrative staff; and high-qualified covers Doctors and midwives. Self-employed Doctors are assumed to count for 50% of a full-time equivalent. Appendix B contains more details on these four qualification groups.
36
Table 6. Log employment and local unemployment: adding control variables
VARIABLES Public NFP Private Unemployment rate (%) prior to the
reform (2008)
0.0120*** 0.0024 0.000669 (0.00350) (0.00955) (0.00482) Unemployment rate (%) after the reform
(2008) 0.0138*** 0.00202 0.00240 (0.00315) (0.00638) (0.00423) 2007 0.0265*** (0.00834) (0.0134) 0.0248* (0.00957) 0.0203** 2008 0.000103 (0.0149) (0.0264) 0.0389 (0.0176) 0.00461 2009 -0.0660*** (0.0158) (0.0272) 0.0250 (0.0173) 0.00796 2010 -0.0707*** (0.0166) (0.0286) 0.0276 (0.0180) 0.00421 Log Number of Beds 0.0570*** (0.0189) 0.155*** (0.0333) 0.113*** (0.0141) Log Admissions 0.0518*** (0.0191) 0.0380*** (0.0114) 0.0144*** (0.00517) % Low severity REF REF REF % Moderate severity (0.103) 0.0676 (0.210) -0.231 (0.213) -0.183 % Severe severity (0.119) 0.195 (0.219) 0.369* 0.783** (0.375) % Acute severity 0.772*** (0.295) (0.657) -1.003 (1.270) -0.257 Emergency Unit (0.0444) -0.0712 (0.0608) 0.0311 -0.00851 (0.0367) % Day-surgery 0.1065*** (0.0291) -0.00123 (0.254) -0.305*** (0.111) % of Sessions (0.118) 0.162 0.0244 (0.127) 0.00376 (0.124) Cost Weight 2.47e-09*** (8.06e-10) 1.12e-08*** (3.87e-09) 7.31e-09*** (2.76e-09) Constant 5.842*** (0.192) 4.046*** (0.228) 1.652*** (0.205)
Observations 3,238 619 2,882 Number of hospitals 714 147 643
37
Appendix Table A1
No. of observations Mean Std. Dev. No. Employees 8470 484.5 2069.03 No. Nurses 8470 261.4 1120.84 No. Support staff 8470 105.5 384.89 No. Administrative staff 8470 75.1 326.16 No. Paramedical staff 8470 42.5 244.67 No. of Beds 8470 131.9 390.72
8470 (median: 62)
No. of Admissions 8470 7275.5 18967.77 % Illness: low Severity 8470 69.9% 0.11 % Illness: moderate Severity 8470 19.1% 0.10 % Illness: high Severity 8470 9.0% 0.09 % Illness: very high Severity 8470 2.1% 0.02
Emergency 8470 27.3% 0.45
Cost Weight 6780 1.56E+07 4.21E+07 Local Unemployment Rate (/100) 8461 10.3 4.26 Median Municipality Income 8470 14268.0 3176.86 Municipality Death Rate (/100) 8470 1.1% 0.01 Local % Foreign-Born (/100) 8470 6.4% 0.04 Local % Aged 60-74 (/100) 8470 14.1% 0.03 Local % Aged 75+ (/100) 8470 9.5% 0.04
Note: The last six lines in this table refer to the unweighted average figures across municipalities in which there is a hospital.
Appendix Table A2. Hospital numbers by year and hospital type
Hospitals 2006 2007 2008 2009 2010 Total
Public 909 906 889 871 852 4427
NFP 187 182 182 179 176 906
For-Profit 663 638 623 607 606 3137 Total 1,759 1,726 1,694 1,657 1,634 8,470
38
Appendix Table A3. Employment staff and hospital type (2006-2010 average)
Public NFP Private < 5000 Admissions 131.2 135.2 85.5 N=557 N=113 N=377 5000-10 000 Admissions 501.4 383.4 211.5 N=90.6 N=41 N=165 10 000-16 000 Admissions 790.1 693.0 371.3 N=74 N=21 N=65 > 16 000 Admissions 2984.3 1030.1 472.8 N=165 N=6 N=21
39
Appendix Table A4. Log employment and local unemployment: pre- and post-reform,
including information on the number of rival hospitals
Public NFP Private Unemployment rate (%) prior to the
reform (2008)
0.00868** 0.00447 -0.00221 (0.00440) (0.00508) (0.00369) Unemployment rate (%) after the
reform (2008) 0.0113*** 0.00569 0.00368 (0.00346) (0.00580) (0.00427) 2007 0.0282*** 0.0227* 0.00551 (0.0109) (0.0132) (0.0103) 2008 -0.0146 0.0451 -0.00943 (0.0203) (0.0174) (0.0159) 2009 -0.108*** 0.0611** -0.000556 (0.0226) (0.0293) (0.0154) 2010 -0.127*** 0.0715** -0.000621 (0.0237) (0.0329) (0.0172) No. of rivals 0.00003 0.00000 0.00002 (0.0007) (0.00000) (0.00010) No. of NFP-rivals 0.00000 -0.00000 -0.00000 (0.00002) (0.00003) (0.00010) No. of FP-rivals 0.00000 -0.00001 -0.00001 (0.00005) (0.00004) (0.00003) Constant 6.148*** 4.994*** 1.524*** (0.0323) (0.0463) (0.0813) Observations 4,420 905 3,136 Number of hospitals 928 208 716
• No. of rivals: The number of rival hospitals in a fixed 20-km radius from the hospital. Considering the number of rival hospitals by ownership type, we have:
• No. of SOH-rivals: The number of rival SOH hospitals (the reference category) • No. of NFP-rivals: The number of rival NFP hospitals
40
Appendix B: Details regarding the four qualification groups of medical staff
High-qualified: These are medical specialists (whatever the unit, from cardiology to geriatric, including gynaecology as well as podiatry), midwives and psychologists.
Medium-qualified: This group includes Nurses. The term ‘nurse’ in the hospital implies that the employee has obtained a nursing qualification. We also include higher-level administrative staff such as the Directors of the hospital departments. Last, the medium-qualified include paramedical staff, such as physical therapists and dieticians.
Low-qualified: This group refers to less-qualified administrative staff and the administrative and medical support staff who provide social assistance to patients. It also includes paramedical staff (for example, physical therapists and dieticians) and nursing auxiliary staff who do not have professional qualifications (namely the ASH: ‘agent de service hospitalier’) and who are thus less-qualified than the medium-qualified.
Very Low-qualified: This group mainly covers the support staff in low-skilled manual jobs, including those working on buildings and grounds.
As a robustness check, we have switched some staff categories from one level of qualification to another. For instance, we defined the high-qualified group both with and without psychologists. In the latter case, psychologists were included in the medium-qualified group. This did not change our results