HAL Id: halshs-00908932
https://halshs.archives-ouvertes.fr/halshs-00908932
Preprint submitted on 25 Nov 2013HAL is a multi-disciplinary open access
archive for the deposit and dissemination of sci-entific research documents, whether they are pub-lished or not. The documents may come from teaching and research institutions in France or abroad, or from public or private research centers.
L’archive ouverte pluridisciplinaire HAL, est destinée au dépôt et à la diffusion de documents scientifiques de niveau recherche, publiés ou non, émanant des établissements d’enseignement et de recherche français ou étrangers, des laboratoires publics ou privés.
Child health and use of health care services in France:
Evidence on the role of family income
Bénédicte H. Apouey, Pierre-Yves Geoffard
To cite this version:
Bénédicte H. Apouey, Pierre-Yves Geoffard. Child health and use of health care services in France: Evidence on the role of family income. 2013. �halshs-00908932�
WORKING PAPER N° 2013 – 38
Child health and use of health care services in France: Evidence on
the role of family income
Bénédicte H. Apouey
Pierre-Yves Geoffard
JEL Codes: I12, I14
Keywords: Socioeconomic factors, Child, Anthropometry, Healthcare
disparities
P
ARIS-
JOURDANS
CIENCESE
CONOMIQUES48, BD JOURDAN – E.N.S. – 75014 PARIS TÉL. : 33(0) 1 43 13 63 00 – FAX : 33 (0) 1 43 13 63 10
Child health and use of health care services in France: Evidence on the role of family income
Santé et accès aux soins des enfants français: Le rôle du revenu familial
Bénédicte H. Apouey Pierre-Yves Geoffard
Paris School of Economics – CNRS
November 2013
Corresponding author: Bénédicte Apouey
Address: Paris School of Economics – CNRS, 48 Boulevard Jourdan, Bâtiment A, 75014 Paris, France
Phone: +33-1-43-13-63-07 Fax: +33-1-43-13-63-55
Abstract
Background. Our paper investigates the relationship between family income and child health in France. We first examine whether there is a significant correlation between family income and child general health, and the evolution of this relationship across childhood years. We then study the role of specific health problems, the use of health care services, and supplemental health insurance coverage, in the income gradient in general health. We also quantify the role of income in child anthropometric measurements. Whenever possible, we compare our results for France with those obtained for other developed countries.
Methods. Using data on up to approximately 24,000 French children from the Health, Health Care and Insurance Surveys, we apply econometric techniques to quantify the correlation between household income, child general health, specific health problems, anthropometric characteristics, use of health care services, and supplemental insurance coverage.
Results. There is a positive and significant correlation between family income and child general health in France. The income gradient in child general health is possibly smaller in France than in other developed countries. The gradient in general health is explained by the greater prevalence of specific health problems for low-income children. In addition, income is strongly correlated with anthropometric characteristics. The use of health care services and supplemental health insurance coverage are probably not major determinants of the gradient in general health.
Conclusion. The relationship between income and health in adulthood has antecedents in
childhood. Improving access to health care services for children from low-income families may not be enough to decrease social health inequalities in childhood.
Résumé.
Position du problème. Cette étude porte sur la relation entre le revenu du ménage et la santé des enfants en France. Nous nous intéressons d’abord à l’existence d’un gradient revenu / santé générale et à son évolution au cours de l’enfance. Nous nous interrogeons ensuite sur le rôle des problèmes spécifiques de santé dans le gradient de santé générale. Nous quantifions également l’effet du revenu sur les caractéristiques anthropométriques. Finalement, nous examinons si l’accès aux soins et la couverture santé complémentaire sont des mécanismes susceptibles d’expliquer le gradient de santé générale. Lorsque cela est possible, nous comparons nos résultats avec ceux obtenus pour d’autres pays développés.
Méthodes. Nous exploitons les données de l’Enquête sur la Santé et la Protection Sociale, entre 1996 et 2010. Elles contiennent au maximum 24 000 observations environ. A l’aide d’outils économétriques, nous quantifions la corrélation entre le revenu du ménage, la santé générale de l’enfant, ses problèmes spécifiques de santé, ses caractéristiques anthropométriques, son accès aux services de soins, et sa couverture complémentaire.
Résultats. Le revenu du ménage est significativement corrélé à la santé générale des enfants en France. Cet effet semble plus faible en France que dans les autres pays développés. Ce gradient revenu / santé générale s’explique par la plus forte prévalence de problèmes spécifiques de santé chez les enfants de familles démunies. Nous montrons aussi que le revenu a un effet sur les
caractéristiques anthropométriques. L’accès aux soins et la couverture complémentaire ne semblent pas être des mécanismes importants qui expliqueraient la corrélation entre le revenu et la santé générale.
Conclusion. Le gradient revenu / santé observé à l’âge adulte possède des racines dans l’enfance, en France. Améliorer l’accès au système de soins pour les enfants de milieux défavorisés ne semble pas suffisant pour réduire les inégalités sociales de santé entre enfants.
Keywords. Socioeconomic factors. Child. Anthropometry. Healthcare disparities.
Mots clés. Facteurs socioéconomiques. Enfant. Anthropométrie. Disparités d’accès aux soins.
1. Introduction
The relationship between income and health in adulthood has generated a very substantial literature in social sciences, with the broad finding that wealthier adults are in better health [1,2]. However, untangling the causes of the relationship between income and health for adults is challenging, since the correlation may be due to three different mechanisms: (1) income could have an impact on health, (2) health may have an effect on income, and (3) common hidden factors may create a spurious correlation between income and health.
A recent literature focuses on children and explores the relationship between household income and child health in some developed countries. By concentrating on children, this literature reduces the channel that runs from health to household income, because children do not work in developed countries and so their health does not have a great influence on household income, on average [3]. In addition, looking at children provides some clues regarding the origins of social inequalities observed in adulthood.
In an influential contribution, Case et al. (2002) establish that family income is strongly associated with child general health in the United States and that this relationship strengthens with child age, which means that health disadvantages accumulate over time for children from low-income families [3]. There is also a positive association between family income and child general health in
Australia, Germany, and Canada [4–6]. Results for the UK are somewhat contradictory [7–9]. The aim of our paper is to add to this emerging literature on the income / health gradient in childhood, by providing evidence from France. Looking at the gradient in childhood for France is all the more relevant as health inequalities in adulthood are average or large in France, but not small, compared to other developed countries. Indeed, using data on 22 European countries in the 1990s and early 2000s, Mackenbach et al. (2008) demonstrate that education-related inequalities in the rate of death are average in France compared to other European countries [10]. Moreover, using the 1996 wave of the European Community Household Panel, Van Doorslaer and Koolman show that France ranks 8 out of 13 in terms of income-related health inequalities [11]. In addition,
Hernandez-Quevedo et al. (2008) use the European Community Household Panel Users’ Database from 1994 to 2001 to highlight that France and Portugal perform worst in the ranking of social inequalities in health limitations, among 14 European countries [12]. Using data on adults over 50 from 12 developed countries, Jürges (2007) shows that France ranks 11 out of 12 for income-related health inequalities [5].1 Finally, using the waves 2005 to 2007 of the EU Statistics on Income and Living Conditions data, a recent study shows that social inequalities in France are average, compared to 19 other European countries [13]. As a consequence, it seems relevant to investigate whether social health inequalities in adulthood have antecedents in childhood in France and how social inequalities in childhood in France compare to other developed countries.
However, the literature on the gradient in childhood for France is scarce. In 2000, Anne Tursz lamented that knowledge on the relationship between social environment and child health in France was limited and we are under the impression that only little progress has been made since then [14]. Some interesting results are worth noticing though: infant mortality, prematurity, and hypotrophy at birth are inversely related to the family socioeconomic status [15]; children ages 5-6 living in poorer areas2 were more likely to have weight, dental, and speech and language problems, in 2000-2001 [16]; the family income tax level and the father’s educational level were negatively correlated with the probability of overweight for adolescents ages 12, in the Department of the Bas-Rhin in 2001 [17]; adolescents ages 11 to 15 living in less affluent families are more likely to be in poor general health, to have a health problem, to have been injured, and to be overweight [18]. Because the data used in these studies only contain children from specific age groups or specific regions, it is an open question whether the results can be generalized to all French children. In addition, these articles for France focus on specific health variables and it would be interesting to have a more general description of health inequalities in childhood, using a larger number of health variables.
1 See Table 2 in [5].
Moreover, to our knowledge, the existing literature for France does not study the emergence and the evolution of the gradient over childhood years. Finally, the literature on France does not look at the role of unmet needs for care in the income gradient in health in childhood, although some articles focus on this role to explain the gradient in adulthood [19]. In our paper, we try to address these limitations.
We provide the first econometric study on the income gradient in child health for France. We use a nationally representative survey for France, the Health, Health Care and Insurance Surveys. This dataset contains children of all ages from birth to age 17, from all French regions, which enables us to get representative results. In addition, the data contain rich information on several dimensions of child health, on the use of health care services, and on supplemental insurance coverage. We begin by investigating whether there is an association between family income and child general health and whether this correlation increases with age. We then examine the role of specific health problems in the income gradient in general health. We also examine whether there is an income gradient in anthropometric measurements. Finally, we investigate the role of the use of health care services and the type of supplemental health insurance coverage in the income gradient in general health. The intuition is that the correlation between income and general health could be due to the fact that children from low socioeconomic groups are disproportionately affected by financial and geographical barriers to access to health care [20]. Specifically, we test whether unmet needs for care and the type of supplemental health insurance coverage are mechanisms through which income has an impact on general health. As far as we are aware, we are the first to explore these
mechanisms for French children. Whenever possible, we compare our results for France with those obtained for other developed countries.
Our results indicate that there is a significant association between family income and child general health in France and that this association increases with age. Turning to specific health problems, we find that some specific health problems are more prevalent among children from low-income families. We also show that children from low-income families are more likely to be shorter
(conditional on their age) and to be overweight. Finally, we find that differences in unmet needs for care and supplemental health insurance coverage between children from low- and high-income families may not be important mechanisms underlying the gradient in general health in France. The paper is organized as follows. Section 2 contains the description of the data and the methods. Section 3 presents our results. Section 4 discusses our findings. Section 5 offers some concluding remarks.
2. Material and methods 2.1. Data
Data come from the French Health, Health Care and Insurance Survey (ESPS). The exact survey years we use are 1996, 1997, 1998, 2000, 2002, 2004, 2006, 2008, and 2010. The survey is carried out by the Institute for Research and Information in Health Economics (IRDES) and the “Caisse Nationale de l’Assurance Maladie des Travailleurs Salariés.” It is a general population survey of French households, except those living in overseas territories or in collective housing such as long-term care hospitals, religious communities, and elderly people's homes. The data are collected by a combination of phone interviews, face-to-face interviews, and self-completion questionnaires. The data contain very rich information on individuals’ background and health, and they have been used to study the determinants of health in adulthood, but not in childhood [21,22].
Our definition of child refers to an individual aged 0-17, who is either at school or who is too young to be at school. Note that this definition implies that minors who are in the labor force are excluded from our sample. This restrictive definition is to avoid that minor individuals in our sample
contribute to the household income and thus that their health has an impact on household income (reverse causation).
We are able to merge children with their households’ and parents’ characteristics. A small share of children / households is re-interviewed in subsequent years, most often four years after the first
interview. The data would thus enable us to estimate longitudinal models that would include child fixed effects. However, these longitudinal models imply an important decrease in the sample size, and they increase measurement error, as discussed in the previous literature [8]. For these reasons, we use pooled (i.e. repeated cross-sectional) data.
Child health
We use information on the child general health, specific health problems, and anthropometric characteristics.
Child general health. We first use a child general health measure that comes from the subjective
health question: “How is the child / your health in general? 1: very good, 2: good, 3: fair; 4: bad, 5: very bad.”
This subjective measure offers two advantages. First, it provides a summary of the child general state of health. Second, this variable has been used in the previous literature on the gradient in childhood, in Canada, Germany, and the US, which enables us to draw international comparisons [3–5]. Less than 4% of children are in bad or very bad health, which leads us to collapse the “fair,” “bad,” and “very bad” categories into one category. Consequently, our child general health measure has three categories: 1=Fair / bad / very bad; 2=Good; 3=Very good. This variable is only present in the 2004 to 2010 waves of the data.
Child specific health problems. To complement general health measures, we use information on 12
specific health problems. The questions on health problems slightly vary between survey years. For example, in the 2010 survey, the question is: “Which disease or health problem do you / does the child have?” The following broad categories of diseases and health problems are listed in the questionnaire: Heart, blood circulation problems; Cancer; Leukaemia; Chest diseases, bronchitis;
Problems with nose, throat, ears; Problems with eyes; Mouth and teeth; Digestive problems; Liver problems; Problems with bones and joints; Genitourinary problems; Endocrinal diseases; Psychic problems; Neurological problems; Skin problems; Learning difficulties; and Other diseases.” In the 2010 questionnaire, some of these broad health categories are divided into even more precise diseases.
The child health problems were then recoded by IRDES to match the International Classification of Diseases 10th revision (ICD-10). Using this recoding, we create a series of 12 dummy variables, that indicates whether the child suffers from each of the following specific health problems (i.e.
chapters) from the ICD-10 list: (1) certain infectious and parasitic diseases; (2) endocrine,
nutritional and metabolic diseases; (3) mental and behavioral disorders; (4) diseases of the nervous system; (5) diseases of the eye and adnexa; (6) diseases of the ear and mastoid process; (7) diseases of the respiratory system; (8) diseases of the digestive system; (9) diseases of the skin and
subcutaneous tissue; (10) diseases of the musculoskeletal system and connective tissue; (11) diseases of the genitourinary system; and (12) injury, poisoning and certain other consequences of external causes.
Note that we only use 12 specific health problems, although the ICD-10 classification contains more than 12 chapters, because we leave aside health problems which are too rare in our sample of children (and represent less than 1% observations). The study of rare specific problems would require a larger sample size. We also leave aside ICD-10 chapters which do not capture precise health problems, as well as congenital malformations, deformations and chromosomal
abnormalities, since there is no reason to believe that current household income could have any impact on these health problems.
Child anthropometric measurements. We also use children’s anthropometric data. Using the
and BMI-for-age z-scores, and a dummy for whether the child is overweight or obese. The function uses the reference data available from the 1990 British Growth Reference. Note that the z-scores are quantified for children of all ages, but the overweight / obesity status is only defined and quantified for children above 2.
The questions on the child general health, specific health problems, and height and weight are part of a “health questionnaire” that is handed to household members. Instructions on who should fill the health questionnaires for children are not precise. Data analysis shows that these child health questionnaires are either filled by the child parents, by the child himself, or by an unknown household member (missing values). In the included samples we use, child health questions are more frequently reported by the child parents than by the child himself. For instance, in the (included) sample we use to analyze general health, child self-reporting of health is very low and represents less than 6% of observations for children less than 10 years of age. We are under the impression that these cases could be due to miscoding of the data. For children between 10 and 16, although child general health is still more frequently reported by the parents than by the child himself, a non-negligible share of children report their health status themselves. This share
increases with age: 6.56% of children report their own health status at age 10, versus 17.37% at age 12, 25.76% at age 14, and 40.76% at age 16. At age 17, self-reporting reaches 56.22% and is more frequent than parents’ reporting. We observe the same pattern of an increase in child self-reporting for the samples we use to study specific health problems and anthropometric measures.
Child unmet needs for care
Our unmet needs for care variable comes from the following question: “Over the last 12 months, did you / the child not visit a doctor or not receive health care, although you / the child needed care
(dentist, glasses, …)?3” We create a dummy for whether the question is answered in the positive.
This question is in the health questionnaires in the 2006, 2008, and 2010 surveys only. This variable has already been used in studies on French adults, but not on French children [19,23].
Child supplemental health insurance coverage
The data contains information on the child supplemental health insurance coverage. First, we use a dummy for whether the child is covered by any supplemental health insurance. In addition, for children who are covered by a supplemental health insurance, we use information on the type of supplemental coverage. Specifically, we create a dummy for whether the child is covered by the supplemental universal health insurance (“CMU-C”), or by a supplemental private health insurance (“Private”).
Income
The income measure is current annual pre-tax family income. In 1998, 2004, 2006, 2008, and 2010, the data contain either the exact amount of household income, for households who agree to
precisely indicate their income level, or income in brackets, for households who do not want to report their exact income level. We first convert the exact amounts into 2011 euros, using the French National Consumer Price Index. We then use the exact income amount whenever possible and the empirical within-interval averages otherwise.
In 1996, 1997, 2000, and 2002, the data only contains income in brackets. After converting the brackets into 2011 euros, we use the distribution of the exact income levels in 1998 (respectively 2004) to find the within-interval average in 1996, 1997, and 2000 (respectively 2002).
Following the previous literature, we use the logarithm of income to account for the non-linearity in the relationship between income and child health.
3
In French, the question is the following: “Au cours des 12 derniers mois, avez-vous renoncé [pour cet
Note that we do not use equivalent income but income as our main explanatory variable, to match the models used in the previous literature on child health (Case et al., 2002). However, both previous research and our paper do control for the family structure, by including the logarithm of the family size, a dummy for the presence of the mother in the household, and a dummy for the presence of the father in the household, as explanatory variables (see the list of controls below).
Control variables
The econometric models we estimate include two sets of controls (“controls 1” and “2”) which are very similar to the ones used in the previous literature, to enable us to compare the gradient between countries (Case et al., 2002, for the US [3]; Currie and Stabile, 2003, for Canada [4]; Khanam et al., 2009, for Australia [6]; Reinhold and Jürgen, 2012, for Germany [24]). The controls used in these published articles are not exactly similar, but the differences between them are minimal. The first set of controls (“controls 1”) generally contains child age dummies, child gender, the logarithm of household size, dummies for the presence of the mother and father in the household, the age of the mother and the father interacted with their presence, and time dummies, whereas the second set of controls (“controls 2”) includes the first set plus the mother and the father educational level and employment status, interacted with their presence in the household.
We also use these two sets of controls, but we also include a control for the identity of the
respondent to the child health questionnaire, to account for potential differences in reporting styles between parents and children. Specifically, the child health questionnaire can be filled by the parents, the child, or by an unknown household member. In our econometrics models, we thus include a dummy for whether the child answered the child health questionnaire himself and a dummy for whether the identity of the respondent to the child health questionnaire is unknown / missing. The reference is the dummy indicating that the parents answered the child health questionnaire.
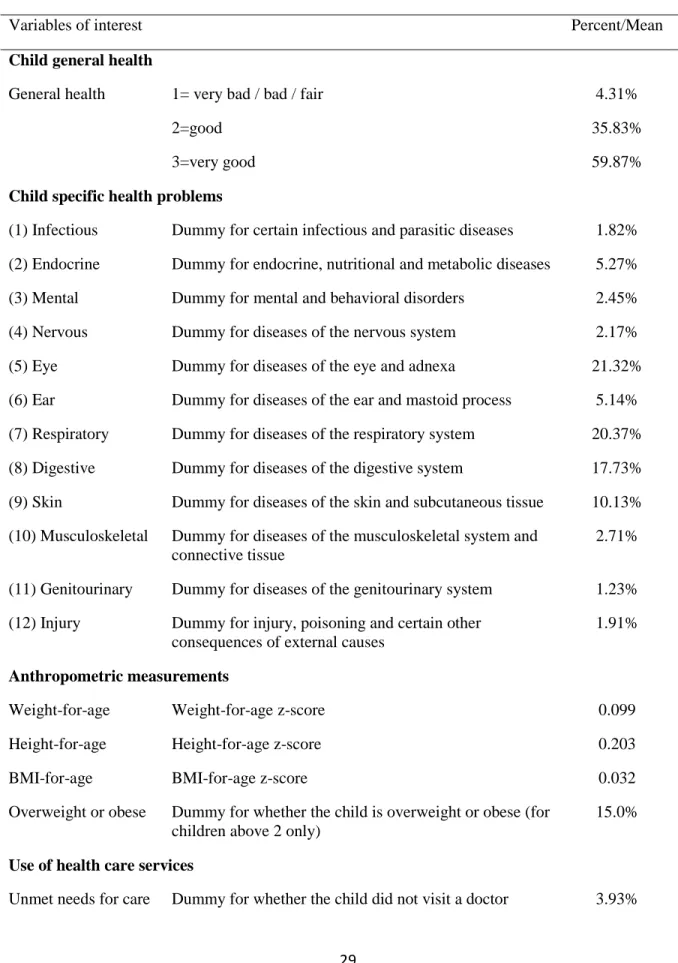
The definitions and summary statistics of the variables of interest are given in Table 1. [Insert Table 1 here]
Missing values
Observations with missing values on explained health variables and on income are dropped from our sample, because we cannot / do not want to make any imputation on these variables of interest. In addition, observations with missing values on control variables are generally dropped from our sample, since they represent very few observations. However, the control variable that contains the identity of the household member who answered the child health questionnaire has a large number of missing values. We do not want to drop these observations with missing values, since this would greatly reduce our sample size. We thus create a dummy indicating that the identity of the
respondent to the child health questionnaire is missing / unknown.
We are left with a sample of 12,732 observations for the analysis of general health, 23,862 for specific health problems, 21,425 for anthropometric measures, 9,098 for unmet needs for care, and 12,696 for supplemental health insurance.
2.2. Methods
We use econometric techniques to explore the gradient in childhood. First, we examine the relationship between the logarithm of family income and child general health. We follow the econometric strategy used in the earlier literature, to be able to compare our results with those for other countries. Specifically, we regress child general health on the logarithm of income, controlling either for “controls 1” or “controls 2,” using ordered probit models. We estimate the models for the whole sample of children ages 0-17, but also separately for children of different age group (0-3, 4-8, 9-12, 13-17), to assess the evolution of the gradient with age.
Second, we focus on the role of specific health problems in the gradient in general health. According to Case et al. (2002), the income gradient in general health may reflect the greater prevalence of specific health problems among children from low-income families. We examine whether the prevalence of specific health problems is greater among low-income children, by regressing the dummies for specific health problems on the logarithm of income and controls. These models are estimated using OLS (linear probability models) and including “controls 2.”
Third, to estimate the correlation between family income and anthropometric measures, we regress the child weight-for-age, height-for-age, and BMI-for-age z-scores, and overweight status on the logarithm of income and controls. These models are estimated using OLS and including “controls 2.”
Finally, we investigate the roles of unmet needs for care and of supplemental health insurance coverage in the income gradient in general health. We proceed in two steps. First, we check whether income is correlated with unmet needs for care and supplemental coverage, using OLS. Second, we test whether the use of unmet needs (respectively supplemental coverage) is a mechanism
underlying the income gradient in general health, by comparing the correlation between income and general health, in the absence of any control for unmet needs (respectively supplemental coverage), with the correlation between income and general health, when the control for unmet needs
(respectively supplemental coverage) is included.4 These models are estimated using ordered probit and including “controls 2.”
4
We estimate a static model in which general health at date t is regressed on income at t and unmet needs for care at t. A dynamic model that would regress general health at date t on income at t and unmet needs for care at t-4 would be better, but our data does not allow to get reliable estimates for this dynamic model. Indeed, the number of children with unmet needs for care is small in cross sections, and it would be even smaller in the longitudinal sample used for the dynamic models (sample of children who are followed over time). This would lead to unreliable estimates in the dynamic model.
3. Results
3.1. First description of the income gradient in general health
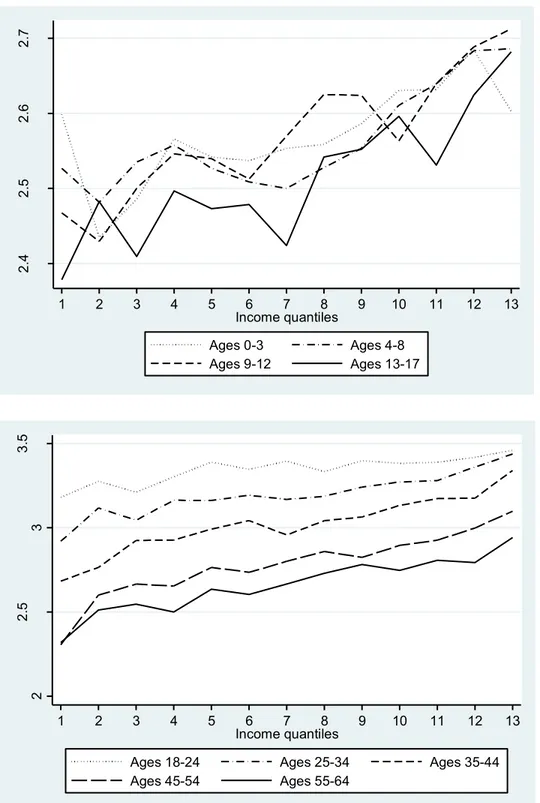
We first present descriptive evidence on the relationship between family income and child general health, in the absence of any control. We use four child age groups, like the previous literature (children ages 0-3, 4-8, 9-12, and 13-17) to examine the evolution of the income gradient between age groups. The top subfigure in Figure 1 shows the child average general health as a function of income quantiles, for each age group. We use 13 income quantiles because there are 13 income brackets. The subfigure highlights that the health of older children is poorer than that of younger children. Statistical tests (which are not reported) show that the general health of children ages 13-17 is significantly worse than that of children ages 0-3, 4-8, and 9-12. The subfigure also shows that as income increases, general health improves. Finally, the subfigure provides some evidence that the curves become steeper with child age. This strengthening of the income gradient between age groups is supported by statistical tests (not reported), which highlight that the correlation between income quantiles and general health for children ages 9-12 and 13-17 is significantly larger than for children ages 0-3, when no control is included.
To explore whether this widening of the gradient between age groups continues in adulthood, we graph the correlation between household income and general health, for adults, in the bottom subfigure of Figure 1. Our graph suggests that the health of older individuals is poorer than that of younger ones.5 The subfigure also shows large social inequalities, since young adults ages 25-34 from the lowest income category (first quantile) report the same level of subjective health as old adults ages 55-64 from the higher income category (13th quantile). Statistical tests (not reported) show that the slopes of the curves for individuals ages 18-24 and 25-34 are significantly smaller than that for individuals ages 35-44. Afterwards, the slopes of the gradients remain constant, for individuals ages 35-44, 45-49, 50-54, and 55-65.
5 This finding supports previous results by Van Kippersluis et al. (2009) for French males and females ages 20
[Insert Figure 1 here]
3.2. The income gradient in child general health
The estimates of the ordered probit models for child general health are presented in Table 2. We first focus on the whole sample of children ages 0-17. When “controls 1” are included, we find a positive and significant association between income and child general health. The 0.182 coefficient on income implies that an increase in income from the 25th percentile to the 75th percentile is associated with a 4 percentage point increase in the probability that the child is in very good general health, from a probability of 0.580 to a probability of 0.621. When “controls 2” are included, the coefficient on income decreases to 0.123 but remains significant. This coefficient implies that an increase in income from the 25th percentile to the 75th percentile is associated with a 3.5
percentage point increase in the probability that the child is in very good general health, from a probability of 0.586 to a probability of 0.615.
We now turn to the evolution of the gradient between age groups. Table 2 provides evidence that the gradient for children ages 0-3 is similar to the gradient for children ages 4-8, but that the gradient is larger for children ages 9-12 and 13-17 than for children ages 0-8, for both sets of controls.
[Insert Table 2 here]
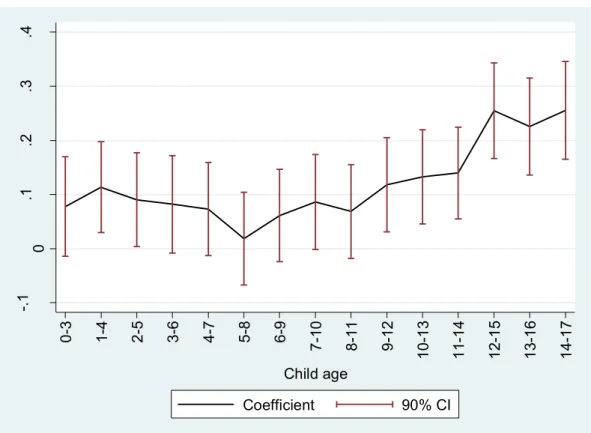
We can identify the age group for which the gradient starts strengthening, using more precise age groups [9]. We first create a number of child age groups: children ages 0-3, 1-4, 2-5…. and 14-17. These age groups overlap, to smooth our estimates. We then estimate a series of ordered probit models for child health as a function of the logarithm of income, including “controls 2,” for each of these age groups separately. Figure 2 graphs the coefficients on the logarithm of income as a function of age groups. The figure suggests that the income gradient in general health may be larger for children above 12 years of age.
[Insert Figure 2 here]
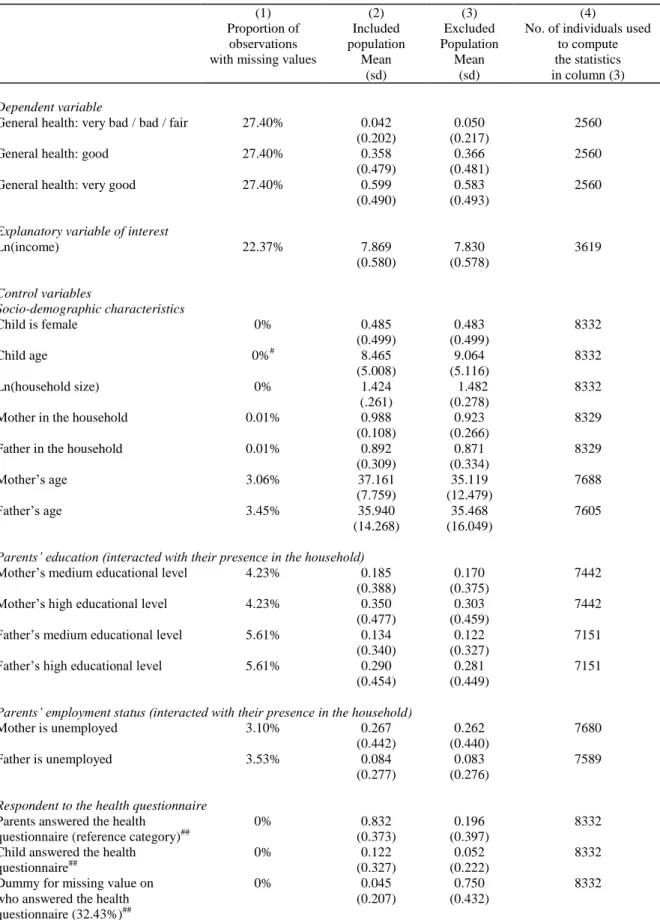
The estimates presented in Table 2 and Figure 2 use the sample of individuals for which general health, income, and all the controls are non-missing. This sample is the included population. In contrast, 39.56% of children in our sample have missing information in at least one of the variables we use, and are dropped from the analysis. These individuals are the excluded population. Table 3, Column (1), reports the percentage of missing data for each variable. This column highlights that the percentage of individuals with missing values on general health and income is large. In contrast, the share of individuals with missing values on the control variables is small. The one exception is the identity of the respondent to the child health questionnaire, which is unknown / missing for 32.43% of observations, and for which we use a dummy capturing the missing values.
To examine whether the results presented in Table 2 and Figure 2 (using the included population) can be generalized to the whole French population, Table 3 also reports the mean characteristics of the included and excluded populations in columns (2) and (3). Note that the mean characteristics for the excluded population in column (3) are obviously computed using the observations from the excluded population for which the characteristics are non-missing. The number of observations that we use is given in column (4). Columns (2) and (3) suggest that the mean characteristics of the included and excluded population are rather similar, so that the results presented on the gradient in general health in Table 2 and Figure 2 may be true for the whole French population. Note that as expected the percentage of missing values on the identity of the respondent to the health
questionnaire is larger in the excluded population than in the included population. [Insert Table 3 here]
3.3. Prevalence of specific health problems
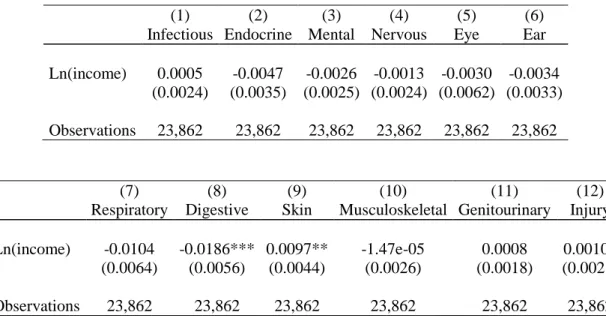
Table 4 reports the results for the prevalence of specific health problems. In the first column, we regress the presence of an infectious problem on the logarithm of income and “controls 2.” The following columns report the results for the other specific health problems. We find that the correlation between income and specific health problems is generally insignificant. However, children from low-income families are significantly more likely to have digestive problems than children from high-income families. The greater prevalence of digestive problems for children from low-income families may be related to their greater BMI-for-age (see subsection 3.4). The table also suggests that children from high-income families are significantly more likely to have skin
problems.
[Insert Table 4 here]
3.4. The gradient in anthropometric measures
To complement our analysis on child general health, we examine the income gradient in anthropometric measures. Table 5 reports the results. We find that income is not significantly correlated with weight-for-age but that it is positively and significantly correlated with height-for-age. Because children from low-income families are (significantly) shorter than children from high-income families, but are not (significantly) thinner, BMI-for-age is (significantly) greater for children from low-income families than for children from high-income families. Similarly, the probability of being overweight / obese is significantly higher among low-income children. Income inequalities in overweight / obesity are likely to play a role in the income gradient in general health that is highlighted above.
3.5. The roles of unmet needs for care and supplemental health insurance coverage
We finally examine the role of the use of unmet needs for care and supplemental health insurance coverage in the gradient in general health.
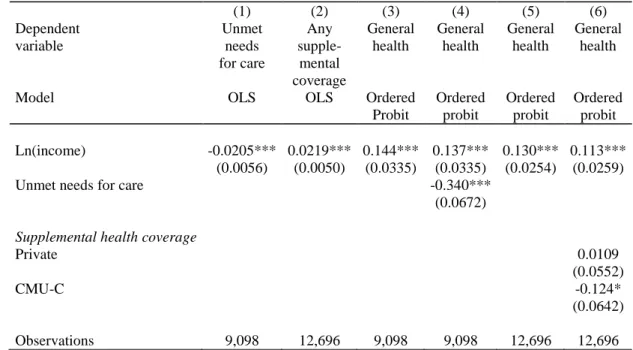
We first explore the impact of income on having unmet needs for care and having supplemental health insurance coverage. Results of regressions of unmet needs and insurance coverage on income (and controls) are presented in Table 6, columns (1)-(2). The results suggest there is a large and significant correlation between income and unmet needs for care, and between income and any supplemental health insurance.
We then explore whether unmet needs for care and supplemental coverage are mechanisms through which income has an impact on general health. We re-estimate the basic model for child general health, controlling for unmet needs for care (respectively supplemental insurance). If unmet needs for care (respectively supplemental insurance coverage) is an important mechanism through which income has an impact on general health, then the coefficient on income will dramatically decrease when the unmet needs for care variable (respectively the supplemental coverage variable) is included in the model.
The results are presented in Table 6, columns (3)-(6). In column (3), we estimate the gradient, not controlling for unmet needs for care, for the sample of children for whom we have information on unmet needs for care. As expected, the size of the gradient is very similar to that in Table 2, when “controls 2” are included. In column (4), we include the control for unmet needs. We observe that the coefficient on income is almost unaffected by this inclusion, which may imply that having unmet needs for care is not an important mechanism through which income has an impact on child general health. However, unmet needs for care do have a large and significant independent effect on child general health.
Similarly, columns (5) and (6) reveal that controlling for the type of health insurance coverage only slightly affects the size of the coefficient on income. This result could mean that the type of
insurance coverage is not an important mechanism underlying the income gradient in general health.
Note that the coefficient on CMU-C in column (6) is negative and significant, which does not mean that CMU-C has a negative impact on health, but that among people who are eligible to CMU-C, only those who are in poor health actually gets CMU-C. This indicates that our last model suffers from reverse causation. Additional research that addresses this reverse causation issue is thus needed.
[Insert Table 6 here]
4. Discussion
This paper investigates the relationship between family income and child health in France. We use a large sample of children ages 0 to 17 to examine the correlation between income, child general health, specific health problems, anthropometric measurements, unmet needs for care, and supplemental insurance coverage.
Our article finds a positive and significant association between family income and child general health in France. In addition, there is some evidence that the gradient increases between child age groups, although larger datasets of French children are required to get definite conclusions on this matter. As a consequence, universal health insurance coverage and high levels of use of health care services in France do not eliminate the gradient in childhood.
Our finding on the positive association between income and child general health in France is consistent with previous findings for Canada, Germany, and the UK, which also have significant income gradients in spite of universal or near universal access to health care systems [5,24,25]. To compare the slope of the gradient in general health in France with other developed countries, Figure 3 reports the coefficients on the logarithm of income from the child general health models, for France (from our estimates presented in Table 2), Australia [6], Canada [4], Germany [24], and
the US [3]. The econometric models and the list of controls that are used in our paper and in these articles are similar, which makes international comparisons possible. Overall, we find that for all age groups the gradient is smaller in France than in other countries, but point estimates are not significantly different in France than in Australia, Canada, Germany, and the US. Note that the confidence intervals for France and Germany are large, due to relatively small sample sizes.
[Insert Figure 3 here]
In further analyses, our article turns to specific health problems, and explore whether they are more prevalent among children from low-income families. We find that children from low-income families are significantly more likely to get digestive problems. However, the correlation between income and most specific health problems is insignificant. A potential explanation for this result, that future research could focus on, is that the income gradient in these specific health problems is underestimated due to differences in doctor consultation and screening between children from low- and high-income families. These differences may in particular explain the absence of income gradient in (1) certain infectious and parasitic diseases, (2) endocrine, nutritional and metabolic diseases and (12) injury, poisoning and certain other consequences of external causes. Similarly, our findings indicate that children from high-income families are significantly more likely to have skin problems. Again, these differences may simply be due to the greater probability to visit a doctor and to be diagnosed with skin conditions in high-income families.
The last set of results suggests a significant correlation between income on the one hand, and unmet needs for care and any supplemental health insurance on the other hand. So unmet needs for care and supplemental insurance do have an independent effect on child health. These results are consistent with findings for adults [19]. But our results also indicate that unmet needs for care and supplemental health coverage may not be important mechanisms explaining the income gradient in general health in childhood. However, our variables on the type of insurance (which are dummies for CMU-C and for private supplemental insurance) may not be precise enough to capture the role
of supplemental insurance. The kind of supplemental insurance may also matter, since it could have an impact on the quality of care. More precise information on the kind of supplemental coverage would thus be necessary to investigate this point further. Note that in spite of this limitation, our findings for France are consistent with previous findings for other countries, that also highlight that access to health care is probably not a major mechanism underlying health inequalities [9,20]. This finding implies that improving access to health care and insurance coverage may not be enough to decrease income-related inequalities in health between children.
Our results on the income gradient in child general health are subject to some data limitations. Indeed, the child general health is subjective rather than objective. Respondents to the child health questions may use response scales in different manners, depending on their expectations regarding child health and on the household socio-economic characteristics. Consequently, the child
subjective health may not correspond to his objective / clinical health in the same way for different socioeconomic groups. If the reporting bias in the child health variables depends on household income, our estimates of the income gradient will be biased. Biases in self-reported health have already been highlighted for adults [28–30], and the use of self-rated health can lead to an
underestimation of social health inequalities for them [28,31]. As such, the literature recommends to be cautious when using self-rated health to quantify inequalities for adults. Some previous studies support the use of anchoring vignettes to account for differences in reporting styles [32]. Similarly, the use of subjective health could also create a bias in the measurement of the income / health gradient for children, and so caution is also needed. Note however that the previous literature on the gradient in childhood also uses subjective child health variables, like we do, due to the lack of data on objective health for a sufficiently large number of children.
The representativeness of our results may also be questioned: indeed, a large number of children are excluded from our sample, because these children (or their parents) did not complete the survey questions that we use in this article, and because we chose to make no imputation for missing values (for income in particular). However, descriptive statistics provided in Table 3 show that the
included and excluded populations (for the sample we use to examine general health) have rather similar characteristics. As a consequence, we are confident that the results on the gradient in general health do not only hold for a very specific group of children, but could be generalized.
Finally, our study on the gradient in childhood is not prospective and does not establish causality running from parental income to child health, but only correlations between the variables of interest. Future research might be interested in testing whether this correlation represents causality running from household income to child health, as opposed to reverse causation or the omission of third factors. Note that these points have been investigated for the UK and the US, for which rich data on the impact of child health on parental income are available, with the broad finding that the
correlation probably represents causality from income to child health [3,9].
5. Conclusion
Additional research is needed to better understand the correlation between household income and child health. It would seem important to explore several mechanisms that could explain the
correlation (or the causal impact) of parental income on child health. Previous research has already explored whether nutrition and housing conditions are mechanisms through which income has an impact on child health [7,9]. However, these mechanisms need re-assessing with more detailed data on diet and living conditions. Knowledge about the roles of nutrition and housing conditions will certainly improve the implementation of policies promoting child health. This objective is all the more important as poor health in childhood is not only related to lower child well-being in the short run, but also to future educational and labor market outcomes in the long run [33].
Conflict of interest: none.
Acknowledgements: Data from the ESPS were supplied by the Institut de Recherche et
Documentation en Economie de la Santé (IRDES). The authors take responsibility for the integrity of this work. We would like to thank an anonymous referee, Emmanuelle Cambois, Kwabena Gyimah-Brempong, Stacey Gelsheimer, Natallia Gray, Florence Jusot, Robyn Kibler, Michelle Lieven, Andreas Müller, Serge Paugam, Gabriel Picone, Phillip Porter, Sandy Tubeuf, and participants to the Workshop on Social Health Inequalities at Paris School of Economics in June 2013, for their constructive comments.
References
1. Marmot M, Bobak M. International comparators and poverty and health in Europe. Br. Med. J. 2000 Nov 4;321:1124–8.
2. Winkleby MA, Jatulis DE, Frank E, Fortmann SP. Socioeconomic status and health: how education, income, and occupation contribute to risk factors for cardiovascular disease. Am. J. Public Health. 1992 Jun 1;82(6):816–20.
3. Case A, Lubotsky D, Paxson C. Economic status and health in childhood: the origins of the gradient. Am. Econ. Rev. 2002;92(5):1308–34.
4. Currie J, Stabile M. Socioeconomic status and child health: why is the relationship stronger for older children? Am. Econ. Rev. 2003;93(5):1813–23.
5. Jürges H. Health inequalities by education, income and wealth: a comparison of 11 European countries and the US. Appl. Econ. Lett. 2009;17(1):87–91.
6. Khanam R, Nghiem HS, Connelly LB. Child health and the income gradient: evidence from Australia. J. Health Econ. 2009 Jul;28(4):805–17.
7. Currie A, Shields MA, Price SW. The child health/family income gradient: evidence from England. J. Health Econ. 2007 Mar 1;26(2):213–32.
8. Propper C, Rigg J, Burgess S. Child health: evidence on the roles of family income and maternal mental health from a UK birth cohort. Health Econ. 2007 Nov 1;16(11):1245–69. 9. Apouey B, Geoffard P-Y. Family income and child health in the UK. J. Health Econ.
2013;22(4):715–27.
10. Mackenbach JP, Stirbu I, Roskam A-JR, Schaap MM, Menvielle G, Leinsalu M, et al. Socioeconomic inequalities in health in 22 European countries. N. Engl. J. Med. 2008;358(23):2468–81.
11. Van Doorslaer E, Koolman X. Explaining the differences in income-related health inequalities across European countries. Health Econ. 2004;13(7):609–28.
12. Hernandez-Quevedo C, Jones AM, Lopez-Nicolas A, Rice N. Socioeconomic inequalities in health: a longitudinal analysis of the European Community Household Panel. Soc. Sci. Med. 2008;27(6):1246–61.
13. Hernandez-Quevedo C, Masseria C, Mossialos E. Analysing the socioeconomic
determinants of health in Europe: new evidence from EU-SILC. Luxembourg; 2010 p. 1–38. 14. Tursz A. La santé de l’enfant. In: Fassin D, Grandjean H, Kaminskidu M, editors. Les
inégalités sociales de santé. La Découverte, Recherches; 2000. p. 193–206.
15. Kaminski M, Saurel-Cubizolles M-J. La santé périnatale. In: Fassin D, Grandjean H, Kaminski M, editors. Les inégalités sociales de santé. La Découverte, Recherches; 2000. p. 173–92.
16. Guignon N, Badéyan G. La santé des enfants de 6 ans à travers les bilans de santé scolaire. DREES, Etudes et Résultats. 2002;155:1–8.
17. Klein-Platat C, Wagner A, Haan MC, Arveiler D, Schlienger JL, Simon C. Prevalence and sociodemographic determinants of overweight in young French adolescents. Diabetes. Metab. Res. Rev. Strasbourg, France: Groupe d’Etudes en Nutrition, Service de Médecine Interne et de Nutrition, Hôpital de Hautepierre; 2003;19(2):153–8.
18. Currie C, Zanotti C, Morgan A. Social determinants of health and well-being among young people. Health Behaviour in School-aged Children (HBSC) study: international report from the 2009/2010 survey. Copenhagen; 2012.
19. Dourgnon P, Jusot F, Fantin R. Payer nuit gravement à la santé : une étude de l’impact du renoncement financier aux soins sur l’état de santé. Economie Publique. 2012;28-29:123–47. 20. Allin S, Stabile M. Socioeconomic status and child health: what is the role of health care,
health conditions, injuries and maternal health? Health Econ. Policy Law. 2012;7(2):227–42. 21. Cambois E, Jusot F. Contribution of lifelong adverse experiences to social health
inequalities: findings from a population survey in France. Eur. J. Public Health. 2011 Oct 1;21(5):667–73.
22. Jusot F, Tubeuf S, Trannoy A. Effort or circumstances: does the correlation matter for inequality of opportunity in health? IRDES. 2010.
23. Desprès C, Dourgnon P, Fantin R, Jusot F. Le renoncement aux soins pour raisons
financières : une approche économétrique. IRDES, Questions d’Economie la Santé. 2011;1– 6.
24. Reinhold S, Jürges H. Parental income and child health in Germany. Health Econ. 2012;21(5):562–79.
25. Van Kippersluis H, Van Ourti T, O’Donnell O, Van Doorslaer E. Health and income across the life cycle and generations in Europe. J. Health Econ. 2009;28(4):818–30.
26. Deaton A, Case A. Broken down by work and sex: how our health declines. Anal. Econ. Aging. University of Chicago Press; 2005.
27. Case A, Lee D, Paxson C. The income gradient in children’s health: a comment on Currie, Shields and Wheatley Price. J. Health Econ. 2008 May;27(3):801–7.
28. Delpierre C, Lauwers-Cances V, Datta GD, Berkman L, Lang T. Impact of social position on the effect of cardiovascular risk factors on self-rated health. Am. J. Public Health. 2009;99(7).
29. Dowd JB, Zajacova A. Does self-rated health mean the same thing across socioeconomic groups? Evidence from biomarker data. Ann. Epidemiol. 2010;20(10):743–9.
30. Etilé F, Milcent C. Income-related reporting heterogeneity in self-assessed health: evidence from France. Health Econ. 2006;15(9):965–81.
31. Delpierre C, Kelly-Irving M, Munch-Petersen M, Lauwers-Cances V, Datta GD, Lepage B, et al. SRH and HrQOL: does social position impact differently on their link with health status? BMC Public Health. 2012;12:19.
32. Dowd JB, Todd M. Does self-reported health bias the measurement of health inequalities in us adults? Evidence using anchoring vignettes from the health and retirement study. Journals Gerontol. Ser. B Psychol. Sci. Soc. Sci. 2011;66(4):478–89.
33. Currie J. Healthy, wealthy, and wise: socioeconomic status, poor health in childhood, and human capital development. J. Econ. Lit. 2009;47(1):87–122.
Table 1. Description of the sample
Variables of interest Percent/Mean
Child general health
General health 1= very bad / bad / fair 4.31%
2=good 35.83%
3=very good 59.87%
Child specific health problems
(1) Infectious Dummy for certain infectious and parasitic diseases 1.82% (2) Endocrine Dummy for endocrine, nutritional and metabolic diseases 5.27% (3) Mental Dummy for mental and behavioral disorders 2.45% (4) Nervous Dummy for diseases of the nervous system 2.17% (5) Eye Dummy for diseases of the eye and adnexa 21.32% (6) Ear Dummy for diseases of the ear and mastoid process 5.14% (7) Respiratory Dummy for diseases of the respiratory system 20.37% (8) Digestive Dummy for diseases of the digestive system 17.73% (9) Skin Dummy for diseases of the skin and subcutaneous tissue 10.13% (10) Musculoskeletal Dummy for diseases of the musculoskeletal system and
connective tissue
2.71%
(11) Genitourinary Dummy for diseases of the genitourinary system 1.23% (12) Injury Dummy for injury, poisoning and certain other
consequences of external causes
1.91%
Anthropometric measurements
Weight-for-age Weight-for-age z-score 0.099 Height-for-age Height-for-age z-score 0.203 BMI-for-age BMI-for-age z-score 0.032 Overweight or obese Dummy for whether the child is overweight or obese (for
children above 2 only)
15.0%
Use of health care services
although he needed care Supplemental health care coverage
Any supplemental coverage
Dummy for whether the child has any supplemental health insurance coverage
95.64%
CMU-C Dummy for whether the child is covered by the universal supplemental health insurance coverage
12.83%
Private Dummy for whether the child is covered by a supplemental private health insurance
82.82%
Family income
Table 2. Family income and child general health (ordered probit models)
Ages 0-17 Ages 0-3 Ages 4-8 Ages 9-12 Ages 13-17
“Controls 1” included Ln(income) 0.182*** 0.115** 0.121*** 0.229*** 0.254*** (0.0214) (0.0462) (0.0400) (0.0459) (0.0394) Observations 12,732 2,685 3,800 2,885 3,362 “Controls 2” included Ln(income) 0.128*** 0.0778 0.0537 0.118** 0.242*** (0.0254) (0.0560) (0.0467) (0.0531) (0.0486) Observations 12,732 2,685 3,800 2,885 3,362 Notes. The dependent variable is child general health, coded from “1=fair / bad / very bad” to “3=very good.”
Table 3. Proportion of missing data and characteristics of the included and excluded populations (1) (2) (3) (4) Proportion of observations Included population Excluded Population
No. of individuals used to compute
with missing values Mean Mean the statistics
(sd) (sd) in column (3)
Dependent variable
General health: very bad / bad / fair 27.40% 0.042 0.050 2560
(0.202) (0.217)
General health: good 27.40% 0.358 0.366 2560
(0.479) (0.481)
General health: very good 27.40% 0.599 0.583 2560
(0.490) (0.493)
Explanatory variable of interest
Ln(income) 22.37% 7.869 7.830 3619 (0.580) (0.578) Control variables Socio-demographic characteristics Child is female 0% 0.485 0.483 8332 (0.499) (0.499) Child age 0%# 8.465 9.064 8332 (5.008) (5.116) Ln(household size) 0% 1.424 1.482 8332 (.261) (0.278)
Mother in the household 0.01% 0.988 0.923 8329
(0.108) (0.266)
Father in the household 0.01% 0.892 0.871 8329
(0.309) (0.334)
Mother’s age 3.06% 37.161 35.119 7688
(7.759) (12.479)
Father’s age 3.45% 35.940 35.468 7605
(14.268) (16.049)
Parents’ education (interacted with their presence in the household)
Mother’s medium educational level 4.23% 0.185 0.170 7442
(0.388) (0.375)
Mother’s high educational level 4.23% 0.350 0.303 7442
(0.477) (0.459)
Father’s medium educational level 5.61% 0.134 0.122 7151
(0.340) (0.327)
Father’s high educational level 5.61% 0.290 0.281 7151
(0.454) (0.449)
Parents’ employment status (interacted with their presence in the household)
Mother is unemployed 3.10% 0.267 0.262 7680
(0.442) (0.440)
Father is unemployed 3.53% 0.084 0.083 7589
(0.277) (0.276)
Respondent to the health questionnaire
Parents answered the health 0% 0.832 0.196 8332
questionnaire (reference category)## (0.373) (0.397)
Child answered the health 0% 0.122 0.052 8332
questionnaire## (0.327) (0.222)
Dummy for missing value on 0% 0.045 0.750 8332
who answered the health
questionnaire (32.43%)##
All variables 39.56%
No. observations 12,732 See Column
(4)
Notes. Column (2) contains the mean characteristics of the included population. The included population is the population that is used in the econometric models used in Table 2 and Figure 2, i.e. individuals between 0 and 17 years of age, who go to school or are too young to go to school, between 2004 and 2010.
Column (3) gives the characteristics of the excluded population, that is to say the population for which there is at least one variable with a missing value. Column (3) reports the characteristics of this excluded population, that are computed using the non-missing observations. Column (4) contains the number of observations that were used to calculate the means in Column (3).
#
Child age is never missing, since being between 0 and 17 is a condition for being in the original sample.
##Information on who answered the health questionnaire of the child is missing for 32.43% of observations. We create a dummy indicating that this piece of information is missing, to avoid losing too many observations.
Table 4. Prevalence of specific health problems (OLS)
(1) (2) (3) (4) (5) (6) Infectious Endocrine Mental Nervous Eye Ear Ln(income) 0.0005 -0.0047 -0.0026 -0.0013 -0.0030 -0.0034
(0.0024) (0.0035) (0.0025) (0.0024) (0.0062) (0.0033) Observations 23,862 23,862 23,862 23,862 23,862 23,862
(7) (8) (9) (10) (11) (12) Respiratory Digestive Skin Musculoskeletal Genitourinary Injury Ln(income) -0.0104 -0.0186*** 0.0097** -1.47e-05 0.0008 0.00101
(0.0064) (0.0056) (0.0044) (0.0026) (0.0018) (0.0021) Observations 23,862 23,862 23,862 23,862 23,862 23,862 Notes. Column (1) reports the results of the model in which a dummy for infectious problems is regressed on the logarithm of income and “controls 2.” The following columns contain the results for the other specific health problems.
“Controls 2” are included.
Table 5. The correlation between parental income and child anthropometric measures (OLS)
(1) (2) (3) (4)
Weight-for-age Height-for-age BMI-for-age Overweight or obese Ln(income) 0.0172 0.0832*** -0.0444** -0.0152**
(0.0197) (0.0231) (0.0214) (0.0060) Observations 21,425 21,425 21,425 19,925 Notes. In column (4), the sample contains children above 2 only.
“Controls 2” are included.
Table 6. Parental income, child unmet needs for care, and supplemental health insurance coverage
(1) (2) (3) (4) (5) (6) Dependent variable Unmet needs for care Any supple- mental coverage General health General health General health General health
Model OLS OLS Ordered
Probit Ordered probit Ordered probit Ordered probit Ln(income) -0.0205*** 0.0219*** 0.144*** 0.137*** 0.130*** 0.113*** (0.0056) (0.0050) (0.0335) (0.0335) (0.0254) (0.0259)
Unmet needs for care -0.340***
(0.0672)
Supplemental health coverage
Private 0.0109
(0.0552)
CMU-C -0.124*
(0.0642)
Observations 9,098 12,696 9,098 9,098 12,696 12,696
Notes. “Controls 2” are included.
Figure 1. Relationship between household income quantiles and general health, by age group
Notes. The figures show average subjective health by within-bracket household income quantiles.
2 .4 2 .5 2 .6 2 .7 1 2 3 4 5 6 7 8 9 10 11 12 13 Income quantiles Ages 0-3 Ages 4-8 Ages 9-12 Ages 13-17 2 2 .5 3 3 .5 1 2 3 4 5 6 7 8 9 10 11 12 13 Income quantiles
Ages 18-24 Ages 25-34 Ages 35-44
Figure 2. Coefficient on the logarithm of income, with child age
Notes. In the regressions, the dependent variable is child general health. Error bars show 90% confidence intervals. “Controls 2” are included.
-. 1 0 .1 .2 .3 .4 0 -3 1 -4 2 -5 3 -6 4 -7 5 -8 6 -9 7 -1 0 8 -1 1 9 -1 2 1 0 -1 3 1 1 -1 4 1 2 -1 5 1 3 -1 6 1 4 -1 7 Child age Coefficient 90% CI
Figure 3. The evolution of the gradient with age in France and in other developed countries When “controls 1” are included
When “controls 2” are included
Notes. Estimates for Australia are only available for children less than 8 years of age. Error bars show 95% confidence intervals.
0 .1 .2 .3 .4 0-3 4-8 9-12 13-17
France Canada USA
Germany Australia 0 .1 .2 .3 .4 0-3 4-8 9-12 13-17
France Canada USA