Noujoude Nader
« Sorbonne University, Université de technologie de Compiègne
Doctoral School « Sciences pour l'Ingénieur » and Lebanese University Doctoral
School « Sciences et Technologie »
Titre:
Connectivity analysis of the EHG during pregnancy and Labor
Thèse Soutenue le 31-1-2017
Jury:
Régine LE BOUQUIN JEANNES Prof. , Université de Rennes 1 Reviewer Zaher DAWI Prof., American University of Beirut Reviewer Sofiane BOUDAOUD Assistant Prof., Université de Technologie de Compiègne Examiner Massimo MISCHI Assistant Prof., Eindhoven University of Technology Examiner Mahmoud HASSAN Dr., Université de Rennes 1 Examiner
Mohamad KHALIL Prof., Université libanaise Supervisor
Wassim FALOU Prof., Université libanaise Co-Supervisor Catherine MARQUE Prof., Université de Technologie de Compiègne Supervisor
COTUTELLE THESIS
To obtain the degree of Doctor in “Computer Science” issued by
Sorbonne University, Université de technologie de Compiègne
Doctoral School « Sciences pour l'Ingénieur »
and
Lebanese University
Doctoral School « Sciences et Technologie »
Presented and publicly defended byNADER Noujoud
31-1-2017
Title:
1
2
R
ESUME FRANÇAIS
«Tout objet étudié par la biologie est un système de systèmes» (Jacob, 1976). Pour le système de systèmes complexe qu’est le corps humain, de nombreuses questions restent ouvertes, particulièrement en ce qui concerne l'utérus. Comment l'utérus fonctionne exactement? Comment reste-t-il au repos pendant la plus grande partie de la grossesse? Et comment se contracte-t-il d'une manière très organisée pendant le travail pour expulser un nouvel être humain dans ce monde? Les réponses à toutes ces questions pourraient sauver la vie de plus d'un million d'enfants qui sont morts parce que nés prématurément.
Donner naissance, ce miracle de la vie, peut se terminer tragiquement si l’enfant nait prématurément. En effet, l’accouchement prématuré survient quand une femme souffre de complications de sa grossesse et accouche avant la 37e semaine de gestation. Le risque de mortalité et de morbidité est le plus élevé pour les nouveau-nés qui naissent avant terme. La naissance d'un nouveau-né prématuré peut également entraîner des coûts économiques considérables et avoir des répercussions à court, moyen et long termes sur les services publics, tels que l'assurance maladie, l'éducation et d'autres systèmes de soutien social. Le fardeau économique social associé à la naissance prématurée était d'au moins 26,2 milliards de dollars en 2005 aux Etats-Unis (Behrman et al., 2007). Passer quelques jours de plus dans l'utérus peut cependant améliorer considérablement la maturation du fœtus. De ce fait, la détection précoce de l’accouchement prématuré est l'une des clés les plus importantes pour sa prévention et la diminution de ses conséquences.
L'un des marqueurs biologiques les plus prometteurs de la contraction utérine est l'activité électrique de l'utérus. Cette activité se reflète dans l'électrohystéogramme (EHG), qui représente la mesure non invasive de l'activité électrique utérine sur l’abdomen de la mère (Devedeux et al., 1993). Plusieurs études ont déjà été réalisées dans le contexte de la détection dude l’accouchement prématuré en analysant l'EHG (Euliano et al., 2009; Marque and Duchene, 1989; Planes et al., 1984). En fait, L'EHG est l'un des rares indicateurs accessibles de manière non-invasive, représentatifs de l'activité musculaire sous-jacente aux contractions utérines.
3
Le travail et l'accouchement sont précédés de deux phénomènes physiologiques: l’augmentation de l'excitabilité utérine et l’augmentation de la connectivité entre les cellules myométriales, suite à l’augmentation de la propagation du potentiel d'action initiateurs des contractions utérines (Devedeux et al., 1993).
Plusieurs études ont été réalisées pour caractériser la propagation utérine en étudiant la synchronisation entre les signaux EHG enregistrés à la surface de l’abdomen. Ces études se sont fondées sur différentes méthodes telles que: i) la connectivité/corrélation entre EHG (Euliano et al., 2009; Mahmoud Hassan et al., 2010; Marque and Duchene, 1989) où les méthodes ont été appliquées sur les contractions utérines segmentées manuellement, ii) la vitesse de propagation, quantifiée par analyse soit de la propagation du signal EHG entier (Lucovnik et al., 2011) (Mikkelsen et al., 2013), soit de pics isolés dans les bouffées d’EHG (Lucovnik et al., 2011; C. Rabotti et al., 2010)(Lau et al., 2014)(de Lau et al., 2013). L'analyse basée sur les pics isolés (en utilisant souvent des électrodes de petite taille) permettrait d’analyser plus précisément le processus de diffusion électrique.
L'analyse de connectivité a donné des résultats prometteurs en utilisant les signaux EHG pour l'identification du couplage statistique entre les contractions utérines enregistrées pendant le travail et/ou la grossesse, s’intéressant ainsi à la synchronisation globale de l’activité contractile., L'objectif principal de cette thèse est d'étudier cette synchronisation globale de l'activité électrique utérine en étudiant la connectivité entre différentes voies d’EHG enregistrées au cours de la grossesse et de l’accouchement. Concernant l'analyse globale, dans la plupart des études précédentes, les matrices de corrélation ont été réduites en ne gardant que leurs moyennes. Malgré les résultats encourageants obtenus, des informations pertinentes peuvent être manquées du fait de cette procédure de moyennage, ce qui peut expliquer les taux de classement relativement faibles obtenus jusqu'à présent. Pour caractériser précisément la matrice de corrélation et quantifier la connectivité associée, nous avons utilisé ici l'analyse basée sur la théorie des graphes., Ce type d’analyse, basée sur la théorie des graphes dans la caractérisation des matrices de corrélation (connectivité), s’est particulièrement développée récemment, notamment pour l’analyse des signaux électroencéphalographiques (EEG) (Bullmore and Sporns, 2009; Rubinov and Sporns, 2010; van den Heuvel and Sporns, 2013).
4
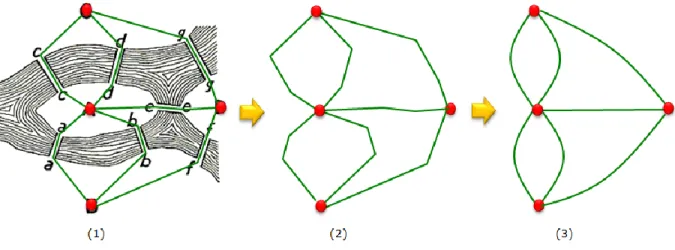
Intuitivement, un graphe peut être défini par un ensemble de nœuds connectés par des arrêtes. En utilisant l’analyse de graphe, la matrice de corrélation peut être représentée sous forme d’un graphe constitué d'un ensemble de noeuds (électrodes) interconnectés par des arêtes (valeurs de connectivité / corrélation entre les signaux recueillis par les électrodes).
Deux approches principales ont été utilisées dans cette thèse: i) L’estimation de la connectivité au niveau de l'abdomen (électrodes) et ii) L’estimation de la connectivité au niveau de la source utérine (après localisation des sources). Le schéma complet du travail de thèse est présenté figure 0.1.
Tout d'abord, les signaux EHG ont été enregistrés pendant la grossesse et le travail en utilisant une grille de 4 * 4 électrodes (Figure 0.1 A). Afin d’analyser ces signaux, nous avons étudié la corrélation (connectivité) entre les activités électriques utérines et leur quantification précise en se basant sur une nouvelle approche : la théorie des graphes. Les étapes suivies dans cette procédure sont les suivantes: (i) Estimation de la connectivité entre les signaux EHG (Figure 0.1 B) ; (ii) Quantification des matrices de connectivité obtenues à l'aide de la théorie des graphes (Figure 0.1 E) ; iii) Application clinique des mesures de graphe pour la surveillance de la grossesse ainsi que pour la classification entre grossesse et travail (Figure 0.1 E). Une comparaison avec les paramètres classiques de l'état de l’art pour la détection du travail prématuré a également été effectuée.
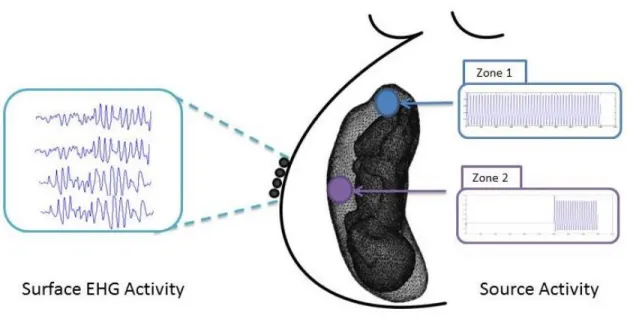
Pour s’affranchir du problème du volume conducteur dans l’estimation de la connectivité au niveau de la surface abdominale, nous avons proposé une nouvelle méthode appelée «connectivité des signaux EHG au niveau de la source» (Figure 0.1 C, D). Cette méthode consiste à identifier par méthode inverse les signaux des sources utérines puis à calculer le couplage statistique entre ces sources. Comme cette nouvelle méthode comprend deux étapes (identification des sources et analyse de conenctivité) pour lesquelles il n’existe pas de données bibliographiques sur les meilleures méthodes inverse/connectivité à utiliser pour l’EHG, nous avons analysé l'effet i) de l'algorithme utilisé dans la solution du problème inverse EHG et ii) de la méthode utilisée pour l'estimation de la connectivité, en utilisant des données simulées à partir d’un modèle biophysique développé dans l'équipe. Ensuite, comme au niveau de la surface, les matrices de connectivité obtenues au niveau source seront quantifiées en utilisant l’analyse basée sur la théorie des graphes (Figure 0.1 E).
5
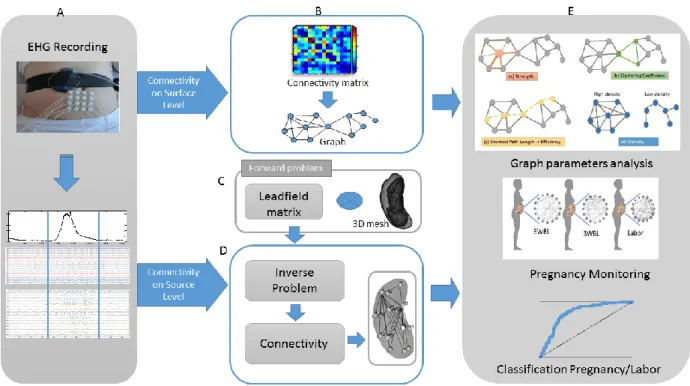
Figure 0.1 Schéma bloc complet de la thèse A. Enregistrement des signaux EHG B. Connectivité au niveau de la surface en utilisant les signaux EHG C. Problème Direct D. Connectivité au niveau de la source en utilisant les signaux EHG et la matrice du champ de dérivation estimée à partir du problème direct. E. Analyse de graphe et ses applications cliniques pour la surveillance de la grossesse ainsi que pour la classification entre grossesse et travail.
Le manuscrit est organisé comme suit:
Chapter 1 Dans ce chapitre, nous présentons l'état de l'art sur les bases anatomiques et
physiologiques de l'utérus et de la contractilité utérine, en présentant les deux facteurs principaux qui la génèrent: l'excitabilité cellulaire et la propagation de l'activité électrique. Nous décrivons également les différentes études de propagation qui ont été déjà faites, ainsi que les principaux objectifs de la thèse et la nouvelle approche proposée.
Chapter 2 Dans ce chapitre, nous présentons les matériels et méthodes utilisés dans cette
thèse. Nous décrivons tout d'abord les méthodes existantes utilisées pour analyser la propagation de l'activité électrique utérine. Une explication détaillée de la nouvelle approche proposée est également présentée. Pour l'analyse des signaux EHG, nous proposons d'utiliser une technique de mesure de la connectivité des réseaux basée sur la théorie des graphes.
6
Nous avons également utilisé cette nouvelle approche pour la connectivité au niveau de la source utérine. Ces méthodes ont été appliquées sur des données simulées et réelles. Nous allons également expliquer brièvement le modèle utilisé pour simuler l'activité utérine ainsi que le protocole expérimental utilisé pour enregistrer les signaux EHG réels.
Chapter 3 Nous présentons dans ce chapitre les résultats obtenus pour le calcul de la
connectivité au niveau des EHG abdominaux. Nous avons d'abord comparé plusieurs méthodes de connectivité pour estimer la matrice d'adjacence représentée sous la forme d'un graphe. Nous avons ensuite évalué la performance de différentes mesures de graphe dans la classification des contractions de grossesse et de travail. Une comparaison avec les paramètres existants utilisés dans l'état de l'art pour la détection du travail et de la prévision du travail prématuré est également présentée.
Chapter 4 Dans ce chapitre, nous montrons les résultats préliminaires obtenus lors de l'étude
de la connectivité au niveau des sources d’EHG identifiées au niveau du myomètre. Nous évaluons les différentes solutions inverses et les méthodologies de connectivité (pour calculer les couplages statistiques entre les sources reconstruites). Les réseaux obtenus par chacune des combinaisons sont comparés au réseau de référence généré par le modèle. Cette approche a également été appliquée à des signaux EHG réels.
Une conclusion générale et des perspectives sont enfin présentées au chapitre 5
Les résultats obtenus dans cette thèse nous ont permis de rédiger : 1 article de revue international en révision (un autre en préparation), 3 conférences internationales, 2 conférences nationales.
7
T
ABLE OF CONTENTS
0
General Introduction ... 12
Author’s publication ... 16
1.
Chapter 1: Background, problem statement and proposed approach ... 18
1.1 Preterm labor ... 18
1.2 Uterus anatomy and physiology ... 19
1.3 Uterine electrical activity ... 21
1.3.1 Cell excitability ... 21
1.3.2 Propagation of the uterine electrical activity ... 21
1.4 Pregnancy monitoring and preterm labor detection Methods ... 23
1.4.1 Pregnancy and Labor Monitoring Methods ... 23
1.4.2 Electrode number and position ... 25
1.4.3 Multichannel System for EHG Recording ... 28
1.5 Propagation analysis of the EHG signals ... 29
1.5.1 Proposed approach ... 34
2
Chapter 2: Materials AND Methods ... 36
2.1 Previously used methods ... 36
2.1.1 Propagation Velocity and Peak Frequency (PV+PF) ... 36
2.1.2 Conduction Velocity (CV) ... 37
2.1.3 Correlation analysis... 37
2.2 Proposed approach ... 40
2.2.1 Imaginary part of coherence (Icoh) ... 40
2.2.2 Graph theory ... 41 2.2.3 Source localization ... 47 2.3 Data ... 50 2.3.1 Real EHGs ... 51 2.3.2 Simulated EHGs ... 54 2.4 Work Content ... 58
2.4.1 Connectivity on surface level ... 58
2.4.2 Connectivity at the source level ... 59
2.4.3 Statistical tests ... 61
8
3
Chapter 3: EHG Connectivity analysis during pregnancy and Labor ... 63
3.1 Overview ... 63
3.2 Pregnancy vs. labor Classification ... 64
3.2.1 Graph measures ... 64
3.2.2 Graph visualization ... 68
3.2.3 Node-Wise Analysis ... 69
3.3 Pregnancy Monitoring... 71
3.3.1 Graph Measures and Visualization ... 71
3.3.2 Node Wise Analysis ... 73
3.4 Longitudinal analysis per woman ... 75
3.5 Week of gestation ... 76
3.6 Discussion and conclusion ... 77
4
Chapter 4: EHG source connectivity analysis ... 81
4.1 Overview ... 81
4.2 Results on simulated data ... 82
4.3 Results on Real data ... 88
4.3.1 Node Wise Analysis ... 88
4.3.2 Edge Wise Analysis ... 89
4.4 Discussion and conclusion ... 93
5
Discussion and perspectives ... 97
6
References ... 119
7Appendix A ... 102
8Appendix B ... 105
9Appendix C ... 109
10Appendix D... 111
11Appendix E ... 113
12Appendix F ... 114
9
T
ABLE OF
F
IGURES
General Introduction
Figure 0.1 Schéma bloc complet de la thèse A. Enregistrement des signaux EHG B. Connectivité au niveau de la surface en utilisant les signaux EHG C. Problème Direct D. Connectivité au niveau de la source en utilisant les signaux EHG et la matrice du champ de dérivation estimée à partir du problème direct. E. Analyse de graphe et ses applications cliniques pour la surveillance
de la grossesse ainsi que pour la classification entre grossesse et travail. ... 5
Figure 0.1 Complete pipeline of the thesis A. EHG recording B. Connectivity at the surface level that uses the EHG signals C. Forward Problem D. Connectivity at the source level that uses the EHG signals and the leadfield matrix estimated from the forward problem. E. Network analysis and its clinical use for pregnancy monitoring as well as for the classification between pregnancy and labor... 14
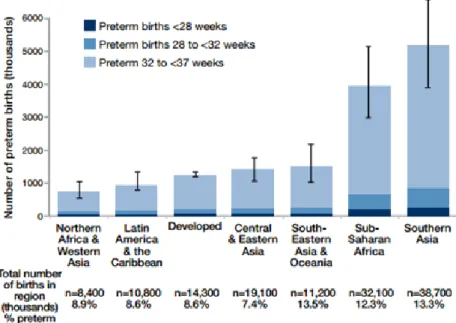
Figure 1.1: Preterm birth by region and week of gestation for 2010 (Blencowe et al., 2010) ... 19
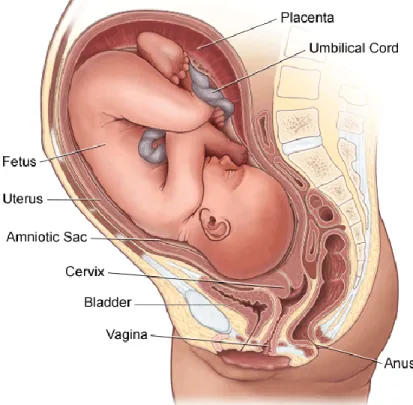
Figure 1.2: Anatomy of pregnant woman uterus (“Stanford Children’s Health” ) ... 20
Figure 1.3: The evolution of Gap junction number during gestation, birth and after delivery (Garfield et al., 1977) ... 22
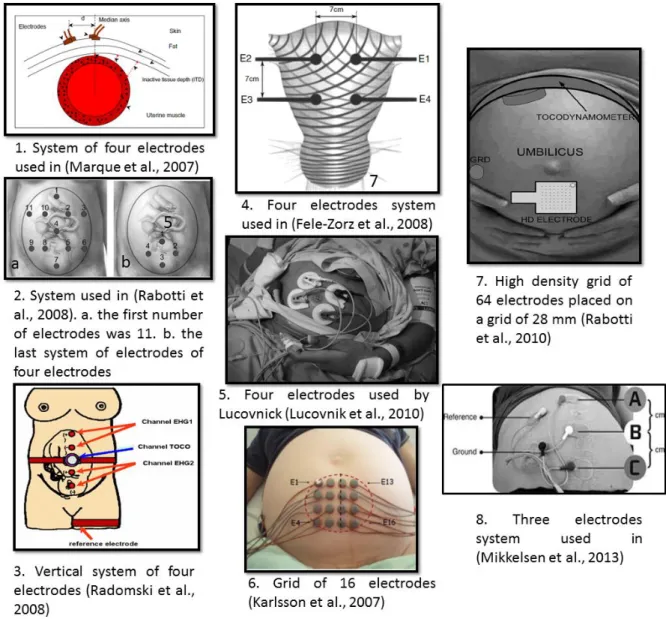
Figure 1.4: Different techniques used to record EHG signals. ... 26
Figure 2.1 The seven Köningsberg bridges problem ... 42
Figure 2.2 Definition of the graph. ... 43
Figure 2.3 The different graph types obtained from the types of connectivity. Functional connectivity leads to: (a) Unweighted (Binary) Undirected graph and (b) Weighted Undirected graph. Effective Connectivity leads to: (c) Unweighted (Binary) Directed graph and (d) Weighted Directed graph ... 44
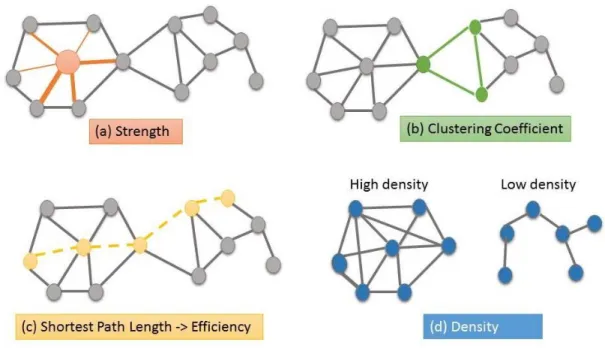
Figure 2.4: Measures of network. (a) Strength: the sum of weights of links connected to the node (orange). (b) Clustering coefficient: triangle counts (green) (c) The Efficiency based on the shortest path length (yellow) (d) Density: fraction of present connections to possible connections (Gray and blue). ... 46
Figure 2.5 The grid of 4*4 electrodes system used for the uterine EHG measurement. (a) The grid position on the woman abdomen. (b) The recording system composed of the grid of electrodes, two references electrodes and the TOCO sensor. (b) The electrodes numbering on the grid when looking at the woman abdomen ... 52
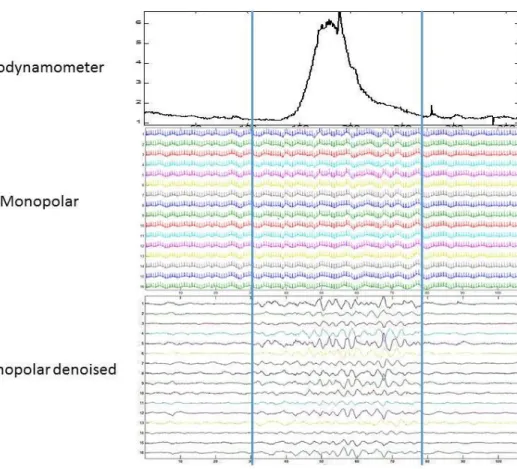
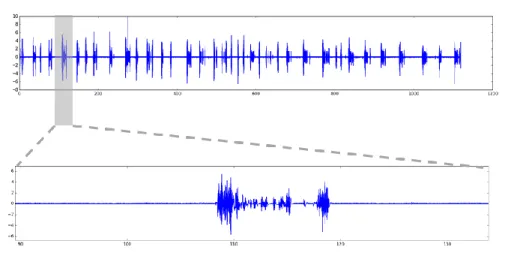
Figure 2.6 : Segmentation and Denoising of the recorded EHG signals. (a) TOCO signal used for segmentation. (b) Monopolar raw EHGs. (c) Monopolar EHGs after denoising. ... 53
Figure 2.7: Uterine and fetal mesh (Yochum, Laforêt, and Marque 2016) ... 55
Figure 2.8: Simulated Uterine EHG signals from source cells ... 56
Figure 2.9 Example of an EHG signal recorded in the uterus of a monkey ... 57
Figure 2.10 The different scenarios network. (a) Ground truth of scenario 1. (b) Ground truth of scenario 2. (c) Ground truth of scenario 3. ... 58
10
Figure 2.11 Structure of the investigation. (a) Multichannel EHG recordings using a grid of 4x4 electrodes. (b) Segmentation and filtering of EHG signals. (c) Pair-wise connectivity matrix. (d) Characterization of connectivity matrices using network measures (e) Graphs used for pregnancy monitoring along week of gestation . (f) Statistical study based on the extraction of graph
parameters. (g) Classification of labor/pregnancy. ... 59 Figure 2.12: Structure of the investigation. First, a given network is generated by the model and considered as the ‘ground truth’. The statistical couplings are then computed between the original sources by using three different methods (R2, h2 and Icoh). By solving the forward problem, we generate synthetic EHGs. These signals are then used to solve the inverse problem in order to reconstruct the sources by using three different inverse solutions (MNE, wMNE, sLORETA). The statistical couplings are then computed between the reconstructed sources by using the same different methods (R2, h2 and Icoh). The identified network by each combination (inverse/connectivity) was then compared with the original network using a ‘network similarity’ algorithm. ... 60 Figure 3.1 ROC Curves for Icohwithout and with using graph analysis. CC_icoh, Eff_icoh, strength_icoh represents respectively the results obtained with CC, Eff, Str parameters computed from the connectivity values obtained by Icoh. Icoh represents the roc curve of the results
obtained using Icoh without graph. ... 64 Figure 3.2 ROC Curves for FW_h2 without and with using graph. strength_Fw_h2, Eff_Fw_h2 and CC_Fw_h2 represents respectively the results obtained with Str, Eff and CC parameters computed from the connectivity values obtained by Fw_h2. Fw_h2 represents the roc of the results obtained by Fw_h2 without graph ... 65 Figure 3.3 ROC Curves for r2 without and with using graph analysis. strength_r2, Eff_r2 and CC_r2 represents respectively the results obtained with Str, Eff and CC parameters computed from the connectivity values obtained by Fw_h2. R2 represents the roc of the results obtained by R2 without graph. ... 66 Figure 3.4 Roc Curves for the Comparison of CV, PV+PF and Icoh/Str. ... 66 Figure 3.5 Graph results using Icoh. (a) Mean pregnancy graph. (b) Mean labor graph ... 69 Figure 3.6 Boxplots of three parameter values in pregnancy and labor on 16 nodes (electrodes). All the differences are significant (p<0.01). (a) Str (b) Eff (c) CC ... 70 Figure 3.7 (a) Evolution of Icoh/Str with week before labor. Each point represents the Str value of one contraction for a given woman. Mean graph for: (b) 8WBL. (c) 6WBL. (d) 4WBL. (e) 3WBL. (f) 2WBL. (g) 1WBL. (h) Labor. ... 72 Figure 3.8 Boxplots of Str values for node 12 from with week before labor. Mean graph for: (b) 8WBL. (c) 6WBL. (d) 4WBL. (e) 3WBL. (f) 2WBL. (g) 1WBL. (h) Labor. ... 73 Figure 3.9 Evolution of Icoh/Str with week before labor for Woman W35. Each point represents the Str value of one contraction for this woman. ... 75 Figure 3.10 Mean graphs for woman W35 contractions in each term ... 76 Figure 3.11 Graph results for Woman W3. (a) Mean pregnancy graph (b) Mean labor graph .... 77 Figure 3.12 Mean graphs for EHGs recorded at 39WG: (a) Pregnancy, (b) Labor. ... 78
11
Figure 4.1 Complete network scenario. A) Uterine networks obtained by using the different inverse and connectivity methods, B) The original network (ground truth) and C) Values (mean ± standard deviation) of the similarity indices computed between the network identified by each combination and the model network. ... 85 Figure 4.2 One network scenario. A) Uterine networks obtained by using the different inverse and connectivity methods, B) The original network (ground truth) and C) Values (mean ± standard deviation) of the similarity indices computed between the network identified by each combination and the model network. ... 86 Figure 4.3 Two interconnected networks scenario. A) Uterine networks obtained by using the different inverse and connectivity methods, B) The original network (ground truth) and C) Values (mean ± standard deviation) of the similarity indices computed between the network identified by each combination and the model network. ... 87 Figure 4.4 Node-wise analysis for Strength metric. Only nodes showing significant differences between pregnancy/labor were visualized ... 90 Figure 4.5 Node-wise analysis for clustering coefficient metric. Only nodes showing significant differences between pregnancy/labor were visualized ... 91 Figure 4.6 Edge-wise analysis. Only edges showing significant differences between
pregnancy/labor were visualized... 92 Figure 4.7 Mean graph for pregnancy and labor by using wMNE/h2 ... 93
12
0
G
ENERAL
I
NTRODUCTION
“Every object that biology studies is a system of systems” (Jacob, 1976). Among the complex system of systems of the human body, many questions remain open concerning the human uterus. How does the uterus exactly work as an organ? How does it remain quiescent during most of pregnancy? And how does it contract in a very organized way during labor to expulse a new human into this world? The answers of all these questions could save the life of more than one billion children who died because they were born too soon.
Giving birth, this miracle of life, can turn to death if preterm birth occurs. Indeed, preterm labor occurs when a woman suffers from complications of her pregnancy and gives birth before the 37th week of gestation. The highest risk of mortality and morbidity is for those infants born at the earliest gestational ages. The birth of a preterm infant can also bring considerable economic costs and has implications for public-sector services, such as health insurance, educational, and other social support systems. The annual societal economic burden associated with preterm birth in the United States was at least $26.2 billion in 2005 (Behrman et al., 2007). However, more days in the uterus can improve the maturation of the fetus. For this reasons, the early detection of a preterm labor is one of the most important keys for its prevention.
One of the most promising biomarkers of uterine contraction is the electrical activity of the uterus. This activity is reflected in the Electrohysterography (EHG), which represents the noninvasive abdominal measurement of the uterine electrical activity (Devedeux et al., 1993). Several studies have already been realized in the context of preterm labor detection by processing EHG (Euliano et al., 2009, 2009; Laforet et al., 2013; Marque and Duchene, 1989; Planes et al., 1984). EHG is one of the few indicators that are measurable and representative of the underlying muscular activity of uterine contractions.
Labor and delivery are preceded by two physiological phenomena: increased excitability and increased connectivity between the myometrial cells, which results in an increase in the propagation of the action potentials that trigger the uterine contractions (Devedeux et al., 1993). Several studies have been realized to characterize the uterine propagation by means of the synchronization between EHG signals recorded at the abdominal surface. These efforts were
13
based on various methods such as i) correlation/connectivity analysis (Euliano et al., 2009; Mahmoud Hassan et al., 2010; Marque and Duchene, 1989) where the methods were applied on the entire uterine burst manually segmented, and ii) propagation velocity quantified by analyzing either the propagation of whole bursts of EHG (Lucovnik et al., 2011) (Mikkelsen et al., 2013), or single spikes identified within bursts (Lucovnik et al., 2011; C. Rabotti et al., 2010)(Lau et al., 2014)(de Lau et al., 2013). The analysis based on spikes (often by using small and close electrodes) would permit to quantify the electrical diffusion process. The one made from whole bursts (with larger and more spaced electrodes) would focus more on the global synchronization of the uterus.
The connectivity analysis gave some promising results when using EHG signals for the identification of statistical coupling between uterine contractions recorded during labor and/or pregnancy. Thus the main objective of this thesis is to develop a new way to study the global synchronization of the uterine electrical activity by computing the connectivity between the recorded EHG signals. Concerning the global analysis (whole burst), in most previous studies, the EHG connectivity matrices were reduced by keeping only their average. Despite the encouraging results obtained, relevant information was missed due to this averaging which may induce the relatively low classification rate reported so far. To characterize precisely connectivity matrices and quantify the global uterine connectivity, we used here the graph theory based analysis. This field has shown a growing interest in the last years, especially to characterize brain networks (Bullmore and Sporns, 2009; Rubinov and Sporns, 2010; van den Heuvel and Sporns, 2013). According to this approach, a connectivity matrix can be represented as graphs consisting of a set of nodes (electrodes) interconnected by edges (connectivity/ correlation values between electrodes).
Two main approaches were used in this thesis i) Compute and quantify the connectivity at the abdomen (electrodes) level and ii) Compute and quantify the connectivity at the uterine source level. The complete pipeline of the thesis work is presented in Figure 0.1.
First, the EHG signals were recorded during pregnancy and labor by using a grid of 4*4 electrodes (Figure 0.1 A). To analyses these signals, we have computed the connectivity between the EHGs and quantified it by using graph theory approach. The processing pipeline includes i)
14
the estimation of the statistical dependencies between the different recorded EHG signals (Figure 0.1 B), ii) the quantification of the obtained connectivity matrices by using a graph theory-based analysis (Figure 0.1 E) and iii) the clinical use of network measures for pregnancy monitoring as well as for the classification of EHG bursts recorded during pregnancy or labor (Figure 0.1 E). A comparison with the existing parameters used in the state of the art for labor detection and preterm labor prediction was also performed.
Figure 0.1 Complete pipeline of the thesis A. EHG recording B. Connectivity at the surface level that uses the EHG signals C. Forward Problem D. Connectivity at the source level that uses the EHG signals and the leadfield matrix estimated from the forward problem. E. Network analysis and its clinical use for pregnancy monitoring as well as for the classification between pregnancy and labor
To overcome the so-called problem of ‘volume conduction’ when computing the connectivity at the abdominal surface level, we have proposed a new method called ‘EHG source connectivity’ (Figure 0.1 C, D). This method consists of reconstructing the time series of the uterine sources associated to given EHGs and then computing the statistical coupling between these sources. As this new method involves mainly two steps and as there is no consensus about the inverse/connectivity method to be used, we analyzed the effect of the algorithm used in the solution of the EHG inverse problem as well as of the method used in the estimation of the
15
functional connectivity by using data simulated by using a model developed in our team (ground truth). As in the connectivity at the surface level, the obtained connectivity matrices at the source level have been be quantified based on the same graph theory analysis (Figure 0.1 E).
The manuscript is organized as follows:
Chapter 1 In this chapter, we present the state of the art of anatomical and physiological background of the uterus and its contractility with its two main factors: cell excitability and propagation of the electrical activity. We also describe the different propagation studies that have been done previously, as well as the main objectives of the thesis and the proposed new approach.
Chapter 2 presents the materials and methods used in this thesis. First we precise the existing methods used to analyze the propagation of the uterine electrical activity. A detailed explanation of our new proposed approach is also presented. For the analysis of the EHG signals, we propose to use a network measure technique based on graph theory. We have also used this new approach for the connectivity at the uterine source level. These methods were applied on simulated and real data. We will also briefly explain the model used for simulating uterine activity as well as the experimental protocol used to record real EHG signals.
Chapter 3 This chapter is dedicated to the results obtained when computing connectivity at the level of the electrodes. We first compared several connectivity methods to compute the connectivity matrix represented as a graph: a set of nodes (electrodes) connected by edges (connectivity values). We then evaluated the performance of different graph measures in the classification of pregnancy and labor contractions. A comparison with the existing parameters used in the state of the art of labor detection and preterm labor prediction is also presented.
Chapter 4 In this chapter, we show the first results obtained when studying the connectivity at the level of the EHG sources. We evaluate the different inverse solutions (to reconstruct the dynamics of uterine sources) and connectivity methods (to compute statistical couplings between reconstructed sources). Networks obtained by each of these combinations are
16
compared to the reference network (ground truth) generated by the model. This approach was also applied to real EHG signals.
A general conclusion and perspectives will finally be presented in chapter 5
A
UTHOR’
S PUBLICATIONJournal Paper
N. Nader, M. Hassan, W. Falou, A. Diab, M. Khalil, C. Marque, « Uterine muscle networks:
Connectivity analysis of the EHG during pregnancy and Labor» in revision (Computers in
Biology and Medicine)
N. Nader, M. Hassan, M. Yochum, S. Zahran, W. Falou, C. Marque, M. Khalil. «
Electrohysterography source networksduring pregnancy and labor» under preparation
International Conference papers
N. Nader, M. Hassan, W. Falou, A. Diab, S. Al-Omar, M. Khalil, et C. Marque, « Classification
of pregnancy and labor contractions using a graph theory based analysis », in 2015 37th Annual
International Conference of the IEEE Engineering in Medicine and Biology Society (EMBC),
Milano, Italy, 2015, p. 2876-2879.
N. Nader, C. Marque, M. Hassan, N. Nader, W. Falou, A. Diab, et M. Khalil, « Pregnancy
monitoring using graph theory based analysis », in 2015 International Conference on Advances
in Biomedical Engineering (ICABME), 2015, p. 73-76.
N. Nader, C. Marque, M. Hassan, N. Nader, W. Falou, A. Diab, et M. Khalil. « A node-wise
analysis of the uterine muscle networks for pregnancy monitoring» in 2016 38th Annual
International Conference of the IEEE Engineering in Medicine and Biology Society (EMBC), in
Florida, USA
Al-Omar, S., Diab, A., Nader, N., Khalil, M., Karlsson, B., Marque, C., 2015. Detecting labor using graph theory on connectivity matrices of uterine EMG. Conf. Proc. Annu. Int. Conf. IEEE
17
Eng. Med. Biol. Soc. IEEE Eng. Med. Biol. Soc. Annu. Conf. 2015, 2195–2198. doi:10.1109/EMBC.2015.7318826
National Conference papers
N. Nader, M. Hassan, M. Khalil, C. Marque, et W. Falou, « From EHG signals to graphs: A new
method for predicting premature birth. », présenté aux Journées RITS 2015, pp 182-183.
N. Nader, M. Hassan, M. Khalil, C. Marque, et W. Falou, « Connectivity Graph: A New Method
18
1.
C
HAPTER
1:
B
ACKGROUND
,
PROBLEM STATEMENT AND PROPOSED
APPROACH
This chapter starts by a definition of the preterm labor problem, which represents the main cause of infant mortality and morbidity. We then briefly describe the anatomical and physiological background of the uterus and the uterine contractility with its two main factors: cell excitability and propagation of the electrical activity. An overview of the different pregnancy monitoring techniques available to record the uterine activity is then reported. Finally, we present an overview of the studies that were reported in the context of analyzing the propagation of the uterine activity. We conclude by the main objective of this thesis and the proposed new approach.
1.1 P
RETERM LABORPreterm birth, which occurs before week 37 of pregnancy, is the major cause of newborn deaths and the second biggest cause of deaths in children under five years old. The premature birth is extremely preterm when it happens before week 28, very preterm between weeks 28 and 32, moderate to late preterm from 32 to 37 weeks (“WHO | Preterm birth,”).
An estimated 15 million babies are born preterm every year which is more than 1 in 10 babies. One million children die each year due to complications of preterm birth with an increasing rate of preterm birth in most countries. Studies in 184 countries reported that the rates of preterm birth across these countries range between 5% and 18%. More than 80% of preterm births occur between 32 and 37 weeks of gestation as shown in Figure 1.1. Preterm newborns are at increased risk of illness, disability and death. Many preterm survivors face a lifetime of disability, including learning disabilities, visual and hearing problems (Blencowe et al., 2013).
The immediate neonatal intensive care incurs large economic costs of preterm birth, including long-term complex health needs (Blencowe et al., 2013). Indeed, the medical, physiological and socioeconomic consequences of preterm labor are important. However, more days in the uterus
19
can improve the maturation of the fetus. For this reasons, the early detection of a preterm labor is one of the most important keys for its prevention.
1.2 U
TERUS ANATOMY AND PHYSIOLOGYAs a dynamic female reproductive organ, the uterus is responsible for several reproductive functions, including menses, implantation, gestation, labor, and delivery (“Uterus Anatomy,” 2015). The uterus, which is a hollow muscular organ, is where the fetus is developing during pregnancy.
Three parts can be differentiated the uterus:
The fundus, which corresponds to the upper portion
The corpus, which is the main part of the uterus including uterine cavity The narrow, which is the lower section and is called the cervix.
The uterus is located above the vagina, midway between the bladder and the rectum. The non-pregnant uterus measures approximately 7.5 cm in length, 4 to 5 cm in width at its upper portion, and 2 to 3 cm in thickness, and it weighs 50 to 70 g (Ellis, 2005) . At term, it measures approximately 32 cm in length, 23 cm in width, and weights about 1000 g, with an inner volume of 4-5 liters, for a mono-fetal pregnancy.
20
The anatomy of the thick uterine wall consists of three tissue layers (Chard, 1994). The inner layer, or endometrium, is the most active layer. This layer responds to cyclic ovarian hormone changes since it consists of glandular cells that produce secretions. This membrane thickens to prepare the uterus for implantation of a fertilized egg. The middle layer, or myometrium, is a muscular layer composed of smooth muscle cells and forms the larger part of the uterine wall. It increases by two procedures: either by hypertrophy of the existing cells, or by multiplication of the cell number. It is well known that the myometrium has an active role during pregnancy. During the last stage of gestation, the smooth cells reach a maximum length of 300 μm and a maximum width of 10 μm (Csapo, 1962). The interaction of myosin and actin filaments produces the contractions of smooth muscle cells. When delivery occurs, the electrical activity generated by the smooth muscle cells, produces rhythmic contractions, which lead to birth.The outer layer of the uterus, the serosa or perimetrium, is a thin layer of tissue made of epithelial cells that envelops the uterus.
In Figure 1.2 we present the anatomy of a pregnant woman uterus. The amniotic sac, a thin-walled sac filled with amniotic fluid is called the amnion. It surrounds the fetus during
21
pregnancy. The placenta only grows during pregnancy and provides a metabolic interchange between the fetus and mother. The umbilical cord connects the fetus to the placenta. The umbilical cord contains two arteries and a vein, which carry oxygen and nutrients to the fetus and waste products away from the fetus (“Stanford Children’s Health” ).
1.3 U
TERINE ELECTRICAL ACTIVITYOne of the most promising markers of uterine contraction is the electrical activity of the uterus. This activity is reflected in the electrohysterogram (EHG), which is a noninvasive abdominal measurement of the uterine electrical activity (Devedeux et al., 1993). Labor and delivery are preceded by two physiological phenomena: increased excitability and increased connectivity between the myometrial cells which results in an increase in the propagation of the action potential that underlie uterine contractions (Devedeux et al., 1993).
1.3.1 Cell excitability
Two types of potential describe the electrical activity of cells: the resting potential and the action potential. The resting potential is the difference between the negative inside and the positive outside of a resting cell. The resting potential is unstable when recording the electrical activity of a membrane. It presents slow waves of low amplitude that describe the electrical base line. The potential difference across the cell membrane reverses, when a cell depolarizes. Then, the trans-membrane potential increases. An action potential is generated when a given threshold is reached. For uterine cells, action potentials are often grouped by bursts. The physiological electrical activity is composed of irregular bursts of action potentials during pregnancy. While term and labor uterine electrical activity is composed of regular bursts composed of regular trains of action potentials (Sanborn, 1995), generated spontaneously. .
1.3.2 Propagation of the uterine electrical activity
The uterus is known as a myogenic organ, therefore the myometrium is able to contract by itself without nervous or hormonal inputs (Shmygol et al., 2007; Wray, 1993). The electrical activity is controlled by changes in the membrane potential of the smooth muscle cell of the myometrium (Kuriyama and Suzuki, 1976; Ohya and Sperelakis, 1989; Wray, 1993).
22
The uterine myometrial cells can either generate their own potential; these cells are called pacemaker cells, or can be excited by the action potential from its neighbor cell; these cells are called pacefollower cells. However, myometrial cells may alternatively be pacemaker or pacefollower cells.
Several studies were recently devoted to understand the propagation phenomena of the uterine electrical activity during pregnancy and labor (Rabotti and Mischi, 2015). Many studies focused on locating the pacemaker area of the uterine muscle during pregnancy and labor. However, uterine pacemakers have been mostly observed to appear randomly throughout the tissue and to change their location during a single contraction or several successive contractions even during labor (Lammers et al., 1994; Marshall, 1959; Parkington et al., 1988).
In addition, myometrial cells are coupled together electrically by gap junctions (Garfield et al., 1977; Devedeux et al., 1993; Garfield and Maner, 2007). These gap junctions are areas where the membranes of two adjacent cells form pores allowing electrical coupling. They form a pathway for the passage of action potentials by forming a low-resistance electrical contact between the cells (Miller et al., 1989) (Garfield et al., 1977). Many studies indicated that during most of pregnancy phases, the cell-to-cell gap junctions are absent or present in very low density
Figure 1.3: The evolution of Gap junction number during gestation, birth and after delivery (Garfield et al., 1977)
23
(Garfield et al., 1977). On the other hand, a large number of gap junctions between myometrial cells is observed during labor (Garfield et al., 1977; Garfield and Hayashi, 1981) ensuring the development of a synchronized muscle activity (Figure 1.3) due to electrical diffusion.
1.4 P
REGNANCY MONITORING AND PRETERM LABOR DETECTIONM
ETHODSDetection and evaluation of the uterine contractions are of major importance. One of the aims of pregnancy monitoring is to differentiate normal pregnancy contractions, which are inefficient to those, efficient, which could cause a dilation of the cervix, thus inducing a premature birth. For this reason, many studies focused on pregnancy monitoring techniques to assess the key risk factors and allow the prediction of preterm labor.
1.4.1 Pregnancy and Labor Monitoring Methods
Typical clinical practice involves the use of different methods.One of the most efficient methods is the use of Intrauterine Pressure (IUP), it provides the best information concerning the contractile state of the uterus (Garfield et al., 2001). A catheter is inserted into the uterine cavity and connected to a pressure sensor, that gives different information on the duration, amplitude and frequency of appearance of the contractions (Garfield et al., 1998a). The main drawback of this method is its invasiveness which can increase the risk of infection and requires rupture of the membranes (Garfield et al., 2001). Obviously, it cannot therefore be used during pregnancy.
Being external and non-invasive, the most widely used device for monitoring uterine contractions during pregnancy is the “Tocodynamometer”. It is used in over 90% of all hospital births. This device is an external pressure measurement device formed by a force sensor placed on the mother’s abdomen, usually over the uterine fundus. This sensor detects changes in abdominal stiffness as an indirect indication of uterine contraction (Garfield et al., 1998a). The main primary advantage of a tocodynamometer is its non-invasiveness which allows the device to be used for most pregnancies without any risk to the fetus or the mother. Nevertheless, the success of this device depends on the subjectivity of the examiner. In addition of being uncomfortable, its main disadvantage is its inaccuracy. Different variables could affect its
24
accuracy such as instrument placement, amount of subcutaneous fat, uterine wall pressure, mother’s motion…. Many other variables could be detected as uterine contractions such as body movements, gastric activity, and other non-labor induced stresses (Garfield et al., 2001). This technique could only permit to detect the number of contractions over a given time interval (usually 10 mm).
Many clinicians prefer to rely on different indicators such as cervical dilation and effacement, vaginal bleeding, or ruptured membranes in order to detect preterm labor. However, since these parameters are subjective and have a high variability within and between observers, this technique has a low predictive value (Creasy, 1993). Other biological tests, such as fibronectin, have been clinically used for the diagnosis of premature births (Iams, 2003), but they have a low predictive value.
A noninvasive technique named light-induced auto fluorescence (LIF) has been also proposed for labor monitoring (Garfield et al., 1998b). This technique attempts to measure cervical tissue changes during gestation and labor. Many studies have proved its capability for estimating the cervical status. Although this technique could provide useful information for preterm labor prediction, it is not used yet in clinical practice.
Another technique used for the labor detection consists of measuring the cervix length via endovaginal ultrasonography. This method gives good predictive values but only after the appearance of symptoms of preterm labor (Romero et al., 1992). Therefore, the success to detect preterm labor is limited when using this technique. Additionally, the measurement of the cervical length using this technique is not reliable because it is influenced by the varying amount of urine in the bladder (Iams, 2003).
The Magnetomyography (MMG) is a noninvasive technique permitting to measure the magnetic fields associated with the uterine action potentials. It is also used for uterine activity recording. MMG recordings of spontaneous uterine activity were recorded for the first time by Eswaran et al. (Escalona-Vargas et al., 2015; Eswaran et al., 2004). This method is presently only used as a research tool due to its high cost and the need of very special (and not easy to set-up) equipment.
25
The electrohysterography (uterine electromyography, EHG) permits to overcome the limitations of the MMG. This method permits to record the uterine activity non invasively, with affordable and simple equipment. The electrohysterography permits to derive quantitative information on the myometrium from the analysis of its electrical activity collected on the mother’s abdomen. EHG consists of the summation of the electrical activity generated by the active uterine muscle cells, plus the noise related to corrupting electrical and mechanical activities. The analysis of the EHG was shown to be one of the most promising tools to monitor the efficiency of uterine contractions during pregnancy (Marque et al., 2007).
EHG signals, recorded externally using electrodes placed on the women’s abdomen, has been demonstrated to be representative of the uterine electrical activity (Devedeux et al., 1993; Mansour et al., 1996). The EHG is composed of two main components, a low wave (which is synchronous to the IUP) and a fast wave. The fast wave is also divided into two frequency components: Fast Wave Low (FWL) and Fast Wave High (FWH). It has been proposed that FWL is related to propagation and FWH is related to excitability of the uterine cells (Gondry et al., 1993) .
According to these results, we can expect that this noninvasive recording of the EHG will provide information not only on the excitability of myometrial cells but also on the propagation of the uterine electrical activity. Therefore, EHG analysis could be used clinically for pregnancy monitoring, labor detection and preterm labor prediction.However,the performance of the EHG analysis depends on the electrodes number as well as on their positions (Rabotti et al., 2008). In the following section we will present the different systems used so far for the uterine electrical activity recordings.
1.4.2 Electrode number and position
Most of the early studies used two to five electrodes to invasively record uterine electrical activity. Therefore they focused mainly on the excitability of the uterus (Schlembach et al., 2009) (M. Hassan et al., 2010).
26
Marque et al. (Marque et al., 2007) used 4 Ag/AgCl electrodes (8 mm diameter spaced by 2.5 cm), forming 2 bipolar leads, to record EHG signals and a reference electrode was positioned on the hip of the patients as shown in Figure 1.4.1. Terrien et al. (Terrien et al., 2006) used four electrodes, a pair positioned in the middle of the median axis near the umbilicus and another one positioned 5cm left of the middle electrode. In order to identify a suitable electrode configuration, Rabotti et al (Rabotti et al., 2008) proposed two measurements for 15 min in labor. They first used 11 active electrodes placed on the abdomen (Figure 1.4.2 a). They measure then the average SNR in each electrode. In this preliminary study, they evidenced the highest
27
average SNR on the lower vertical median line of the abdomen, in particular on the region immediately below the umbilicus. They explained these results by means of two main hypotheses. First, the distance between the recording site, on the skin, and the signal source, in the myometrium, is reduced with respect to the more lateral sites. Second, the position of the uterus relative to the abdominal wall is constant even during contractions, in the region surrounding the umbilicus, which results in a better SNR. According to the results obtained in this preliminary analysis, they used four unipolar contact Ag–AgCl electrodes placed on the abdomen (figured in Figure 1.4.2 b). The common reference for these electrodes was placed on the right hip.
A system containing two bipolar electrode pairs was used in Randomski et al. (Radomski et al., 2008). In addition, they used one Tocographic probe and a reference electrode attached to the left hip (Figure 1.4.3). The distance between the electrodes forming the bipolar channels was fixed at 5 cm. The electrodes were attached in the vertical median axis of the woman’s abdomen because they indicate that this position provides a suitable SNR due to a closer contact and during contractions, more invariant position of the uterus in relation to the abdominal wall (Graczyk et al., 1995).
In other studies, (Baghamoradi et al., 2011; Fele-Zorz et al., 2008; Fergus et al., 2013), authors used 4 AgCl electrodes to record EHG. These electrodes were placed in two horizontal rows, symmetrically under and above the umbilicus, spaced 7 cm apart (Figure 1.4.4). Therefore, three bipolar EHG were obtained in these studies.
Two electrodes placed on the abdominal wall of the women were used in (Terrien et al., 2010). The interelectrode distance was 2.1 cm and they were placed on the uterine median axis, midway between the fundus and the symphysis. They used also a reference electrode placed on the hip of the women.
Four electrodes were used by Lucovnik et al. (Miha Lucovnik, 2010) positioned around the umbilicus in a form of square shape. The distance between each two electrodes vertically and horizontally is fixed at 2.5 cm (measured from center to center) (Figure 1.4.5). For EHG recording they use differential, bipolar electrode pairs.
28
Several studies indicated that this small number of electrodes used was not sufficient for adequate analysis of the propagation in this complex environment represented by the uterine muscle and abdominal anatomy of a pregnant woman (Devedeux et al., 1993; Garfield and Maner, 2007). Therefore, a high number of electrodes is required. In this context, Karlsson et al (Karlsson et al., 2007) proposed a new recording system consisting of a grid of 16 monopolar electrodes (4 x 4) to study the propagation of the uterine electrical activity (Figure 1.4.6). The inter-electrode distance was 2.1 cm. They positioned the grid on the abdomen of the pregnant woman where the third electrode column of the grid is always on the uterine median vertical axis, and the 10-11th electrodes are midway between the symphisis and the uterus fundus. They used also two reference electrodes placed on each of the women’s hip. In order to increase the signal to noise ratio, authors used the vertical bipolar signals (BPi), giving thus a 3 x 4 signal matrix.
Rabotti et al (Chiara Rabotti et al., 2010; C. Rabotti et al., 2010) used a Refa system made of a multichannel amplifier for electrophysiological signals and a grid of 64 (8×8) high density electrodes (1mm diameter, 4 mm spaced). They used this system in order to estimate non-invasively the conduction velocity of the EHG-action potentials (Figure 1.4.7).
Finally, Mikkelsen et al. used three surface electrodes placed abdominally along the median vertical axis (Mikkelsen et al., 2013) (Figure 1.4.8). The inter-electrode distance was of 6.5– 11.2 cm.
1.4.3 Multichannel System for EHG Recording
A high spatial resolution is always needed in order to obtain a precise mapping of underlying electrical activity. In a labor room, the placement of a large number of electrodes for measuring EHG takes time and is difficult to perform. To tackle this problem, from 2007, a collaborative group from France and Iceland, involving biomedical researchers, engineers and medical doctors, created a new design that reduces the inconvenient of multiple electrodes positioning. They defining a standard position (also their size and number) for the recording electrodes. The main goal of this project was to better record and analysis the propagation and the characteristics of the uterine electrical activity during contractions. More details about this protocol will be described in the next chapter.
29
Usually, a single bipolar signal is obtained by subtracting the signals recorded by two close electrodes. The results from a preliminary study showed a very acceptable SNR (signal to noise ratio) on bipolar signals (Alexandersson et al., 2015)
.
On the other hand, this configuration introduces a bias for studying the propagation, as two adjacent bipolar signals can share a same electrode.Therefore, monopolar EHG could be more interesting to get rid of this bias as well as to increase the spatial resolution when processing signals. For this reason, Hassan et al (Hassan et al., 2011) developed a specific denoising method to denoise monopolar EHG. Thus we obtain a correct SNR permitting to study the propagation of the electrical uterine activity from monopolar EHG. This method is based on combination of canonical component analysis (CCA) and on Empirical Mode Decomposition (EMD). In this work, we used this denoising method to obtain noise-free monopolar signals to study the synchronization of uterine activity.
1.5 P
ROPAGATION ANALYSIS OF THEEHG
SIGNALSNumerous studies have shown that the analysis of the propagation of the uterine electrical activity is a powerful tool to characterize and to discriminate pregnancy and labor contractions (Lammers, 2013; Miha Lucovnik, 2010; Rabotti et al., 2009) . This propagation phenomenon can be studied at a micro level when using invasive recordings but also can be studied at the skin level with abdominal electrodes. Some of these studies focused on the propagation pattern or on the velocity of the uterine activity in the uterus during pregnancy and labor. Others studied the propagation phenomenon by looking at the statistical couplings and delays (also called correlation/connectivity) between the different electrodes. In this section we will explain these different approaches.
Propagation pattern
Earlier studies on the propagation of the uterine electrical activity in labor (women or animal) found a predominant downward propagation where the origin of the burst is in the upper/ovarian region of the uterus in women and in the guinea-pig (Lammers et al., 2008; Mikkelsen et al., 2013; Norwitz and Robinson, 2001; Planes et al., 1984; Rabotti et al., 2009). In other studies, on women, upward and multidirectional propagation patterns have been reported (Lange et al.,
30
2014; Mikkelsen et al., 2013; Rabotti et al., 2009), while, a predominant upward direction of the uterine activity was revealed into women who delivered successfully vaginally (Buhimschi, 2009; Euliano et al., 2009).
In addition, many studies based their analysis on single spikes manually identified from the EHG bursts and not on the whole EHG burst. It was proven that the propagation of single spikes is more relevant to the prediction of labor than the analysis of the whole burst (Miha Lucovnik, 2010; Lammers et al., 1994; Lammers, 1997; Melton and Saldivar, 1964; Miller et al., 1989). This propagation of the uterine electrical activity was studied not only on women but also on different species. In (Lammers et al., 1994) authors used a two-dimensional high-density grid in order to study the propagation in an isolated preterm rat myometrium as well as in the intact guinea-pig uterus at term (Lammers et al., 2008). In these studies, authors reported that the propagation of single spikes is unpredictable and can propagate spontaneously in a circular way. Sparse and fractionated spike propagation was reported in the uterus of the guinea pig at term when recorded in the placental insertion area (Lammers et al., 2008). Miller et al (Miller et al., 1989), when studying rat uterine strips, reported a progressive recruitment in the axial direction preterm and not at term. Authors used an array of six extracellular glass-pore surface electrodes (3 mm apart). Other studies were done on the intact uterus of pregnant ewes using pairs of stainless-steel wires sewn into the myometrium of their uterus. They evidenced that individual spikes do not propagate among electrodes when their inter-distance is over 3 cm apart along the longitudinal as well as along the circumferential layer of the myometrium (Parkington et al., 1988).
Another way to analyze the propagation phenomenon is to measure the statistical coupling between recorded signals. This coupling analysis can be associated with the detection of a time delay. Duchene et al. were the first to study the correlation between EHG envelopes recorded at several sites in the uterus of delivering macaques (Duchene et al., 1990). More recently Diab et al. showed that the correlation of the uterine electrical activity spreads to the whole matrix and in all directions but remains more concentrated down, towards the cervix, when approaching labor (Diab, 2014).
31
Other studies focused their analysis on the activity of the uterus on the placental region. Weaker potentials, slower propagations, and a shorter length constant were found in microelectrode recordings in the placental region, in rat myometrium (Kanda and Kuriyama, 1980). Research on the pregnant cat showed that the placental region was less excitable and showed little or no spontaneous activity by using extracellular recordings (Daniel, 1960).
Propagation Velocity
Recently, an increasing number of studies on animals and women evidenced that the propagation of single electrical spikes in the myometrium is linear. This observation permits to measure the propagation velocity (Lammers et al., 1994; Lammers, 1997; Lammers et al., 2008; Miha Lucovnik, 2010; Rabotti and Mischi, 2010) . The propagation velocity of electrical spikes in the uterus was for the first time quantified in (Bozler, 1970) for the guinea-pig, the rabbit and the cat. Later, many studies have focused on the propagation velocity by using different recording methods on different species like guinea-pig (Bozler, 1970), cat (Bozler, 1970; Daniel, 1960), rat (Kanda and Kuriyama, 1980; Miller et al., 1989) and ewe (Parkington et al., 1988) . They reported values of propagation velocity for guinea-pig ranging from 0.1 to 0.3 cm/s (Bozler, 1970), and for the cat, 6 cm/s in (Bozler, 1970), 9-10 cm/s in vivo and 8-12 in vitro in (Daniel, 1960). For the rat, authors in (Kanda and Kuriyama, 1980) obtained values of 6.6 ± 2.2 cm/s (at 7 days gestational age (GA)), 12.3 ± 3.2 cm/s (at 15 days GA), 33.4 ± 4.1 cm/s (at 22 days GA) in non-placental regions; and 1.3 ± 0.4 cm/s (at 15 days GA), 2 ± 0.9 cm/s (at 22 days GA) in placental regions. In (Miller et al., 1989) the values were 9.2 ± 0.6 cm/s (in the longitudinal layers), 2.3 ± 0.7 cm/s (in the circumferential directions) in pregnancy, while the values in labor were 10.5 ± 1.3 cm/s (in the longitudinal layers) and 4 ± 0.8 cm/s (in the circumferential directions).
Also in the intact uterus of pregnant ewes, Parkington et al. found that the propagation velocity in the longitudinal direction significantly increased from pregnancy (7.2 ± 0.3 cm/s) to labor (13.3 ± 0.7 cm/s) (Parkington et al., 1988).
The MMG was also used to determine the uterine contractions propagation velocity (Escalona-Vargas et al., 2015). Results indicated that the propagation was multidirectional and ranged from
32
1.9-3.9 cm/s. Authors in (Wikland and Lindblom, 1985) reported a velocity ranging between 1 and 2 cm/s using biopsies technique of the myometrium. In labor, Wolfs & van Leeuwen (Wolfs and van Leeuwen, 1979) estimated a slightly higher propagation velocity by using intrauterine technique (2.5-5 cm.s-1). Using a two-dimensional flexible grid comprising 64 electrodes, others authors quantified the propagation velocity (PV) by analyzing either the propagation of whole bursts of EHG (Lucovnik, 2010) (Mikkelsen et al., 2013), or single spikes identified within bursts (Lucovnik, 2010)(C. Rabotti et al., 2010)(Lau et al., 2014)(de Lau et al., 2013). These studies reported a speed of 5.30 ± 1.47 cm/s for pregnancy and 8.65 ± 1.90 cm/s for labor.
The combination of PV and peak frequency (PF) reported so far the highest classification rate (96%) to discriminate labor and non-labor contractions (Lucovnik, 2010). On a larger population of pregnant women, much higher figures of PV than the aforementioned studies have been reported in (Lucovnik, 2010). In these studies, authors used only two couples of standard bipolar surface electrodes.
Mikkelsen et al. (Mikkelsen et al., 2013) used three electrodes placed on the median vertical axis of the abdomen and used as reference the center of mass of the EHG burst envelop for the calculation of the interchannel delay. By analyzing separately, the upper and the lower uterine segments, authors found average values equal to 2.15 and 1.53 cm/s respectively, with a variability between 0.66 and 13.8 cm/s and between 0.58 and 6.7 cm/s for the upper and lower uterine segment respectively (Mikkelsen et al., 2013). Recently, Lange et al. used two-dimensional electrode grids of 16-channels for the EHG recordings. The estimated average propagation velocity was 2.18 (±0.68) cm/s for 35 contractions (Lange et al., 2014).
None of the above reported studies is clinically used so far. Thus, advanced techniques for analyzing the propagation of the EHG are required. In the next section, we show that more recent studies used the correlation/connectivity between EHG signals as a new feature to analyze the propagation phenomenon.
Connectivity/Correlation
Studying the correlation/coupling between signals recorded from different channels is not new. It is widely used for EEG signals. This approach has been reported in different studies based on human or animal EHG recordings. Indeed, looking at the connectivity at the electrode level could
33
provide important information on the synchronization of the uterine activity. Marque et al. have used the linear correlation coefficient (r2) and noticed more correlation in low than in high frequencies (Marque, 1987). Duchêne et al. used autocorrelation, cepstrum and deconvolution function in order to study the uterine EMG propagation (Duchene et al., 1990). Their results show that no linear propagation can be evidenced from all developed methods.
The linear inter-correlation has been also used for EHG propagation analysis by Karlsson et al. (Karlsson et al., 2007). They used 16 electrodes for the EHG recording. They present both an animation of the evolution of the electric potential, as well as a temporal correlation presentation and they observed complex activation patterns.
Mansour et al. used the inter-correlation function to analyze the propagation of the internal uterine EMG of a monkey using four internal electrodes (Mansour et al., 1996). The signals were first filtered into FWL and FWH frequency bands. Their results indicate that the correlation during labor is higher for FWL than for FWH.
Other studies used the nonlinear correlation coefficient to estimate the relationships between 16 EHG signals recorded by a matrix of 4x4 electrodes placed on the woman’s abdomen (Hassan et al., 2010) (Hassan et al., 2013; Muszynski et al., 2012). Authors showed a significant difference between pregnancy and labor contractions (Hassan et al., 2013) as well as an increase in the correlation of EHGs as labor approaches (Muszynski et al., 2012).
Very recently, a comparative study was performed between several correlation measures applied to EHG signals (Diab et al., 2014). Authors used the nonlinear correlation coefficient (h2), General synchronization (H) and the Granger causality (GC). Authors tested the sensitivity of these methods to some characteristics of the signal (nonstationarity, frequency content) or of the recording protocol (bipolar or monopolar recording), in order to improve the performance of the coupling detection methods for the classification of EHG bursts recorded during pregnancy and labor. They processed EHG signals recorded from 48 women during pregnancy (174 contractions) and labor (115 contractions), with a 16 electrode matrix (4x4). The h2 coefficient did not demonstrate any monotonic increase from pregnancy to labor. Therefore, authors tried to improve the performance of this method. They retained only the low frequency band of the EHG (FWL), which is supposed to be more related to the propagation of EHG, and proposed a