HAL Id: hal-01031799
https://hal.archives-ouvertes.fr/hal-01031799
Submitted on 17 Jan 2016
HAL is a multi-disciplinary open access
archive for the deposit and dissemination of sci-entific research documents, whether they are pub-lished or not. The documents may come from teaching and research institutions in France or abroad, or from public or private research centers.
L’archive ouverte pluridisciplinaire HAL, est destinée au dépôt et à la diffusion de documents scientifiques de niveau recherche, publiés ou non, émanant des établissements d’enseignement et de recherche français ou étrangers, des laboratoires publics ou privés.
Growth stresses and cellulose structural parameters in
tension and normal wood from three tropical rainforest
angiosperm species
Julien Ruelle, Yamamoto Hiroyuki, Bernard Thibaut
To cite this version:
Julien Ruelle, Yamamoto Hiroyuki, Bernard Thibaut. Growth stresses and cellulose structural pa-rameters in tension and normal wood from three tropical rainforest angiosperm species. Bioresources, North Carolina State University, 2007, 2 (2), pp.235-251. �hal-01031799�
PEER-REVIEWED ARTICLE ncsu.edu/
bioresources
GROWTH STRESSES AND CELLULOSE STRUCTURAL
PARAMETERS IN TENSION AND NORMAL WOOD FROM THREE
TROPICAL RAINFOREST ANGIOSPERMS SPECIES
Julien Ruelle,a, b* Hiroyuki Yamamoto,b and Bernard Thibaut a
Few studies have been conducted about relation between cellulose para-meters and biomechanical properties of wood in tropical angiosperms species. For this purpose, on 13 trees from 3 species of French Guyana tropical rainforest in a clear active process of restoring verticality, i) growth strains were measured in situ in order to determine the occurrence of tension wood within samples and ii) cellulose structural parameters were estimated on all the samples using X-ray diffraction method. Crystallite size was estimated from the full-width at half-maximum of the Miller index (002) arc diffraction and angle T was measured following Cave’s method. Relationships between these parameters and growth stresses were good and the variations between normal and tension wood were significant, i.e. a lower angle T and a larger crystallite size in tension wood. In order to have a good estimation of the microfibril angle in the main layer of the secondary wall for each species, an experimental calibration was done between angle T and microfibril angle observed with scanning electron microscopy.
Keywords: Cellulose, Microfibril angle, Crystallite size, Tension wood, Tropical rainforest, Growth stresses
Contact information: a: UMR EcoFoG, Campus agronomique - BP 709, 97387 Kourou cedex, Guyane Française, b:School of Bioagricultural Sciences, Nagoya University, Chikusa,
Nagoya 464-8601, Japan; *Corresponding author: ruelle_j@kourou.cirad.fr
INTRODUCTION
In order to restore verticality, trees are able to bend their trunk by the formation of a highly stressed wood, called reaction wood, producing a biomechanical dissymmetry between the upper and lower side of the axis. In gymnosperms the wood of the lower side of the axis is highly compressed and is called compression wood. On the contrary angio-sperms will produce a highly tensile-stressed wood on the upper side called tension wood (Archer 1986). Reaction wood is generally associated with marked changes in anatomical structure. Compression wood shows rounder cells, intercellular spaces and cracks in the cell wall (Dadswell and Wardrop 1949). Tension wood is characterised in some species by the occurrence of fibres with a particular morphology and chemical composition due to the development of the so-called gelatinous layer (G-layer). This layer is essentially made up of strongly crystalline cellulose with a very low microfibril angle.
In both strategies a parameter involved in this biomechanical state is the geometry and structure of cellulose, one of wood’s main constituents. Orientation of the micro-fibrils of cellulose in the main layer of the secondary wall of wood cell plays an
impor-PEER-REVIEWED ARTICLE ncsu.edu/
bioresources
al. 1998) and also strongly affects many wood properties as longitudinal modulus of elasticity or longitudinal shrinkage (Barnett 2004; Washusen et al. 2001). Other cellulose structural parameters vary from normal to reaction wood; Andersson et al. (2003) and Washusen and Evans (2001) showed a variation of cellulose crystallite size respectively in compression wood of Picea abies and tension wood of Eucalyptus globulus.
Few studies have been done on tropical species so that, in this work, we try to highlight relationships between some cellulose structural parameters, i.e. microfibril angle and crystallite size measured by X-ray diffraction method, and growth stresses in 13 trees among 3 species from French Guyana tropical rainforest. X-ray diffraction method allows a rapid assessment of wood microstructure, but in the case of microfibril angle estimation a calibration is needed between the angle T, a parameter from X-ray diffractogram defined by Cave (1966), and microfibril angle (MFA) observed with optical techniques. Meylan (1967) made an empirical calibration on Pinus radiata using Cave’s method and Yamamoto et al. (1993) made the same on two gymnosperms and two angiosperms species whose normal wood shows thin fibre cell walls and tension wood does not show G-layer. In this study we decided to make a calibration for the three studied species in order to see if the existing calibration could provide a good estimation for microfibril angle in tropical species with G-layer and/or with thick fibre cell walls. EXPERIMENTAL
Plant Material
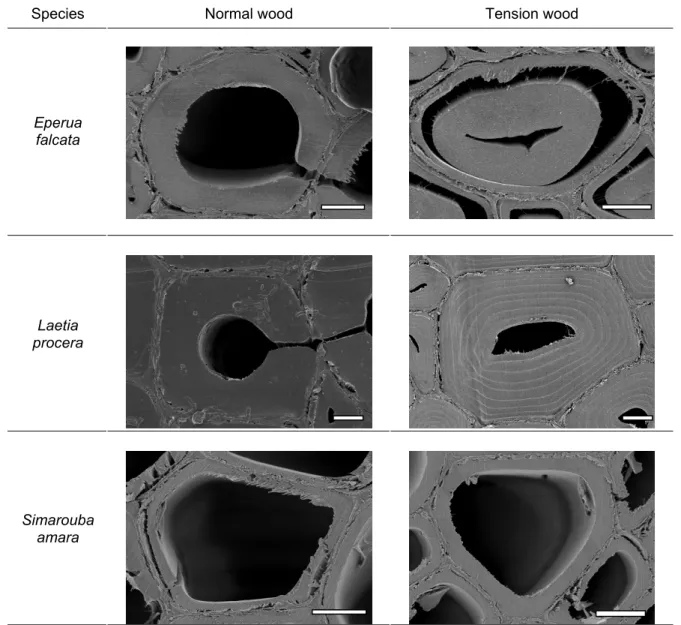
Three species in the tropical rainforest distributed in three families (Table 1) were selected. This selection was based on the anatomical aspect of tension wood observed from previous experiments (Fig. 1), in order to study various types of tension wood: − Eperua falcata Aublet for tension wood with G layer,
− Laetia procera (Poepp.) Eichler for the multilayered feature in tension wood, − Simarouba amara Aublet for the lack of difference in normal vs. tension wood. Table 1. List of Trees Studied and their Diameter at Breast Height
Family Genus species Trees Diameter at Breast Height (cm)
Ef 1 21.96
Ef 2 24.19
Caesalpinaceae Eperua falcata Aublet
Ef 3 22.60
Lp1 19.10 Lp2 22.92 Lp3 28.33 Lp4 21.80 Flacourtiaceae Laetia procera (Poepp.) Eichler
Lp5 26.42 Sa1 23.87 Sa2 25.78 Sa3 16.87 Sa4 27.00 Simaroubaceae Simarouba amara Aublet
PEER-REVIEWED ARTICLE ncsu.edu/
bioresources
Trees were selected in the same zone in French Guyana, near Kourou. Trees diameter at breast height ranged between 16.8 and 40 cm (Table 1). All the trees were in a clear active process of restoring verticality after some accidental inclination. This was verified in situ by mechanical measurement of growth strains (GS) by the “single hole” method (Almeras et al. 2005; Fournier et al. 1994). This method gives the value of the displacement between two pins hammered onto the trunk (after local debarking) at a 45 mm distance from each other. A hole (20 mm depth and 20 mm diameter) is drilled at the mid-point between the two pins. A displacement is measured (in µm) and converted into a strain (in %) using a calibration factor: 9.6×10⁻⁴ corresponding to a calibration made on
Eperua Falcata (Fournier et al. 1994). Eight measures (every 45°) were realised at breast
height on each tree, Position 1 corresponding to the upper side of the leaning trunk.
Species Normal wood Tension wood
Eperua falcata Laetia procera Simarouba amara
Fig. 1. Cross section of normal wood (on the left) and tension wood (on the right) of the three species studied observed with Scanning Electronic Microscopy. Bars, 5 µm
PEER-REVIEWED ARTICLE ncsu.edu/
bioresources
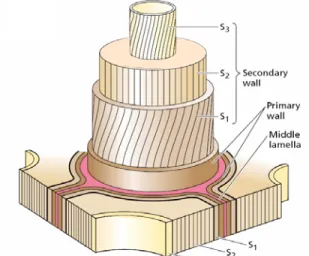
Normal wood of the three species has a typical secondary wall as shown in Fig. 2. Tension wood from Simarouba amara and Laetia procera has a S3 layer in the
secondary wall.
Fig. 2. Diagram of the cell wall organization often found in cells with thick secondary wall (Taiz and Zeiger 2002)
Two wood samples were taken, as close as possible to the GS measurement zone, above and below the hole. Observations were made on both samples to ensure the homogeneity of the studied wood above and below the GS measurement zone (Fig. 3).
Fig. 3. Localization of specimen used for the experiments
GS position measurements
Position of samples used for the study
Hole resulting from the GS measurement method
PEER-REVIEWED ARTICLE ncsu.edu/
bioresources
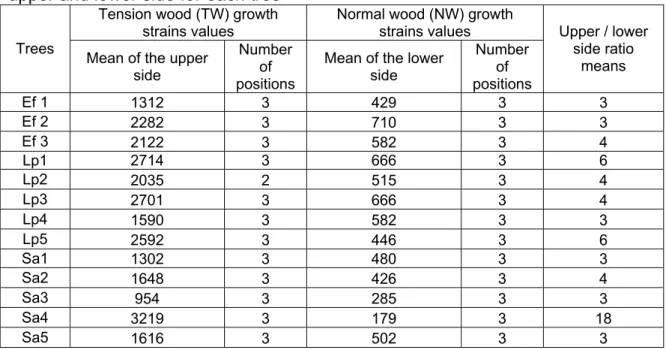
Measurements show clearly that wood layers on the upper side exhibited a very much higher tensile stress than in all other places (Table 2) including lower side, which does not present significant difference in mechanical stressing with side places. Upper wood positions with very high growth strains are called tension wood in the next paragraphs, while all other locations are named normal wood.
Table 2. Growth Strains (X 10-6) mean value and number of positions used for
upper and lower side for each tree
Tension wood (TW) growth strains values
Normal wood (NW) growth strains values Trees Mean of the upper
side
Number of positions
Mean of the lower side Number of positions Upper / lower side ratio means Ef 1 1312 3 429 3 3 Ef 2 2282 3 710 3 3 Ef 3 2122 3 582 3 4 Lp1 2714 3 666 3 6 Lp2 2035 2 515 3 4 Lp3 2701 3 666 3 4 Lp4 1590 3 582 3 3 Lp5 2592 3 446 3 6 Sa1 1302 3 480 3 3 Sa2 1648 3 426 3 4 Sa3 954 3 285 3 3 Sa4 3219 3 179 3 18 Sa5 1616 3 502 3 3
From the data reported by Archer (1986) and from more recent studies (Clair et al. 2006; Yoshida et al. 2002), these growth strains values in tension wood are in the high range of reported values.
Method Used for Cellulose Structural Parameters Measurement
MFA estimation with X-ray diffraction method
Measurements were made using an X-ray diffractometer (Shimadzu XD-D1w)
under the following conditions. A point-focused X-ray beam (Cu-Kα X-ray, beam
diameter 1 mm) was applied to tangential sections: 1 mm thick x 15 mm long. An X-ray diffraction apparatus with a symmetrical transmission mode was used. The scattered X-ray was detected by a Na-I scintillation counter behind a receiving slit of width and length of 1 mm x 1 mm. Each sample was rotated around its normal axis at a rotation speed of six degrees per minute in a position of 2θ = 22.4 degrees and the diffraction intensity was recorded on a chart at a speed of 2 cm per minute.
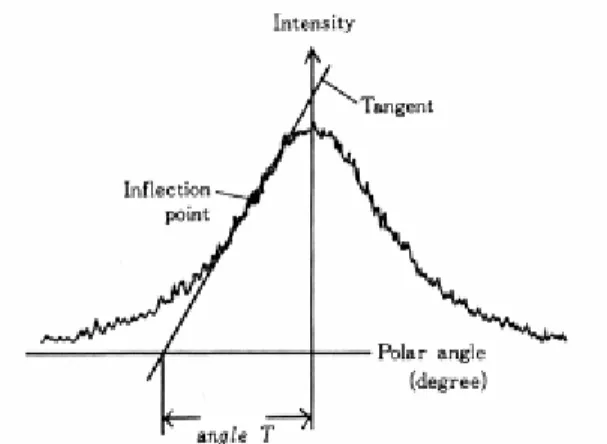
As show in Fig. 4 angle T was obtained from the diffraction intensity around (002) arc (Cave 1966). Cave’s (1966) (Eq. 1) and Yamamoto’s (1993) (Eq. 2) formula gives an estimation of the mean MFA using this angle T:
PEER-REVIEWED ARTICLE ncsu.edu/
bioresources
T MFA = 0.6 (1) 19 . 36 693 . 4 ² 10 431 . 1 10 575 . 1 3 3 − 1 + − = x − T x − T T MFA (2)Fig. 4. Measurement procedure of angle T from a (002) arc diffraction
Crystallite size estimation with X-ray diffraction method
Measurements were made with the reflection technique using an X-ray diffractometer (Shimadzu XD-D1w) under the following conditions. The incident X-ray radiation was from the Cu Kα band (λ= 0.154nm) with a power of 35kV and 35mA passed through a Ni filter and collimated by a slit of 0.1 degree. The wood samples were fixed in a sample holder so that the fibre axis was vertical. The diffraction intensity for (200) was registered in the angular range from 10 to 40 degrees.
The crystallite size in the direction perpendicular to the 002 crystal plane was calculated using the Scherrer equation (Washusen and Evans 2001):
θ
λ
cos
9
.
0
H
L
=
(3)where L is the crystallite size (in nm) perpendicular to the plane; λ is X-ray wavelength;
H is the full-width at half-maximum (FWFM) in radian; and θ is the Bragg angle.
A Kolmogorov-Smirnov test was performed to compare crystallite size and angle
T value between tension and normal wood.
Microfibril angle measurement with Field-Emission Scanning Electron Microscopy (FE-SEM)
Many techniques exist for the direct observation of MFA in wood. During previous experiments we tried to observe MFA in tropical species by use of the iodine crystal technique (Senft and Bendtsen 1985), but only few results were obtained on
Simarouba amara. This fact may be linked to the thickness of the wall fibre; Simarouba amara is the only thin-walled tropical species we studied in these previous experiments.
PEER-REVIEWED ARTICLE ncsu.edu/
bioresources
thick-walled species, so that we choose to directly observe MFA with Field-Emission Scanning Electron Microscopy (FE-SEM).
Observations were made in axial planes. Sample geometry was 5×1×7 mm3
(R×T×L). Samples were dehydrated through a graded ethanol series and then processed using the t-butyl alcohol freeze-drying method. In order to observe the cellulose fibrils of some layers, a lignin extraction treatment (NaClO2 0.6%, CH3COOH 0.13% in distilled
water during 40 hours) (Wise et al. 1946) was performed on longitudinal sections. The dried samples were mounted on aluminium stubs and lightly sputter-coated with platinum. Samples were observed by FE-SEM (Hitachi, S-4500) at an accelerating voltage of 3 kV.
Microfibril angle (MFA) measurements were made from direct longitudinal observations by FE-SEM on samples from various trees. The choice of samples used for this measurement was based on the results from X-ray diffraction method results, in order to scan a wide range of angle T value in each species (Fig. 9). We had to look at samples where the S3 layer was removed during sample preparation in order to observe microfibril
angle from the S2 layer or the G-layer. As the direct observation of MFA is very tedious
we had to take a limited number of samples. These measurements were made on about 20 fibrils per picture. Images used for this measurement are shown in Fig. 5.
Fig. 5. Example of images used for the measurements of microfibril angle on tension wood (a) and normal wood (b) of Laetia procera. Bars, 500 nm
RESULTS AND DISCUSSION
Growth Strains and Cellulose Structural Parameters
Results from crystallite size measurement show that the crystallite size was larger in tension wood sample (p<0.001) (Fig. 6). The relationship between growth stress and crystallite size (Fig. 7) shows that both parameters increased in the same way, even though the tendency is less clear for Eperua falcata. This variation observed for Eperua
falcata is mainly due to the large value of crystallite size observed in sample showing
low growth strain values. These samples correspond to lateral wood, located between the lower and the upper side of the trunk. They could actually contain both tension and normal wood, which can explain the discrepancy between growth strain values and crystallite size.
PEER-REVIEWED ARTICLE ncsu.edu/
bioresources
The means for crystallite size were 3.31 nm and 2.65 nm for tension and normal wood, respectively (Fig. 6). Washusen and Evans (2001) also highlight wider crystallite size in the tension wood of Eucalyptus globulus Labill. Jahan and Mun (2005) showed an increasing of crystallite size on Trema orientalis wood samples after a selective removal of lignin and hemicelluloses. Tension wood is known to contain less lignin and a different content of hemicelluloses compared to normal wood (Timell 1967). Thus we can observe from literature and our results that the evolution of cellulose crystallite size usually goes with a modification of the matrix composition. This fact was already observed (Fahlen and Salmen 2003), and authors hypothesized that this evolution of crystallite size was due to a modification of the interaction existing between cellulose microfibrils and components of the matrix. But this variation remains unexplained, and we would consider a modification at the level of cellulose biosynthesis to explain it.
Fig. 6A. Box-and-whisker plots of crystallite size values of each kind of wood for each studied tree Ef1 Tension wood Normal wood Type of wood 2,0 2,1 2,2 2,3 2,4 2,5 2,6 crystallite size (nm) Ef2 Tension wood Normal wood Type of wood 1,6 1,8 2,0 2,2 2,4 2,6 2,8 3,0 3,2 3,4 3,6 3,8 4,0 4,2 4,4 crystallite size (nm) Ef3 Tension wood Normal wood Type of wood 2,0 2,5 3,0 3,5 4,0 4,5 5,0 5,5 crystallite size (nm)
PEER-REVIEWED ARTICLE ncsu.edu/
bioresources
Fig. 6B. Box-and-whisker plots of crystallite size values of each kind of wood for each studied tree
Fig. 6C. Box-and-whisker plots of crystallite size values of each kind of wood for each studied
Lp1 Lp2 Lp3 Lp4 Lp5 Tension wood Normal wood Type of wood 2,4 2,6 2,8 3,0 3,2 3,4 3,6 3,8 4,0 4,2 4,4 crystallite size (nm) Tension wood Normal wood Type of wood 2,2 2,4 2,6 2,8 3,0 3,2 3,4 3,6 3,8 4,0 4,2 crystallite size (nm) Tension wood Normal wood Type of wood 2,4 2,6 2,8 3,0 3,2 3,4 3,6 3,8 4,0 4,2 crystallite size (nm) Tension wood Normal wood Type of wood 2,0 2,2 2,4 2,6 2,8 3,0 3,2 3,4 3,6 crystallite size (nm) Tension wood Normal wood Type of wood 2,2 2,4 2,6 2,8 3,0 3,2 3,4 3,6 3,8 4,0 4,2 crystallite size (nm)
Sa1 Sa2 Sa3 Sa4 Sa5
Tension wood Normal wood Type of wood 2,2 2,3 2,4 2,5 2,6 2,7 2,8 2,9 crystallite size (nm) Tension wood Normal wood Type of wood 1,9 2,0 2,1 2,2 2,3 2,4 2,5 2,6 2,7 cr ystallite size ( nm) Tension wood Normal wood Type of wood 2,10 2,15 2,20 2,25 2,30 2,35 2,40 2,45 2,50 2,55 cr ys ta llite s iz e (n m) Tension wood Normal wood Type of wood 2,4 2,6 2,8 3,0 3,2 3,4 3,6 cr ys ta llite s iz e (n m) Tension wood Normal wood Type of wood 2,4 2,5 2,6 2,7 2,8 2,9 3,0 3,1 cr ys ta llite s iz e (n m)
PEER-REVIEWED ARTICLE ncsu.edu/
bioresources
-500 0 500 1000 1500 2000 2500 3000 3500 4000 1 1,5 2 2,5 3 3,5 4 4,5 5 5,5 Crystallite size (nm) GS (x10 -6 )Fig. 7. Relationship between growth strains (x10-6)and crystallite size (nm). ; Eperua falcata, ; Laetia procera, ; Simarouba amara
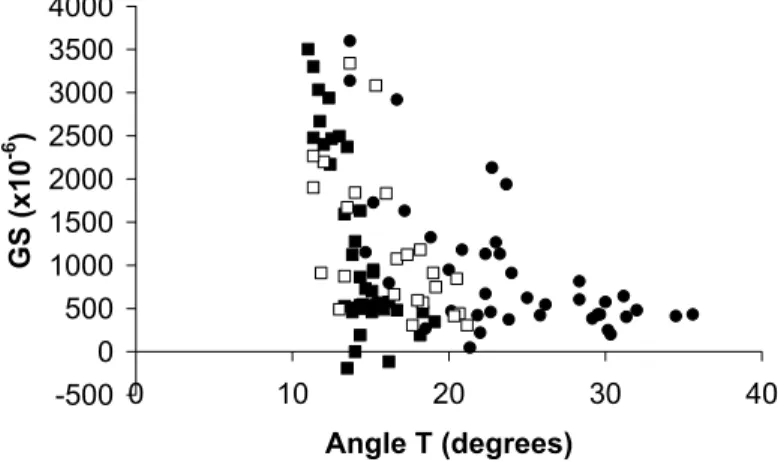
Usually the angle T is used to estimate average MFA in wood (Abasolo et al. 2000; Cave 1966; Lofty et al. 1973; Yamamoto et al. 1993). In this study we checked the relationship between this parameter and the growth stress measured on samples (Fig. 8). The observed relationship was good, i.e. r² = 0.5178 for Eperua falcata, 0.7011 for Laetia
procera and 0.4697 for Simarouba amara. The general tendency, i.e. a decreasing of
angle T in high tensile stress wood, was the same for the three studied species.
-500 0 500 1000 1500 2000 2500 3000 3500 4000 0 10 20 30 40 Angle T (degrees) GS (x10 -6 )
Fig. 8. Relationship between growth strains (x10-6)and angle T values (degrees).
; Eperua falcata, ; Laetia procera, ; Simarouba amara
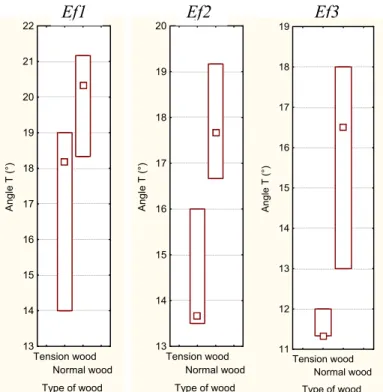
At an interspecific level the mean values of angle T were 15.85° and 19.91° in tension and normal wood, respectively, showing that angle T was lower in tension wood samples (p<0.001). The value range for angle T (Fig. 9) in Eperua falcata and Laetia
procera were very similar, with a minimum close to 11° and a maximum close to 20°. In Simarouba amara the range was larger than in other species, starting at about 14° and
with a maximum at about 35°. The main difference that exists between the two first species and Simarouba amara is the density, directly linked with the cell wall thickness.
PEER-REVIEWED ARTICLE ncsu.edu/
bioresources
Without a true calibration of angle T value with average MFA we cannot tell if these differences between species reflect MFA variation.
Fig. 9A. Box-and-whisker plots of angle T values of each kind of wood for each studied tree
Fig. 9B. Box-and-whisker plots of angle T values of each kind of wood for each studied tree
Tension wood Normal wood Type of wood 10 11 12 13 14 15 16 17 18 19 20 Angle T ( °) Tension wood Normal wood Type of wood 11 12 13 14 15 16 17 Angle T ( °) Tension wood Normal wood Type of wood 11,5 12,0 12,5 13,0 13,5 14,0 14,5 15,0 15,5 Angle T ( °) Tension wood Normal wood Type of wood 13,4 13,6 13,8 14,0 14,2 14,4 14,6 14,8 15,0 15,2 Angle T ( °) Tension wood Normal wood Type of wood 11 12 13 14 15 16 17 18 19 Angle T ( °) Lp1 Lp2 Lp3 Lp4 Lp5 Tension wood Normal wood Type of wood 13 14 15 16 17 18 19 20 21 22 Angle T (°) Tension wood Normal wood Type of wood 13 14 15 16 17 18 19 20 Angle T (°)
Ef1 Ef2 Ef3
Tension wood Normal wood Type of wood 11 12 13 14 15 16 17 18 19 Angle T (°)
PEER-REVIEWED ARTICLE ncsu.edu/
bioresources
Fig. 9C. Box-and-whisker plots of angle T values of each kind of wood for each studied tree
Relationship between Angle T and Direct Observation of MFA
Fig. 10 shows the relationships between angle T and MFA measured with SEM observations for each species. Representations of Cave’s (Eq. 1) and Yamamoto’s formula (Eq. 2) are represented in order to make a comparison between these various calibrations.
First of all we see that relationships between angle T and directly observed MFA were very good for every studied species. This fact shows that the X-ray method is a really efficient tool to estimate MFA in wood, as long as a calibration is available for the interpretation of the (002) peak diffraction pattern. Observation of results in Fig. 10 and Fig. 11 indicates that the range of values for MFA is almost the same for all the species. This point leads us to think that thickness of cell wall has, with cell wall shape (Sarén and Serimaa 2005), a strong influence on results from X-ray diffraction method. Such influence can be seen in the relationships between angle T and directly observed MFA in thick-walled species, which deviate from thin-walled species and from Cave’s findings. Cave assumed that the state of cellulose crystal is invariable when MFA changes; we observed that cellulose crystallite size varies from tension to normal wood. This also explains the observed deviation from Cave’s relationships for all the species.
The real aim of this calibration was not to estimate more accurately the average MFA of the sample, but to find a relation between the MFA of the main layer of the secondary wall of samples, considered by many authors as a critical factor in the mechanical behaviour of wood (Barnett 2004; Megraw et al. 1998) and the criteria given by the application of Cave’s method i.e. angle T.
Tension wood Normal wood Type of wood 16 18 20 22 24 26 28 30 Angl e T ( °) Tension wood Normal wood Type of wood 22 24 26 28 30 32 34 36 38 Angl e T ( °) Tension wood Normal wood Type of wood 20 22 24 26 28 30 32 Angl e T ( °) Tension wood Normal wood Type of wood 13 14 15 16 17 18 19 20 21 22 23 Angl e T ( °) Tension wood Normal wood Type of wood 14 16 18 20 22 24 26 28 30 32 34 Angl e T ( °)
PEER-REVIEWED ARTICLE ncsu.edu/
bioresources
y = 3,4224x - 37,882 R2 = 0,9783 y = 2,2777x - 21,116 R2 = 0,9094 y = 0,9317x - 8,8146 R2 = 0,95440
5
10
15
20
25
30
0
10
20
30
40
50
Angle T (degrees)
MFA (degr
ees)
Fig. 10. Relationships between MFA measured with SEM observations and angle T from X-ray diffraction method. ; Eperua falcata, ; Laetia procera, ; Simarouba amara. Light gray line is
Cave’s formula (Eq. 1) and dashed curve is Yamamoto’s formula (Eq. 2)
-500 0 500 1000 1500 2000 2500 3000 3500 4000 0 10 20 30 40 AMF (degrees) GS I ( x 1 0 -6 )
Fig 11. Relationship between growth strains (x10-6)and angle T values (degrees).
PEER-REVIEWED ARTICLE ncsu.edu/
bioresources
Fig. 11A. Box-and-whisker plots of MFA values of each kind of wood for each studied tree
Fig. 11B. Box-and-whisker plots of MFA values of each kind of wood for each studied tree
Tension wood Normal wood Type of wood 2 4 6 8 10 12 14 16 18 20 22 MFA ( °) Tension wood Normal wood Type of wood 4 6 8 10 12 14 16 MFA (°) Tension wood Normal wood Type of wood 6 7 8 9 10 11 12 13 14 15 MFA ( °) Tension wood Normal wood Type of wood 10,0 10,5 11,0 11,5 12,0 12,5 13,0 13,5 14,0 MFA ( °) Tension wood Normal wood Type of wood 4 6 8 10 12 14 16 18 20 22 MFA ( °) Lp1 Lp2 Lp3 Lp4 Lp5 Tension wood Normal wood Type of wood 6 8 10 12 14 16 18 20 22 24 26 28 30 32 34 36 MFA ( °) Tension wood Normal wood Type of wood 6 8 10 12 14 16 18 20 22 24 26 28 30 MFA ( °) Tension wood Normal wood Type of wood 0 2 4 6 8 10 12 14 16 18 20 22 24 26 MFA ( °)
PEER-REVIEWED ARTICLE ncsu.edu/
bioresources
Fig. 11C. Box-and-whisker plots of MFA values of each kind of wood for each studied tree
It follows from these results that MFA estimation of Simarouba amara by means of Cave’s and particularly Yamamoto’s formula is not so far from the present observations. Yamamoto’s formula was calculated in order to estimate MFA from X-ray diffraction method for a wide range of angle T values, in softwood species and hardwood species with thin-walled fibres and with tension wood that does not show gelatinous layer. This explains the good approximation of Simarouba amara MFA.
CONCLUSIONS
1. The cellulose structural parameters estimated during this work show good relationships with growth stresses: cellulose crystallite size increases in tension wood while angle T, which shows a strong relationship with directly observed MFA, decreases. The modification of the state of cellulose in the cell wall of fibres is a key for the explanation of growth stress generation, but the phenomena leading to these modifications still remains unclear. An important step in the understanding of the impact of cellulose structure variation on properties is the collection of data from various species and various kind of wood. This work was dedicated to this first step of understanding.
2. X-ray diffraction can provide lot of information on wood ultrastructure. The relationship between angle T and directly observed MFA was very good but a
Sa1 Sa2 Sa3 Sa4 Sa5
Tension wood Normal wood Type of wood 8 10 12 14 16 18 20 MFA (°) Tension wood Normal wood Type of wood 8 10 12 14 16 18 20 22 24 26 MFA ( °) Tension wood Normal wood Type of wood 11 12 13 14 15 16 17 18 19 20 21 MFA ( °) Tension wood Normal wood Type of wood 3 4 5 6 7 8 9 10 11 12 13 MFA (°) Tension wood Normal wood Type of wood 4 6 8 10 12 14 16 18 20 22 MFA ( °)
PEER-REVIEWED ARTICLE ncsu.edu/
bioresources
the mean MFA of the main layer of the secondary wall. The deviations from Cave’s (Eq. 1) and Yamamoto’s (Eq. 2) formula observed for these species confirm the influence of cell wall geometry on X-ray diffraction measurements. Many authors discussed the influence of the method used and cell shape on X-ray diffraction results, but from an empirical point of view, a study devoted to calibration for many hardwood species would provide a useful tool for the analysis of cellulose microfibril orientation influence on growth stress generation.
REFERENCES CITED
Abasolo, W. P., Yoshida, M., Yamamoto, H., and Okuyama, T. (2000). "Microfibril angle determination of Rattan fibers and its influence on the properties of the Cane," Holzforschung 54(4), 437-442.
Almeras, T., Thibaut, A., and Gril, J. (2005). "Effect of circumferential heterogeneity of wood maturation strain, modulus of elasticity and radial growth on the regulation of stem orientation in trees," Trees 19, 457-467.
Andersson, S., Serimaa, R., Paakkari, T., Saranpää, P., and Pesonen, E. (2003). "Crystallinity of wood and the size of cellulose crystallites in Norway spruce (Picea abies)," J. Wood Science 49, 531-537.
Archer, R. R. (1986). Growth stresses and strains in trees, Springer-Verlag, Berlin Heidelberg New-York.
Barnett, J. R. (2004). "Cellulose microfibril angle in the cell wall of wood fibres," Biol.
Rev. 79, 461-472.
Cave, I. D. (1966). "Theory of X-Ray measurement of microfibril angle in wood," Forest
Products J. 16(10), 37-42.
Clair, B., Ruelle, J., Beauchêne, J., Prevost, M. F., and Fournier, M. (2006). "Tension wood and opposite wood in 21 tropical rainforest species. 1. About the presence of G layer," IAWA J. 27(3), 329-338.
Dadswell, H. E., and Wardrop, A. B. (1949). "What is reaction wood?" Australian
Forestry 13(1), 22-33.
Fahlen, J., and Salmen, L. (2003). "Cross-sectional structure of the secondary wall of wood fibers as affected by processing," J. Mater. Sci. 38, 119-126.
Fournier, M., Chanson, B., Thibaut, B., and Guitard, D. (1994). "Mesure des
déformations résiduelles de croissance à la surface des arbres, en relation avec leur morphologie. Observation sur différentes espèces," Ann. Sci. For. 51(3), 249-266.
Jahan, M. S., and Mun, S. P. (2005). "Effect of tree age on the cellulose structure of Nalita wood (Trema orientalis)," Wood Science and Technology 39, 367-373. Lofty, M., El-osta, M., Kellog, M., Foschi, R. O., and Butters, R. G. (1973). "A direct
X-ray technique for measuring microfibril angle," Wood and Fiber 5, 118-127. Megraw, R. A., Leaf, G., and Bremer, D. (1998). "Longitudinal shrinkage and microfibril
angle in Loblolly pine," In Microfibril Angle in Wood: Proceedings of the
PEER-REVIEWED ARTICLE ncsu.edu/
bioresources
Wood Quality (ed. B. G. Butterfield), Westport, N.Z. University of Canterbury Press, Canterbury, N.Z., 27-61.
Meylan, B. A. (1967). "Measurement of microfibril angle by X-ray diffraction," Forest
Products J. 17, 51-58.
Sarén, M. P., and Serimaa, R. (2005). "Determination of microfibril angle distribution by X-ray diffraction," Wood Science and Technology, Online.
Senft, J. F., and Bendtsen, B. A. (1985). "Measuring microfibrillar angles using light microscopy," Wood and Fiber science 17(4), 564-567.
Taiz, L., and Zeiger, E. (2002). Plant Physiology, Third Edition, Sinauer Associates. Timell, T. E. (1967). "Recent Progress in the Chemistry of Wood Hemicelluloses," Wood
Sci. Technol. 1, 45-70.
Washusen, R., Ades, P., Evans, R., Ilic, J., and Vinden, P. (2001). "Relationships between density, shrinkage, extractives content and microfibril angle in tension wood from three provenances of 10-year-old Eucalyptus globulus Labill,"
Holzforschung 55(2), 176-182.
Washusen, R., and Evans, R. (2001). "The association between cellulose crystallite width and tension wood occurrence in Eucalyptus globulus," IAWA J. 22(3), 235-243. Wise, L. E., Murphy, M., and D'Addieco, A. A. (1946). "Chlorite holocellulose, its
fractionation and bearing on summative wood analysis and on studies on the hemicelluloses," Paper Trade J. 122(2), 35-43.
Yamamoto, H. (1998). "Generation mechanism of growth stresses in wood cell walls : roles of lignin deposition and cellulose microfibril during cell wall maturation,"
Wood Sci. Technol. 22(1).
Yamamoto, H., Okuyama, T., and Yoshida, M. (1993). "Method of determining the mean microfibril angle of wood over a wide range by the improved Cave's method,"
Mokuzai Gakkaishi 39, 118-125.
Yamamoto, H., Okuyama, T., and Yoshida, M. (1998). "Growth stress generation and microfibril angle in reaction wood," Microfibril Angle in Wood. The proceedings
of the IAWA / IUFRO international workshop on the Significance of microfibril angle to wood quality, 225-239.
Yoshida, M., Ohta, H., Yamamoto, H., and Okuyama, T. (2002). "Tensile growth stress and lignin distribution in the cell walls of yellow poplar, Liriodendron tulipifera Linn," Trees 16, 457-464.
Article submitted: January 18, 2007; First round of reviewing completed: March 4, 2007; Revised version received: May 1, 2007; Accepted: May 2, 2007; Published: May 4, 2007