AN APPROACH FOR DEVELOPING A PRELIMINARY COST ESTIMATING METHODOLOGY FOR USCG VESSELS
by
MARK JAMES GRAY
BaSC Mech. MaSC Mech.
Eng., University of
(1978)Eng., University of
(1980) Water 1oo Water 1ooSUBMITTED TO THE DEPARTMENT OF OCEAN ENGINEERING
IN PARTIAL FULFILLMENT OF THE REQUIREMENTS FOR THE DEGREE OF
MASTER OF SCIENCE
IN
NAVAL ARCHITECTURE AND MARINE ENGINEERING
at the
MASSACHUSETTS INSTITUTE OF TECHNOLOGY
June 1987
0
Mark J. Gray, 1987The author hereby grants to M.I.T. and to the U.S. Government permission tc reproduce and to distribute publicly copies of this thesis document in whole or in part.
Signature of Author:
Departmen f Ocean Engineering
May 8, 1987
Certified
by:-Ceifi -- e d . Henry S. Marcus.
Associate Professor, Marine Systems Thesis Supervisor
Accepted byl---___+__
A
e
yDouglas
Carmicheal
Chairman, Ocean Engino ring Departmental Committee I r
AN APPROACH FOR DEVELOPING A PRELIMINARY COST ESTIMATING METHODOLOGY FOR USCG VESSELS
by
MARK JAMES GRAY
Submitted to the Department of Ocean Engineering
on May 8, 1987 in partial fulfillment of the
requirements for the Degree of Master of Science in Naval Architecture and Marine Engineering
ABSTRACT
A study was done on methods used to estimate new ship
construction costs during the feasibility/preliminary design phase. Costs were functionally related to SWBS weight groups and design and fabrication complexities. Other factors affecting shipyard construction costs include inflation, production learning and scheduling.
Cost estimating relationships (CERs) are derived from historical data and are normalized to reflect technical cost trends in ship construction. The accuracy of the CERs is dependent upon the
quality and range of the data. Cost risk or uncertainty can be
quantified provided the probability distributions of the input data and CER regression coefficients are known.
Five cost models are examined and found to be quite similar in their approach. Differences can be attributed to the different needs of the organizations that support their use. The models are applicable to a wide range of ship types and displacements,
depending upon the data available during their development. Cost estimates during the feasibility design phase are thought to be
accurate to within 10-20% of actual costs.
In order for cost analysis to have a measurable impact during ship design, costing must be an integral part of the decision-making process. Before this can occur, management must have
confidence in the costing team's ability to produce high quality
esti mates.
Thesis Supervisors Dr. Henry S. Marcus
Title: Associate Professor of Marine Systems
ACKNOWLEDGEMENTS
I would like to express my appreciation to the many people who assisted me in this research endeavor.
Thanks to my thesis advisor, Professor Henry Marcus, not only for his guidance and direction, but also for allowing me the freedom
to explore and learn on my own.
Special thanks to Dennis Clark, Mike Jeffers and Bob Jones of the Costing and Design Systems Office, Code 1204 at David Taylor
Naval Ship Research and Development Center (DTNSRDC), for their support and invaluable assistance in the research and for sharing with me their philisophical understanding of cost engineering in particular, and life in general.
The assistance of Jim Herd, Tzee-Nan Lo and especially Ron
Schnepper in the Ships Cost Analysis Division, NCA-2 at the Naval Center for Cost Analysis was greatly appreciated. Thanks also to Mike Hammes and Bob Simpson in the Cost Estimating & Analysis Division, SEA 017 at the Naval Sea Systems Command. These people gave freely of their time and effort during this study and
supplied invaluable information.
Several individuals in the United States Coast Guard deserve special mention. Thanks to Lt John Tuttle, Office of Acquisition and Lt Shawn Smith, Office of Research & Development for their continuing interest in this work, and to Richard Rounsevell of the Planning and Estimating Section in the Office of Engineering for his helpful suggestions.
To all the people who spent the time talking and explaining the seemingly infinite aspects o cost estimating to me, thank you
all. I hope that I have managed to include all of the useful insights that were given to me.
I have saved my final note of appreciation and thanks for my wife Louise, who provided endless encouragement and love throughout this study.
This thesis work was funded by the Office of Research & Development of the United States Coast Guard.
TABLE OF CONTENTS A MT I _A rl w I I ACKNI TABLI LIST LIST CHAP' CHAPI WLEDGEMENTS . ... . ... a E OF CONTENTS ... ... OF FIGURES ... .... ... OF TABLES ... ... TER 1 - INTRODUCTION
.
.
...1. 1 SHIP DESIGN PROCESS ... 1.2 SWBS WEIGHT GROUPS ... 1.3 ESTI MATE QUAL ITY ... ...
1.4 EARLY SHIP DEFINITION ... 1.4.1 Effect of Design & Construction Standards
1.4.2 Incorporating New Technology ...
1.5 SHIP PROGRAM COSTS .. ... 1.5.1 Reporting Ship Costs . ... TER 2 - OVERVIEW OF SHIP COST ESTIMATING ...
2.1 ESTIMATING BASIC CONSTRUCTION COSTS ... 2.1.1 General ... 2.1.2 Should Cost versus Actual Cost ... 2.1.3 Learning Rate ... ..
2.1.4 Scheduling ... ... 2.1.5 Inflation and Escalation ...
2.1.5.1 Calculating ROM Escalation ... 2.2 CER DEVELOPMENT ... .. 2.2. 1 Reliability of CERs ... 4 Page 2 3 4 8 1I 14 20 24 27
30
34 35 36 40 43 47 47 51 53 58 62 68 70 74 . . . . . . . . . . . . . . . . I. .TABLE OF CONTENTS Page 2.3 RISK ANALYSIS ... 2.3.1 General ... 2.3.2 Analytical Methods ... 2.3.2.1 2.3. 2.3. 2.3. 2.3. 2.3.2.2
Cost Element Probability
Distribution Functions ... 2.1.1 Beta FDFs ... 2.1.2 Gaussian PDFs ... 2. 1. Triangular PDFs ... 2.1.4 Uniform PDFs ... Method of Moments ...
2.3.3 Monte Carlo Methods ... CHAPTER 3 - DESCRIPTION OF SPECIFIC SHIP COST MODELS ...
3.1 ACQUISITION & LIFE--CYCLE COST ESTIMATING ...
3.1.1 NAVSEA Code (:017 Cost Model ...
3.1. 1.1
3.1.1.2 3.1.1.3 3.1.1.4
General ... Cost Estimating Relationships ...
Input Information ...
Output Information ...
3.1.2 NCA Cost Model ...
3.1.2.1 General ...
3.1.2.2 Cost Estimating Relationships ... 3.1.2.2.1 One-Digit Model ... 3.1.2.2.2 Two-Digit Model ... 3.1.2.3 Input Information ... 3.1.2.4 Output Information ... 3.1.3 ASSET Cost Model ...
90 93 96 96 99 99 103 105 1C07 107 1 07 11 C) 130 132 137 137 139 141 146 153 155 156
3.
1.3.1
General
...
3.1.3.2 Cost Estimating Relationshi 3.1.3.3 Input Information ... 3. 1.3.4 Output Information ... * . . . . melm...
ps ...
... m.. * . . . . . . . .. . .3.1.4 USCG Cost Model ... 3.1.4.1
3.1.4.2 3.1.4.3
3.1.4.4
General
...
Cost Estimating Relationships ...
Input Information ... Output Information ... 5 82 90 156 161 183 189 194 194 196 21 0 213
TABLE OF CONTENTS
Page
216 3.1.5 RCA PRICE Hardware Model ...
3.1.5.1 General ... 216
3.1.5.2 Cost Estimating Relationships ... 219
3.1.5.3 Input Information ... 233
3.1.5.4 Output Information ... 234
3.1.6 Other Cost Models ... 238
3.1.6.1 FAST-E ... .. 238
3.1.6.2 Merchant Ship Cost Models . 239 3.1.6.3 Private Contractor Models ... 240
3.2 COST MODEL COMPARISONS ... 241
3.2.1 General Model Characteristics ... 241
3.2.2 Range of pplicability ... 243
3.2.2.1 Vessel Type and Displacement ... 243
3.2.2.2 Ship Design Phase ... 245
3.2.3 Model Input/Output Comparisons ... 246
3.2.3.1 Minimum Input Requirements ... 247
3.2.3.2 Cost Output Sensitivities ... 252
3.2.3.2.1 Marginal Cost Factors ... 252
3.2.3. 2.2 Program Cost Factors ... 254
3.2.3.3 Cost Output Accuracy ... 254
CHAPTER 4 - DEVELOPING A SHIP COST ESTIMATING CAPABILITY .... 259
4. 1 COST MODEL DEVELOPMENT ... 262
4.1.1 Data Gathering .... ... 264
4. 1.1.1 Establishing User Needs ... 267
4.1.2 Resource Requirements ... 270
4.1.3 Organizational Considerations ... 271
4.2 COST MODEL SELECTION ... 274
CHAPTER 5 - CONCLUSIONS AND RECOMMENDATIONS ... 276
5.1 CONCLUSIONS ... ... 276
TABLE OF CONTENTS
5.2 RECOMMENDATIONS ...
5.2.1 General Recommendations ... 5.2.2 USCG Recommendations ...
ENCES
...
IDIX A - SWBS WEIGHT GROUP KEYS FOR COSTED
MILITARY PAYLOAD ...
IDIX B - ASSET KN FACTORS ... IDIX C - COST ESTIMATING SURVEY ... DIX D - SWBS GROUP BREAKDOWN FOR THE
NCA TWO-DIGIT COST MODEL ... ... DIX E - ANVCE SHIP SAMPLE AND SWBS GROUP CERS ...
Page 281 282 284 287
292
294 304 309 320 APPENDIX F - PRICE H INPUT GLOSSARY AND DATA SHEET... 332
7 REFER AFFEN APPEN AF'PEN APPEN APPEN
LIST OF FIGURES
Figure No. Title F'age
1.1 Cost Impact of Decisions during
a Design Process 16
1.2 Cost Savings versus Cumulative
Program Costs 17
1.3 The Ship Design Process 22
1.4 Exploratory Cost Model Levels and
Their Purpose 23
1.5 SWBS Group Descriptions 25
1.6 Typical NAVSEA Ship Acquisition
Time Line 29
1.7 Systems Influence on Ship Design 33
1.8 Representative Life Cycle Cost
Time Line 37
1.9 Inflation Rates 41
2.1 Weight Based Unit Production Prices 49
2.2 Unit and Cumulative Learning Curves 55
2.3 Disruption of the Learning Curve 57
2.4 Schedule Length versus Optimum
Program Cost 59
2.5 Program Cost Comparisons 61
2.6 BLS Shipbuilding Composite Index 63
2.7 Cumulative Manpower Curves 65
2.8 CER Development Methodology 71
2.9 Confidence Interval about a
Regression Line 8C)
2.10 The General Cost Risk nalysis pproach 83
Figure No. 2.11 2.12 2.13 2.14 2.15 2.16 2.17 2.18 3.1
3.2
3.3
3.4 3.53.6
3.73.8
3.9
3.10
LIST OF FIGURES TitleUncertainty Measures Using Probability Density and Cumulative Density Functions Cumulative Density Functions for
Dependent and Independent Input Variables The Normalized Beta Probability
Density Function
Shape Variations using Beta PDFs The Gaussian Probability Density Function
The Triangular Probability Density Function
Additive Moments for Method of Moment Calculations
Decrease in Variance Error with Increasing Run Size for Monte Carlo Methods
Acquisition Review Milestones, Technical Definition and Cost Estimate Quality
Categories of a Total End Cost Estimate
Shipbuilding Inflation Factors for 1980
SIW Total Ship Labor Factors for 1980
One-Digit Propulsion Systems Material Cost ASSET Applicability Within the Ship
Design Process
ASSET Computational Modules
ASSET Cost Module Calculative Sequence ASSET Life Cycle Cost Elements
Basis of USCG
Material Cost to Non-Cost
Relationship
9 Page 89 94 95 98 1 )2 104 1 09 111 140 142 143 157 158 162 168 197Figure No. 3.11 3.12 3. 13 3.14 3. 15 3.16 3.17 3.18 4. 1
4.2
4.3 4.4 5. 1 LIST OF FIGURES TitlePRICE Parametric Modeling Systems Typical MCPLXS Factors for Mechanical
Assembl i es
MCFLXS Factors for Selected USN Vessels Effect of Technology Improvement on Costs
Influence of Schedule on Costs The PRICE Calibration Process FPRICE H Ship Calibration Data
Frigates & Destroyer MCPLXS vs PSTART Trend
Cost Estimating Functions for the
Ship Design Process
Factors Affecting the Cost Database and
Cost FPredictions
BehaviouLral Information Processing Model Point Estimate with Cost Reserve
F'robab 1 i ty
Cost Estimating Building Blocks
1 C) F age 217 222 224 225 226 228 230 231 261 265 268 273 278
Tabl e No. 1. 1 1.2 1. 1.4 1.5
1.6
1.7
1.8
2. 12.2
2.3
2.4
2.5
2.6
2.7 2.82.9
3.13.2
3.3
LIST OF TABLES TitleExample of Increasing Level of
Technical Definition
SWBS One-Digit Weight Groups
Examples of Increasing SWBS Level of
Technical Definition
NAVSEA Ship Cost Estimate Classifications Common Cost Driver Classifications
Minimum Lead Ship Construction Cost Data Minimum O&S Cost Data
Navy Frigate Life Cycle Cost Breakdown Cost Estimating Methodologies
BLS Material Index Breakdown
SWBS Group Escalation Weighting Factors ROM Escalation Factors
Percentage of Basic Construction Cost Percentage Deviation for SWBS Group CERs Percentage Deviation for Total Ship
Construction Costs
Relationship between Confidence Internal and Standard Deviation for a Gaussian
Distri bution
Comparison of FDF Characteristics Percentages to Calculate Program Manager Cost Reserve
VAMOSC-Ships Cost Categories NAVSEA Code 017 Ship Acquisition Cost Parameters 11 F'age 21 24 26 27 30 52 32 38 44 66 67 69 75 77 78 87 91 12 3 128 1 (:)
Table No. 3.4 3.54 3.6 3.7 3.8 3.9 3.10 3.11 3.12 3.13 3.14 3.15 3.16 3.17 3.18 3.19 3.20 3.21 35.22 3.23 LIST OF TABLES Title
NAVSEA Code 017 Fleet Escalation/Discounted Cost Parameters
NAVSEA Code 017 SWBS Output Summary NAVSEA Code 017 P-8 Output Summary
NCA Cost Model Ship Database
One-Digit SWES Group Cost Drivers
Two-Digit Cost Model Structure Two-Digit Cost Model Cost Drivers
Percentage
Distribution
of Lightship Weight
for Two-Digit Model Groups
NCA Lead Ship Shipyard Cost Parameters
NCA Lead Ship Output Summary ASSET Cost Module Ship Database
NAVSEA
Program
Cost
Percentages
Operations & Support Data for Selected USN Ships
ASSET USN Ship Construction Escalation
Index>es
ASSET Sailaway Ship Cost Parameters ASSET Life Cycle Cost Parameters ASSET Parameter Default Values ASSET Ship Sailaway Output Summary ASSET Life Cycle Cost Output
Follow Ship Reduction in Total Labor Manhours 12
Page
132 133 136 138 145 147 148 151 153 155 160 166 174 182 183 185 187 189 191 205LIST OF TABLES Table No. 3,.24
3.25
3.26
3.27
3.28
3.293.30
3.31 3.32 5. 233 3.34 3.363.37
3.38
3. 39 4. 14.2
4.3 TitleUSCG Cost Model Categories
USCG Ship Acquisition Cost Parameters USCG Fleet Escalation/Discounted
Cost Parameters
USCG Ship Output Summary
PRICE H Cost Output Categories
Fundamental Cost Drivers in the PRICE H Model
PRICE H Development & Production Cost Parameters
Description of PRICE H Cost Elements Relating PRICE and SWBS-based Ship Costs
Cost Model Vessel Applicability
Representative Lead Ship Construction Cost Parameters
Representative Multi-Ship Construction Cost Parameters
Representative Life-Cycle Cost Parameters
Naval Surface Combatant Marginal Cost Factors
Labor/Program Cost Sensitivity Material/Program Cost Sensitivity
Organizational Cost Estimating Functions Criteria for Parametric Contract Pricing Cost Model User Features
13 Page 208 210 212 213 219 220 233 235 236 244 248 249 251 253 255 256 260 262 269
CHAPTER 1
INTRODUCTION
For years, ship design managers had to worry mainly about answering one question; "How will the system perform?" More
recently,
due to the imposition
of budgetary constraints
within
government agencies, managers must also ask another question;
"How much will it cost?"
This increasing concern with system acquisition costs led to
the implementation of design-to-cost (DTC) policies in the early
1970s (e.g., see Ref. 45). DTC required the early establishment of realistic cost goals and a continuing effort to maintain them throughout the design and production period. This type of design strategy has led to the expanded use of synthesis models for cost and performance trade-offs and has put more emphasis on early definition of the complete ship system.
Synthesis models (e.g., the US Navy's ASSET program) make it
possible to qLuantify any particular capability or figur-e of merit, and assess the technical and cost impacts of its effect on
the ship's systems. The figure
of
merit provides a measure of
how well -the ship accomplishes its mission (e.g., military effectiveness). The iterative nature of trade-off studies using synthesis models allows a design to evolve which maximizes (or minimizes for a cost figure of merit) the figure of merit based
upon the ship's design and subject to technical, schedule and
funding constraints.
The importance of establishing a credible cost estimating capability early in the design phase cannot be overlooked. Figure
1.1 gives a qualitative indication of the cost impact of
decisions throughout a generic acquisition process. It is important to note the major impact of decisions in the planning
(i.e., feasibility/conceptual) phase (e.g., see Ref. 3). The
trend indicates that the maximum leverage for costs occurs during the early design phases. Therefore, the ability to perform a large number of performance/system versus cost trade-offs during this early design stage will greatly assist in minimizing cost uncertainty during later design phases.
The advantages of incorporating performance/system versus cost trade-offs for the USN's DDG 51 is documented in Ref. 5. The approach was described as a closed loop feedback control process involving the review of the design for conformance to an established budget, and then making decisions to change the design in the areas where the budget constraints were exceeded.
Cost analysis during early design is in the enviable position of applying maximum effect for minimal cost (relative to
the total program cost). The inverse effect for cost impact
versus cumulative program cost is illustrated in Fig. 1.2. The relationship is particularly applicable to the introduction of advanced technologies into ship design. The greatest savings result from the introduction of innovations early in the development program. Attempts to incorporate innovation at later phases, when the design is committed to alternative technologies, can become prohibitively expensive.
t
4 COST IMPACT OF DECISION NUMBER OF DECISIONt
4 IPLANNINGOTOOLINO PHASE O(SIGN HiASE
---- TIME
Cost Impact of Decisions during a Design Process
(Ref. 60)
Figure 1.1
MANUFACIURINQ
CL COST
($)
Cost Savings versus Cumulative Program Costs
(Ref. 15)
Figure 1.2
Having established that potential cost savings are a primary motivation for early ship design definition, it follows that the timely and credible estimation of ship costs during this early stage would help to: "reduce ship acquisition and life cycle operating costs; analyze cost drivers and technologies impact on cost drivers, and; improve the naval engineering awareness of cost early in the ship design process" (Ref. 26).
The
purpose
of this study is twofold; to document the
techniques used to cost ships during these early design phases, and; to address the major areas involved with the establishment of cost estimating capabilities. Although these topics are listed sequentially, there is a high degree of interrelationship between costing techniques and the needs and resources of an organization that influence its costing requirements.
The first step in this study is to describe a frame of
reference for the different levels of cost estimating quality
that are used, the technical detail that is commensurate with
each level, and where in the ship design process these different estimate qualities can be found.
Ship costing is a multi-faceted discipl ine, involving overlapping aspects of engineering, economics, business management, statistics and human resources. The aim of Chapter 2 is to provide a general understanding of the ship costing field
and its terminology. The development of cost estimating
relationships and their ncertainty, crucial to early stage
estimating,
is
discussed in some
detail.
A description of specific cost estimating techniques can be
found in Chapter 3. The methodologies from five models used by 18
various US Navy agencies and the US Coast Guard are included. The amount of information presented is dependent upon the documentation available in the open literature or volunteered.
A fairly qualitative comparison of the models was dictated by the proprietary nature of the material. Current ship cost estimating models typically relate ship weights to cost as a
function of technology level.
The previous chapters have concentrated on the technical aspects of cost estimating. Chapter 4 examines the management and human resources factors that must be considered before the technical cost estimating capability can be integrated within the organizational operating environment. As with any corporate
entity, a cost analysis group must receive support from all
levels of management if it is to contribute effectively.
The final chapter presents the conclusions and recommendations of the study. Any discussion of osting must address the effects of the following areas on the credibility of the estimates received. These are: (1) the experience of the cost engineering group; (2) the development of appropriate
cost-estimating algorithms, and ; (3) the range and applicability of
the database.
The all-encompassing recommendation for implementing a cost
estimating capability within any organization is that of
maintaining a long-term commitment to its operation; primarily in the areas of personnel levels, training standards and data collection functions.
1.1 SHIP DESIGN PROCESS
There are three principal divisions in the NAVSEA (Naval Sea Systems Command) ship design process;
(1) exploratory design (2) acquisition design (3) service life design
Since this study deals with early stage new ship cost estimating, only the exploratory and acquisition design phases are of concern. The four acquisition phases are feasibility studies, preliminary design, contract design and detail design.
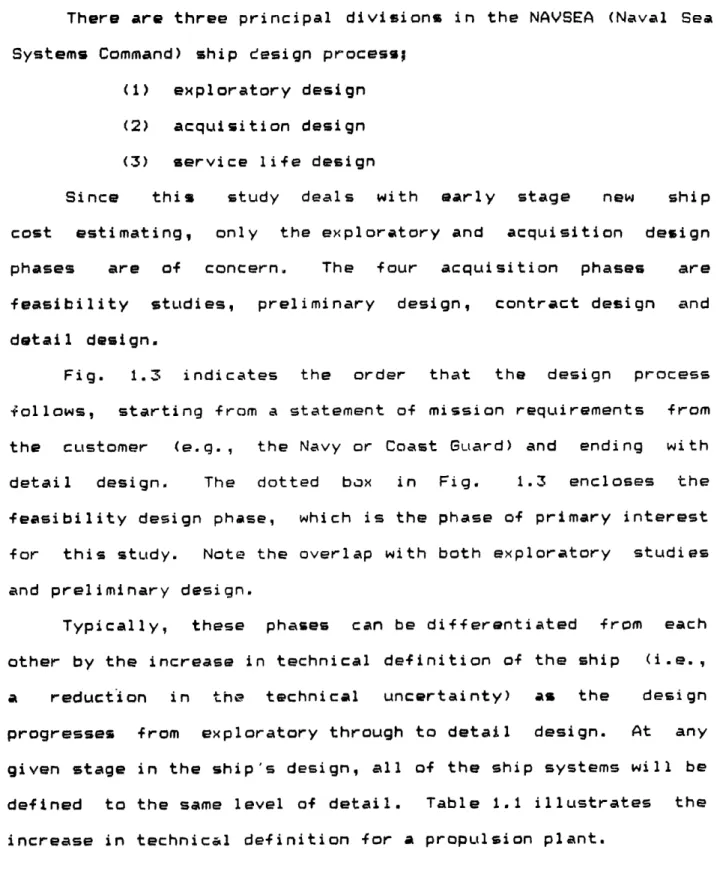
Fig. 1.3 indicates the order that the design process
Sollows, starting from a statement of mission requirements from
the customer (e.g., the Navy or Coast Gard) and ending with detail design. The dotted box in Fig. 1.3 encloses the
feasibility design phase, which is the phase of primary interest for this study. Note the overlap with both exploratory studies and preliminary design.
Typically, these phases can be differentiated from each other by the increase in technical definition of the ship (i.e.,
a
reduction
in the technical
uncertainty)
as the design
progresses from exploratory through to detail design. At any given stage in the ship's design, all of the ship systems will be defined to the same level of detail. Table 1.1 illustrates the
increase in technical definition for a propulsion plant.
Level Technical Definition
0 Whole Ship
I
Propulsion
Plant
2
Propulsion Units
3 Gas Turbines
4 Engine Starter System
5
Engine Starter
Example of Increasing Level of Technical Definition
(Ref. 26) Table 1.1
In an R&D environment, the technical definition
can increase
to
a
level
commensurate
with detail design and yet the ship will
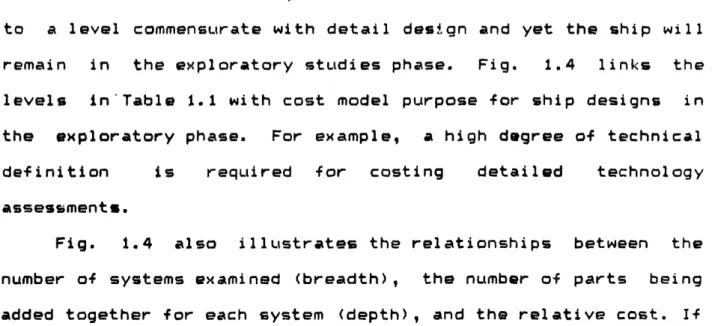
remain in the exploratory studies phase. Fig.
1.4 links
the
levels in'Table 1.1 with
cost
model purpose for ship designs in
the exploratory phase. For example, a high degree of technical
definition
is
required for costing
detailed
technology
assessments.
Fig.
1.4
also
illustrates
the relationships
between the
number of systems examined (breadth),
the number of parts
being
added together for each system
(depth),
and the relative cost. If
MISSION REQUIREMENTS i EXPLORATORY STUDIES I I FEASIBILITY STUDIES I I I I I I I I I-I CONTRACT DESIGN I DETAIL DESIGN
The Ship Design Process (Ref. 60)
Figure 1.3
22 I 1 - II I I I H I I - b - -_ -_ I _ -L ! i i I - IIBREADTH . . , am ~ -'-- ' LEVEL I ASSESSMENT <$10K LEVEL II ASSESSMENT <$100K
Exploratory Cost Model Levels and Their Purpose (Ref. 26)
Figure 1.4
23
MODEL SWBS
LEVEL LEVEL COST MODEL PURPOSE
*0 WHOLE SHIP EAR LIEST-STAGE, CONCEPT DEVELOPMENT; PROGRAM COSTS, SCHEDULING EFFECTS
1 ONE-DIGIT PROGRAM MANAGERS, RESOURCE (GROUP) APPLICATION AND APPORTIONING
2 TWO-DIGIT
(SUB-GROUP)
I
3 THREE-DIGIT DESIGN ANALYSIS, TECHNOLOGY ASSESSMENT, (ELEMENT) INTEGRATION ANALYSIS, ALTERNATIVE
SYSTEMS ANALYSIS * · LE' ASSE c D E P T H
the definition is at the whole ship level, only one system with one part needs to be considered and the cost analysis is inexpensive. As the number o systems increases (e.g. hul l, propulsion, electrical, etcr.) the breadth decreases, and as the parts that each system i broken down into increases the depth
(and the cost of analysis) increases.
1.2 SWBS WEIGHT GROUPS
The Ship Work Breakdown Structure (SWBS) provides a common
means of communicating the level of technical definition between
the ship designer, shipyard and cost estimator. The major elements of the SWBS system that are of interest for ship costing are listed in Table 1.2. Examples of some of the items that make
SWBS Group Description 100 Hul 1 Structure
200
Propulsion Plant
300
Electric Plant
400 Command Surveillance500
Auxiliary Systems
600
Outfit
&
Furnishings
700 Armament
800
Design &
Engineering Services
900
Construction Services
SWBS One-Digit Weight Groups
Table 1.2
SWBS Group Descriptions (Ref. 54)
Figure 1.5
25
Groop Oescriptlon Def inition
I mull structure Shell plating or planklng; lonIqtudnl ad transverse fraingql Innerbttu plating; platform ard flats belao lowrist continus deck; fourth dieck; third deck; secod deck; main deck or harar dck forecastle de (irclrdlng platform, flats, and deckS between min arid gallery deck); gallery decl flight deck; ladin platform ad pecial purpoe decks Drve weather deck (includes catapult traugh)l superstructucas foldationsr for min propelling
dchineryl fo.vdations for auxiliarles and other ilpmsnt! structural blUade trunks ad enclosures; tructural spnsors; aror; aircraft fuel saddle tank structure; structural costing, forgings, and quivalent wldents; s chests; ballast nd buoyancy units; doors nd closures, qscial purpose; doos, hatches, maholes, rd scuttles nronballistic; doors htches, mnoles, arid scuttles, ballistic; ests ad king posts; omprtm nt tsting.
2 Propusion Boilers ad energy converters; propulsion units; main condea rs ad air eectorsl shafting, bearilngs, ad propellers; cibustion air supply system; uptakes and Mke pipes; propulsion ontrol qulpment; main stem systma feeduater md cwxensate systm; circulating and cooling water ystem; fuel oil service systa; lue oil systma.
3 Electric plant Electric pr ge ration; per distrlbution switchbords; p distrlbtion systms (cable)j lighting syst -distribution ad fixtures.
4 Cwsuicatlon Kavigatioral wytam ard equllpent; interior onwications syti; armanrt mtrol systems countermeasure ad aId control ships' protective syta (except electronic) electronic yrstm including electronic ounterasurms.
S allilary Heating systmrm ventilation system; air-conditioning syste; refrigerating pas, plant and rqulpnts gas, HWA, sytm cargo pipinq, orgen-itrogen, aviation lub oil systems plumbing Irstallatics; firmin, flushing. ad prilrer
system; fire etingulshing system; dralnage, trlming, heeling, and bllast syst ; freshwter systm sppr ad deck drains; fuel arnd desel oil fillingr, venting, tog, aid trarsfer ystm; t heating syste; prema-ed-air systms auillary stem exmust st am, ad ta drainsi boyancy trol Wystm (flooding and venting
-urlrinesl); lcellanemas piping systemi distilling plat; steering gear systnm; ruddcr vindes, capstns cranea, aid acor-andlinq ystm; elevastors oving suirways, and cargao hadlirq imL t; operating gear for retractable elevating unitsl aircraft elevators; aircraft arresting gear berrilrs mad barrice ctapults and jet blast
defloc-tors, hydrofoils ad lift system.
6 Outfit d Hill fittings; bots, bott sto, aid hadllrng; rigqging d carv ; ladders d gratings, nnstructural bulkhad furnishnq and nonstructul doors; painting; deck covering; hull Insulatlon; storeron, stoaages, ad lockers; equipment for utility paes; equilpent for rkshops; equipent for galley, pantry, cullery, ad cmlssry outfit; furnishings
for living s ; furnishings for offloe spaces, electronic, ad radar; furnishinqg for medical ad dental qpaces. 7 Armmt Guns, uwnts, ad lar nlrq devlc; ma iintlon-handllng system amuniton stoaqe; pcial weapn soage aad
hddl Ing.
s Design ad Designo d erglrertingq srvice.
_gineering services
9 Construction Staging, scaffolding, and critbling lanchin; trals d dckirng tporary utilitle and services; materLal service handling and rval; cleairg ship services.
make up each group can be found in Fig. 1.5. The summation
of one-digit groups 100 through 700 is equal to the weight of the
whole ship less load items.
The SWBS classification system allows the ship to be specified at any of three levels; one-, two-, and three-digit. Each higher level indicates a higher degree of technical definition, as can be seen from the examples in Table 1.3. The three-digit SWBS level represents the highest level of
definition. Fig. 1.4 shows the SWBS levels of technical
definition as they apply to costing during the exploratory phase of ship design.
SWBS Level
Breakdown Technical Description
Whole Ship
1-Digit Weight Hull Structure - Group 100 Electric Plant - Group 300 2-Digit Weight Hull Decks - Group 130
Lighting Systems - Gr-oup 330 3-Digit Weight Second Deck - Group 152
Lighting Fixtures - Group 32
Examples of Increasing SWBS Level of Technical Definition Table 1.3
All of the ship costing techniques presented in this study use the SWBS weight groups as the means to classify weights.
1.3 ESTIMATE QUALITY
Estimate quality is related to a variety of factors, the majority of which are programmatic in nature (i.e., acquisition strategy plans). In this section, the estimate quality as related to technical definition only is discussed.
NAVSEA uses a cost estimate classification system which uses letters of the alphabet to designate estimate quality. In
increasing level of design definition (i.e., decreasing level of
uncertainty) these are ROM (Rough Order of Magnitude), Class F,
D, C. Table 1.4 shows the SWBS level of technical definition
appropriate for each estimate classification.
SWBS
Estimate Technical NAVSEA
Classification Definition Cost Phase
ROM Less than Planning
Feasibility Study
F Feasibility Study Planning/
1-Digit Weights Programming
D Preliminary Design Programming
2-/ 3- Digit Weights (maybe Budget)
C End Preliminary Design Budget
3-Digit Weights
NAVSEA Ship Cost Estimate Classifications
(Ref. 16)
Table 1.4
This study is concerned with ship cost estimating in and
around the feasibility phase, corresponding to a Class F estimate. The technical level of definition for this class of estimate is the one-digit SWBS group. Therefore the primary technical input to the estimator for this degree of quality will be ar, approximate wei gr; -or each of the 100-700 SWBS groups
listed in Table 1.2 and Fig. 1.5.
The overlap that occurs between design phases means that one-digit SWBS weights are available in the latter stages of exploratory (i.e., conceptual) studies, all through feasibility
studies, and on into the initial stages of preliminary design. Of
course, one-digit SWBS weights can be calculated by simply adding up the weights of higher level components whenever they become avai lable.
The NAVSEA cost phases referred to in Table 1.4 are divided into the planning, programming and budget phase. Class F estimates are generated in both the planning and programming phases. Fig. 1.6 shows how these phases fit into the "big
picture" of ship acquisition. In Fig. 1.6, the initial estimate
is a ROM estimate and the POM (Program Objective Memorandum) is issued to supply guidance to the various Navy agencies involved
in the acquisition process.
C l ass "C" Congressional budqet Initial Estimate i Planning POM I Progr amm 1in
i .: .. B
*'Const :.':: Bas, ."... '.*:
Complete
Contract Plans Contract and Specif1cat1ons Award
'asic'::.'" IContractors ruction:: Submtlt e Date:: Bids :.:::/
)
Start of .. · · ('(
Constructl1:'7"[
....
~~~~~~~~~~~~~~~I Budgeting 8 Months 2 to 5 YedrsApproxlmdtely 2 Years 11 to 18 Months
-I
Typical NAVSEA Ship Acquisition Time Line (Ref. 16)
Figure 1.6
29 I on Launch I-Delivery -<<-{ -l I ! . I I1.4 EARLY SHIP DEFINITION
In order to estimate acquisition costs realistically, the estimator requires a -ertain amount of information in several categories which relate to the ship's configuration, technical definition, and the design and fabricating specifications. Table 1.5 lists and describes these categories as they are addressed
in this study. The inputs for each of the cost models discussed
in Chapter 3 are classified according to the cost driver categories listed in Table 1.5.
Cost Driver Description
Technology technology available,
state-of-the-art design influences
Ship Design weights, margins, design
standards, component selection Manuf acturing fabrication techniques, degree
of automation, learning
Programmatic type of contract, procurement strategy
Economic escalation, inflation &
interest rates, discounting Operations & Support maintenance, personnel, fuel,
spares
Common Cost Driver Classifications
(Ref. 19)
Table 1.5
As a means for providing the necessary information for each
of the cost driver categories in Table 1.5, various synthesis models have been developed. Synthesis models are intended to provide a large number of feasible ship designs, quickly and consistently, in accordance with a set of design specifications. Detailed discussions of synthesis models for Coast Guard cutters and patrol boats can be found in Refs. 7 and 8, respectively. The US Navy introduced the CONFORM (slrface ship continuing CONcept FORMulation) to provide consistent feasibility designs and cost estimates (e.g., see Ref. 46).
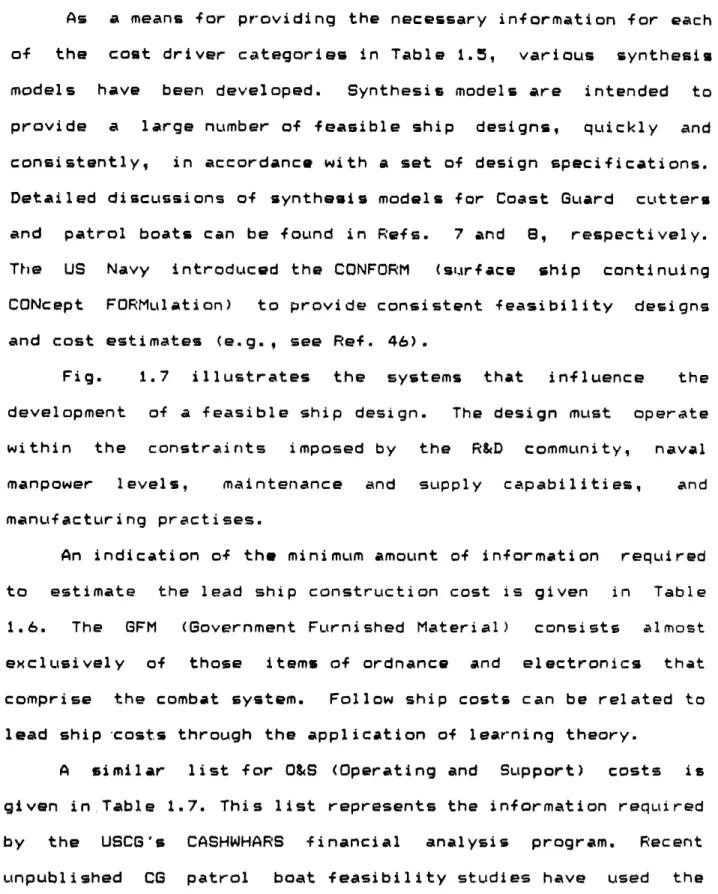
Fig. 1.7 illustrates the systems that influence the
development of a feasible ship design. The design must operate within the constraints imposed by the R&D community, naval manpower levels, maintenance and supply capabilities, and manufacturing practises.
An indication of the minimum amount of information required
to estimate the lead ship construction cost is given in Table
1.6. The GFM (Government Furnished Material) consists almost exclusively of those items of ordnance and electronics that comprise the combat system. Follow ship costs can be related to
lead ship -costs through the application of learning theory.
A similar list for O&S (Operating and Support) costs is given in Table 1.7. This list represents the information required by the USCG's CASHWHARS financial analysis program. Recent unpublished C patrol boat feasibility studies have used the ASSET synthesis model as a front-end to the CASHWHARS program.
Ship Type
Hul11 material and Fabrication methods Listing of major GFNI items
Seven SWBS Group Weights Propulsion Plant and SHP
Electrical Plant Capacity and Number Crew Size
Special Equipments
(e.g., active fin stabilizers, etc.)
Minimum Lead Ship Construction Cost Data
(Ref. 6)
Table 1.6
Interest & Inflation Rates
Fuel Costs
Vessel Maintenance Schedules Operating Hours
Mission Profile Crewing Vessel Life
Minimum O&S Cost Data
(Ref. 34) Table 1.7
/
NIXATA
Systems Influence on ShiS Design (Ref. 47)
Figure 1.7
33
--1.4.1 Effect of Design & Construction Standards
Kehoe et al (Ref. 49) looked at the effect of different NATO
country design practices on the size and total ship investment
cost of a typical antisubmarine warfare (ASW) frigate. The total
investment cost included the basic shipbuilders cost, GFM, and other related costs (e.g., standard allowances for change orders, escalation, electronics and weapons cost growth and cost growth for future characteristics changes).
The seven major design practises listed below were examined;
(1) design & construction margins
(2) hull forms (3) design displacement (4) sustainability (5) survi vabi 1 i ty (6) in-service margins (7) habitability
Sustainability and design margins were found to be the most contributing factors for increased ship size and cost.
Ship construction costs can also be expected to be significantly higher for different specification levels. For example, the use of military instead of commercial specifications will result in increased costs.
1.4.2 Incrporating New Technology
Typically, uncertain cost predictions are not the greatest hurdle to be overcome when considering the introduction of a new technology (Ref. 22). Far greater impact can be expected with political, national security, environmental, energy and societal influences. However, only the cost issue is addressed in this
secti on.
When judging whether the use of a new material or technology to be incorporated into a ship design is cost effective, the cost analysis should be based on its LCC, including R&D, design, manufacture and O&S. The high degree of uncertainty expected with such an analysis must be quantifiable to allow for risk trade-off studies. Cost risk analysis is discussed in Chapter 2.
For shipyard applications, the decision to implement new technologies is primarily based on the economic benefits expected from predicted productivity and efficiency gains. Since the services and skills of the shipbuilder only account for about 20% of the total ship program cost, major gains in shipyard productivity from new technologies affect a relatively small
amount of the total costs (Ref. 24).
1.5 SHIP PROGRAM COSTS
Program costs are often referred to as the life cycle cost (LCC) for the particular system. LCCs are generally categorized
into three areasi (1) research and development (R&D); (2) investment, and; operations and support (O&S). Fig. 1.8
illustrates a representative time line of LCC expenditures. Note that there is generally some degree of overlap between each cost category.
R&D costs are for the work associated with making high technology items or innovation design features available to the ship at key commitment points. There is often developmental work associated with combat system installations. R&D costs are not specifically addressed in this study.
Investment and O&S costs for conventional vessels are the major components of LCCs (Ref. 36). Ship investment costs include construction, government furnished material (GFM), outfitting, post delivery and other miscellaneous costs. The term investment costs is used interchangeably with acquisition costs.
Ship O&S costs include direct/indirect military personnel, direct/indirect ship operations and maintenance and direct ship
PROGRAM
COSTS
H-
INVESTMENT COST -.. ___ OPERATING AND ,IISUPPORT
COST
PROGRAM PECULIAR --R&D COSTS TIMERepresentative Life Cycle Cost Time Line (Ref. 60)
Figure 1.8
37 · · · 0 . ·-moderization costs. Table 1.8 presents the breakdown of
development, acquisition and O&S LCCs for a 360 ton Navy
frigate. Based on a 30 year ship life, the O&S costs are
Category Percentage Breakdown
Operating & Support (*)
Indirect Support 2 Maintenance 10 Moderni zati on 18 Operations 15 Personnel 12 57 Acqui sition Combat systems 17 Machinery 18 Hu 1l 4 39 Development 4
(*) based on a 30 year ship life
Navy Frigate Life Cycle Cost Breakdown (Ref. 36)
significantly greater. A lower percentage for acquisition costs can be expected if the combat capabililty of the vessel is reduced. The following percentage breakdown for the FFG-7 isi R&D - 1.61 Investment - 35.2, and; O&S - 63.2. The O&S costs for US Navy vessels are recorded by the VAMOSC (Visibility and Management of O&S Costs) program, a brief description of which can be found in Section 3.1.1.2.
There are a number of things that can be done during ship design to reduce the main elements of the O&S costs and thereby
decrease the total LCC (e.g., see Ref. 36). However, these
improvements generally result in a higher acquisition cost (Refs.
5 and 50).
Although, the importance of LCCs are not overlooked in the design process, acquisition costs tend to dominate the design decisions. There are three main reasons for the controlling influence of acquisition costs over LCCs (see Ref. 5): (1) there is a more immediate impact for the acquisition' costs; (2) there is considerably less uncertainty associated with acquisition cost estimates, andl (3) there is greater flexibility in the future funding of O&S costs.
The emphasis on minimum procurement cost has been reflected in fixed displacement and hull length constraints or some other design criterion which constrains hull size and principal
dimensions (e.g., see Refs. 47 and 48).
1. 1 .ReportingShip Costs
Observed differences in ship costs, if explainable, can
reflect differences in the subsystems of the ships as a function
of technology changes, inflation, or productivity differences. If inflation and productivity are backed out of the data, the remaining differences should reflect the technology level and major characteristics of the ship subsystems, thus enabling analysts to establish specific cost trends in the data.
Variations in productivity are very much a function of stability in the shipyard's workload and its geographic location (Ref. 2). It is often difficult to remove the productivity shifts that account for different levels of shipyard efficiency
(see section .1.2). However, the effects of inflation can be
removed by expressing ship costs in so-called base year dollars. Other dollar terms used are then year dollars, referring to the
dollar amount for a previous fiscal year (FY), and futre year
dollars for future costs.
Cost f igures can be converted to any base year provided the
required inflation rates are available. Fig. 1.9 shows the
variation
in inflation
rates
for several years. Note that
inflation rates for Department of Defense (DoD) equipment is
consistently higher than that for the
general
economy.
US Economy
DoD
- All
Equipment 1975 1976 1977 1978 1979 1980 1981 9.8 8.1 10.2 9.4 8.1 10.6 10.9 9.3 5.2 5.8 7.4 8.5 9.0 9.4 10.6 9.0 13.2 10.4 11.4 10.3 11.0Source: US Department of Commerce, Bureau of Economic Analysis Inflation Rates (Ref. 17) Figure 1.9 41 _ _ .. |~~ ~ ~~~~~~~ i i , . _ - ~ _ _ _ l ~ ~ ~~~ _ _ _ _ _ - -__ _ __ _ __ __I _ ~ ~~~ _ _ i
Aircraft
For the calculation of total LCCs, O&S costs are generally discounted on a year by year basis using the net present value
technique (e.g., see Refs. 1 and 34). If, for simplicity, the O&S
costs are assumed equal to the same amount, A (base year $), each year throughout the vessel 's life, then the net present value for the O&S costs, NPV (base year $), is given by the expression;
NPV A ( (+i)/(l+d) + (
... + ( (l+i)/(l+d)
(l+i)/(+d) )2 +
)L )
where i = yearly escalation rate
d
yearly discount rate
L
=
ship life in years
The escalation
rate is used to equate a given sum of money
at
the present time (i.e.,
base year) with another sum of money
at any future time.
Discounting is the reverse of the compounding effect of
inflation,
in that the discount rate moves from the future back
to the present. To explain in other terms, escalation is required to account for inflationary trends which decrease the value of present day money in the future, whereas discounting is used because of the time value of money from expected returns on investment. Obviously, the two effects are opposite. The discount
rate is often taken as 10% (e.g., Refs. and 34).
42
CHAPTER 2
OVERVIEW OF SHIP COST ESTIMATING
Cost estimating is concerned with all aspects of production and economics that influence the development, construction and operation (including retirement) of a ship. Within the construction portion of any government agency's shipbuilding budget, there are three primary elements of cost:
(1) costs incurred for management of the acquisition program
(2) costs incurred for the procurement of GFM (3) shipyard costs for construction of vessels
The costs associated with the management of the ship acquisition are programmatic in nature. These include the effects of inflation, profit and other economic factors plus change orders and various cost contingency margins. Programmatic costs significantly impact on the total program costs. For instance, a one dollar change in production costs translates to about a two dollar change in total program costs after programmatic effects
are ncluded (e.g., see Ref. 5).
This chapter deals with the traditional methods of estimating the costs involved with GFM purchases and shipyard construction services, referred to as basic construction costs (BCC). Direct labor and material BCCs make up only 25% of the
funds that must be appropriated for each new ship (Ref. 23).
Table 2.1 lists the various methodologies generally used to come up with cost estimates in this area.
Delphi Analogy Engineering
Cost Estimating Relationships (CER) Parametric
Cost Estimating Methodologies
Table 2.1
The Delphi technique can be described as the solicitation of expert opinion. As suLch, Delphi estimates rely upon the
experience of individuals and often vary widely from one to another. Therefore, the best approach for this method is an iterative one, working towards a consensus among the persons
involved. The Delphi method is frequently used to extrapolate
outside of the range of existing cost data.
Analogy rlies on the comparison of new with existing systems to determine costs. This technique requires historical data on similar existing systems for it to be feasible. Analogy estimates are the most economical to produce of all the methods
listed in Table 2.1.
The engineering method is referred to as bottoms-up estimating and is the "accepted" method of obtaining reliable estimates (e.g., budget quality). This technique is characterized
by separate material and labor costing on a component by
component basis, typically using some form of work breakdown
structure (e.g., the SWBS groups for Navy ships). Depending upon
the technical definition available, component can range from highly aggregated (e.g., whole ship) to very detailed (5-digit SWBS). Bottoms-up estimating is generally the most time consuming
and costly of all the methodologies for the same level of detail.
The NAVSEA Code 017 model described in Chapter 3 uses the traditional engineering approach for cost estimating.
The previous method can be described as using cost-to-cost
relationships, whereby costs are estimated from elements of cost such as labor hours. Parametric and CERs use cost-to-noncost estimating, which involves the use of inputs such as performance (e.g., SHP), weight, etc. to arrive at a system cost. Parametric and CERs are derived using multi-variable and single variable regression techniques, respectively, on existing data. Therefore, these methodologies represent averaged system cost trends and are called top-down estimates. Parametric and CERs are the most economical techniques to use as they give quick answers to what if questions, provided these changes can be properly reflected in the noncost variable(s).
CERs can only be used to predict costs if the new ships have systems similar to those in past ships. The NCA, USCG and ASSET models found in Chapter 3 use CERs to calculate basic construction costs. Increased system definition can be expressed as a separate CER whenever there is sufficient cost data at that level to define a unique trend. The more design features that can be accounted for by using different trends, the more flexibility
there is in the analysis.
Parametric models generally serve as a cross check for detailed estimates (i.e., using the engineering method). They have proven useful for evaluating future technology assessments,
and can influence long term priorities. The RCA PRICE model is a
well-known parametric model.
Cost-to-noncost relationships are typically incorporated into computerized models. This leads to quick turn around time
for estimates as well as consistency of the results (e.g., see
Ref. 6). Consistency is an important factor given the high motivation to accept low estimates as a means to win approval against a competing system. Low estimates can result from unreal performance requirements, difficulty in guestimating unknown variables or predicting technology impacts, and/or over-optimism
(e.g., underestimating manhours).
Although the factors that contribute to a low estimate can be important, the general estimating philosophy has always been
one of conservatism (Ref. 51), which serves to minimize the
effects of unknowns that always arise as ship design (technical) definition improves. For advanced naval vehicles, where the
database is thin, there is a natural tendency to estimate
unknowns conservatively, resulting in higher estimated costs and risks. (Ref. 46). As the concept nears an acquisition commitment, the high cost estimates may eliminate an otherwise feasible alternative from competition. In a recent SWATH design, hull structure estimates reflected a tremendous difference in cost per
pound compared to conventional monohulls, even though the material and fabrication specifications were identical (e.g., see
Ref. 46).
2.1 ESTIMATING BASIC CONSTRUCTION COSTS
2.1.1 General
Basic construction is defined as the contract award price for ship construction, including all production labor, overhead, and material costs plus an amount for cost of money (COM) and profit. Note the use of the word price in this definition. In contracting, price indicates dollar amounts inclusive of fee or profit. If the fee or profit is excluded, the dollars amounts are referred to as costs.
An estimate of CC is developed by utilizing estimates for
the two major parameters of ship construction costs, material costs and labor hours. Direct labor costs are calculated using separate manufacturing or engineering rates or an appropriate
aggregate rate; overhead is estimated as a percentage of the
direct labor costs.
Overhead costs represent that portion of fixed and variable costs allocated to the production of each ship but not directly related to its construction. Examples of fixed overhead include rent, insurance, depreciation of buildings and equipment, and the cost of money. Variable overhead costs change with the activity level in the shipyard and include taxes, employee benefits, communication and travel costs, and production related expenses.
During the feasibility phase of the ship design process, basic construction material and direct labor costs are estimated
using two primary approaches:
(1) wherever ship definition permits, vendor quotes are solicited for the equipment involved;
(2) wherever ship definition is not sufficient to
support a vendor quote, material and labor costs are estimated by
a CER.
CERs reflect historical ship cost data, either in the form of return costs or cost proposals/pricing exercises for similar ships. Labor hour CERs are based on a review of CPRs (contractor performance reports) , historical return costs, proposals, previous estimates and shipyard experience.
CERs relate non-cost design parameters to costs. Typically,
in new ship cost estimating, costs, C ($), are functionally related to SWBS weights (see Table 1.2), so thatl
C = f (weight) (2.1)
where f( ) represents some functional relationship. Fig. 2.1 shows weight based cost estimates in terms of dollars per pound for a wide range of products. The cost per pound for similar products will vary depending upon their differences in complexity.
Other variables besides weight may correlate better with costs, depending upon the application. For example, propulsion systems often use shaft horsepower (SHP) as an independent variable for estimating costs.
Material estimates for hull structure include a scaling
I I I I I I I I I I I I 0.0001 0.001 0.01 0.1 1 10 100 1000 10.000 100000 1M 10M 100M
SELLING PRICE OF UNITS (S/lb)
Weight Based Unit Production Prices
(Ref. 19) Figure 2.1 49 lOOM 100.000-_ 10.000-Z 1000-0- 100- 10- 1- 0.1- 0.01- 0.001- 0.0001-Illl-- * ^ 9 -~~~_ .S I --- ---- ---- `- -- -- '
factor which accounts for the impact of scrap, outs, cut-offs, mill tolerance, weld rod and transportation. Typical factors add an additional 15% to weight based quotes.
Ships can have the same weight in a functional area (e.g., hull structure) and yet have different costs. Cost variations of
this type are due to differences in materials, fabricating, level of technology, plus a variety of other factors. Early in the design process, these factors can be incorporated into CERs to explain general cost trends. However, as design and technical definition increases throughout the design process, the top-down approach inherent in the use of CERs becomes less tenable.
Design definition supports the solicitation of vendor quotes for most of the high value components within the functional areas. Whenever actual equipment costs and weights are obtained from quotes they can be incorporated into the cost estimates for ship construction costs. This is done by reducing the appropriate weight groups by the equipment weights available, recalculating the weight group costs using the appropriate cost estimating relationships (CERs), and then adding the equipment costs to these updated values. This method of shopping list additions will tend to increase the accuracy of any cost estimates since the data is obtained directly from the manufacturer.
The use of actual equipment data is especially helpful for
determining accurate electronics and armament hardware costs. The principal reason for this is that their costs depend mainly upon their performance and sophistication, which are not as easily quantified as weight, space, or any other physical or technical
characteristic. As a result, it is difficult to develop a
functional relationship such as Eqn. (2.1) to explain historical
cost trends in electronics and armament.
For Navy acquisition programs, the effects of software development on costs is becoming more important (especially for combat systems) . In 1980, the DoD spent nearly $3 billion dollars on software costs. However, projected amounts for 1990 are in excess of $32 billion dollars (e.g., see Ref. 17).
There are several models in use for estimating the design and support costs associated with software development. The names of some of the more well-known models are Jensen, COCOMO
(COnstructive COst MOdel), SLIM, and PRICE-S. Information on these models can be found in Refs. 17, 18 and 19.
2.1.2 Should Cost versus Actual Cost
When dealing with GFM quotes, it is important to understand the distinction between should costs and actual costs. Should costs are based on time-and-motion studies of various tradesmen working under controlled conditions. Controlled conditions generally mean that all tools and materials are available and easily accessible throughout the work and that there are few
interruptions.
Manufacturers generally supply should cost information for major items and ancillary hardware costs. Care must be exercised with these vendor quotes, since there is an understandable tendency for over-optimism and bias on the part of vendors, resulting in low cost estimates for the particular item(s).
In contrast, under actual working conditions, tools and materials must be shuttled between the workplace and supply
depot(s) and there are continual disruptions due to a variety of reasons. The result of these differences is that actual costs can be expected to exceed should costs by 15 to 20 percent (Ref. 2). The effects of modular construction and other producibility considerations on this difference have yet to be adequately investigated. However, it would seem logical that any producibility improvement would reduce the difference between the two.
Should cost can have different interpretations than described above for vendor quotes. The US Navy may initiate a
should cost study of a sole-source contractor's facilities to
identify inefficiences in the operation and determine what a reasonable cost to the government would be if these were eliminated. The results of the study form the basis for the government's position during contract negotiations.
Finally, a should cost study can also refer to an independent review of a proposed program budget estimate by a team of analysts. Their purpose is to establish a range of costs
2.1.3 Learnin.g Rate
Shipbuilding, as well as many other industries, experiences a learning or improvement process when multiple units are being constructed in orderly phased sequence. The historical data accumulated by industry verify that learning takes place (Ref. 43). These empirical data provide the basis for what is referred to as learning curve theory.
The theory is that each time the total quantity of ships
built doubles, the manhours, material, or basic construction cost of the ships is reduced by a constant percentage of the previous manhours, material, or basic construction cost.
For a given learning rate, the cost of the Nt h ship,
CN (S), can be calculated from the following relationship;
CN = C1 N(log R / log 2) (2.2)
N CS N I (.2)
where C1 = lead ship cost ($)
R = the fractional learning rate (%/100)
Eqn. (2.2) is referred to as the unit learning or Boeing curve relationship. Since each point on a learning curve represents a theoretical individual unit cost as a percentage of the lead ship production cost, the area under this curve up to a given quantity equals the total production cost for that amount.
Estimators have a choice of working with unit or cumulative average curves. The difference in these two approaches can be explained using the following example. If the eighth ship manhours were 90 percent of the fourth ship manhours, then the learning would be expressed as a 90% unit learning curve. On the other hand, if the average manhours of all eight ships were 90
percent of the average manhours of the first four ships, then the learning would be expressed as a 90% cumulative average learning
curve.
Fig. 2.2 illustrates that a unit learning rate of 94% is equivalent to a cumulative learning rate of 97% . Provided they are used correctly, the choice of unit versus cumulative rates for follow ship calculations does not affect the total ship acquisition cost. Unit learning rates of about 90% have been noted for Navy destroyers and frigates (e.g., see Refs. 25 and
30).
The amount of learning that occurs on any production schedule depends on a variety of factors, including system complexity (i.e., skill level required), manuf actur i ng technology, construction time and time between starts.
Low skill level jobs exhibiting minimal learning have learning rates close to unity, that is, there is little or no
reduction in labor with subsequent performance of the task.
Conversely, systems requiring highly skilled tradesmen can show significant learning effects, so that there is a sharp reduction of labor between the lead and follow ship.
The more highly automated the fabrication process is, the less learning that takes place between the first and lst ships (e.g., see Ref. 20). Innovations like robotics and zone outfitting result in lower production costs from increases in shipyard efficiency and consistency of application, not from learning effects.
SHIP CONSTRUCTION COST LEAD SHIP 97 of Lead Ship Cost AVERAGE COST UNIT COST 94 of Lead Ship
Cost
FOLLOW SHIPUnit and Cumulative Learning Curves
(Ref. 1)
Figure 2.2
55
--Learning theory is defined for production in an orderly phased sequence. BIW (Bath Iron Works) reached a high point in their production learning during a time period in which a number of Navy destroyers were built in a relatively short time frame
(Ref. 23).
When production occurs in multiple lots, too slowly, or with too great a time gap between construction starts, follow ship costs do not follow Eqn. (2.2). Fig. 2.3 illustrates that for a lapse in production, the shipyard experiences a jump in costs upon resumption of building.
Break in Production Recurring Unit Production Cost Cumulative Quantity
Disruption of the earning Curve
(Ref. 17) Figure 2.3 57 I I I I I I I I I I I I .1 I I
2.1.4 Scheduling
The construction costs for a ship or group of ships is highly dependent upon the procurement strategy chosen for construction. This strategy indicates the number of vessels, the length of each construction period, the time between construction starts and the number of lots that the vessels are to be built in. From this partial listing, it can be seen that production learning and scheduling effects are interrelated.
Pre-outfitting, modular and zone construction, increased use of automation and other fabrication improvements are resulting in shorter construction times. The effect of these changes is the reduction of production manhours, thereby reducing costs. However, current indications are that the production savings are being offset by increased engineering and support efforts (Ref.
16). An overall drop in total construction costs can be expected as these advanced techniques become more fully integrated into the fabrication process. The impact of producibility gains is further reduced because shipyard costs only affect a relatively small amount of the total program budget (Ref. 24).
Fig. 2.4 illustrates that an optimum project schedule results in the lowest production costs, while compression of the schedule (i.e., overtime, more shifts) results in significant
increases in costs.
Although stretching out of the schedule also
U A IL O z 0 , 0
z
UNRELIABLESCHEDULE (PERCENT OF TYPICAL)
Schedule Length versus Optimm Program Cost (Ref. 61)
Figure 2.4
59
effects, these are generally less severe in magnitude. There is also an optimum phasing of design and construction schedules, when construction starts immediately after design is complete. Overlapping of these schedules will result in increased costs, as
shown in Fig. 3.15.
Variations in expenditures and government funding patterns can significantly affect program costs. Fig. 2.5 compares multiple and single lot production costs using the RCA PRICE cost
model (see section 3.1.5).
In the feasibility design phase, there exists a great deal of uncertainty regarding production scheduling. Lowest costs can be expected for an "optimum" construction period combined with a single lot procurement strategy.
LOT 6 5 UNITS LOT 5 4 UNITS LOT 4 4 UNITS LOT 3 4 UNITS LOT 2 4 UNITS LOT 1 DEVE LOP-MENT PLUS 8 PRODUC-TION UNITS LOT 6 LOT 5 LOT 4 LOT 3 LOT 2 LOT LOT 2 LOT 2 21 UNITS LOT 1 1 LOT DEVE LOP-MENT PLUS PRODUC-TION OF 29 UNITS
CURRENT PRICE H PRICE H rnLIC " ESTIMATES ESTIMATE ESTIMATE ESTIMATE
Program Cost Cmparisons
(Ref. 26) Figure 2.5 61 I I 80 PROGRAM COST % 60 40 20 -_ . A_ A_ . _ _ _ _ _ _... _ J~ IJDo P