OF CORRELATION FUNCTIONS
IN THE DETECTION
OF SMALL SIGNALS IN NOISE
Y. W. LEE
T. P. CHEATHAM, JR. J. B. WIESNER
TECHNICAL REPORT NO. 141 OCTOBER 13, 1949
RESEARCH LABORATORY OF ELECTRONICS MASSACHUSETTS INSTITUTE OF TECHNOLOGY
'i
MASSACHUSETTS INSTITUTE OF TECHNOLOGY Research Laboratory of Electronics
Technical Report No. 141 October 13, 1949
THE APPLICATION OF CORRELATION FUNCTIONS IN THE DETECTION OF SMALL SIGNALS IN NOISE*
Y. W. Lee
T. P. Cheatham, Jr. J. B. Wiesner
ABSTRACT
The first part of this paper presents the general concept of the corre-lation functions. A mathematical reinterpretation of the correcorre-lation func-tion is given in terms of the sum of the products obtained by representing the correlation function as a discrete time series. An electronic correlator capable of performing the necessary mathematical operations to obtain corre-lation functions is described and a description of the application of the correlator to the detection of small signals is presented. The advantage of cross-correlation in the detection of a signal of known frequency is demonstrated.
THE APPLICATION OF CORRELATION FUNCTIONS IN THE DETECTION OF SMALL SIGNALS IN NOISE
I. Some General Properties of Correlation Functions
Mathematically, the autocorrelation function of a time function fl(t) is defined as:
T
¢11(T) = lim A f rl(t)fl(t + r)dt (1)
T c -T
In an analogous fashion, the cross-correlation functions between two time functions fl(t) and f2(t) are defined as
T
*1 2 () - lim fl(t)f 2(t + T)dt (2)
and
rT
21(T) - im f2(t)fl(t + )dt . (3)
Quite simply, correlation functions are a measure of the mean relation-ship existing between the product of all pairs of points of the time series involved, separated in time by a delay T. The autocorrelation function and similarly the cross-correlation function are equally well-defined for both periodic and random time functions.
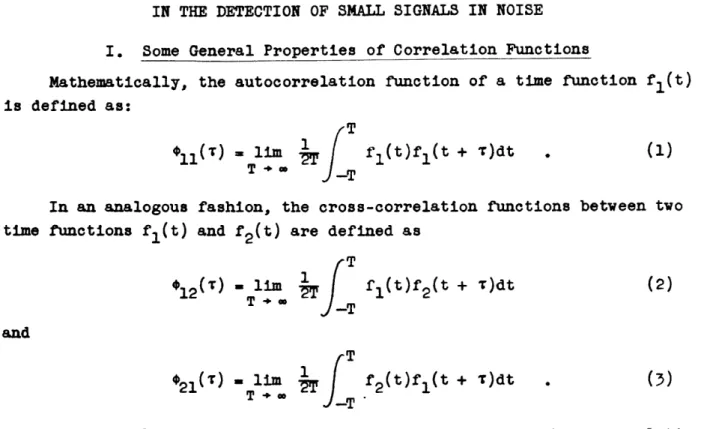
It can be shown that the autocorrelation function 1 1(T) is a maximum
at T = O, being equal to the mean of the square of the time function. In the absence of a periodic component, 1 1(T) approaches the square of the
mean of the time function as T increases. These general properties allow us to sketch a rough picture of the bounds or envelope of autocorrelation
functions for random time series.
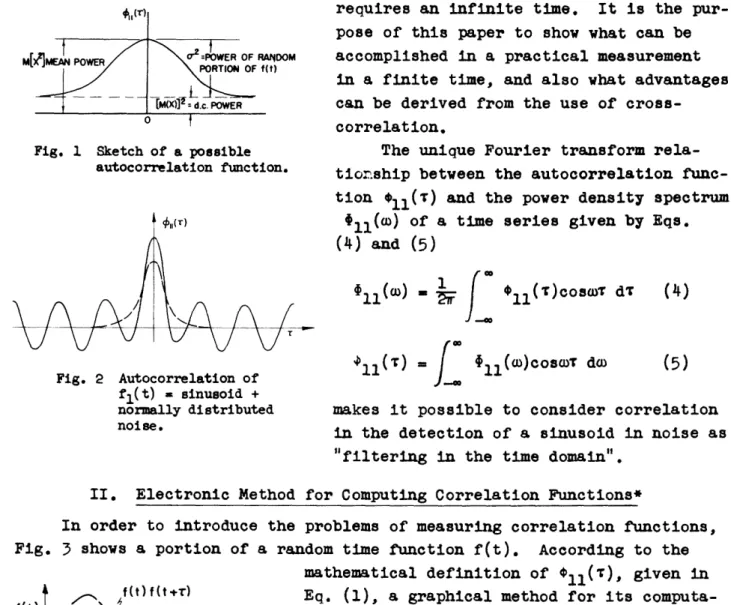
However, if a periodic component such as a sine wave were present in fl(t), the autocorrelation function would appear roughly as it does in
Fig. 2, since component parts of correlation functions add linearly, and the correlation function of a sinusoid is a cosine function of the same frequency. If the random portion of fl(t) is normally distributed noise, its mean value is zero and therefore its correlation function approaches zero for large values of T. The correlation for the sinusoid, however, is again periodic and of constant amplitude. It is pointed out, therefore, that theoretically an infinite signal-to-noise ratio can be obtained in the detection of a periodic signal (no matter how small) in noise through the property of autocorrelation alone. One should remember, however, that "theoretically"
-1-o2 POWER OF RANDOM
PORTION OF f(t) [M(X)]z : d.c. POWER V
Fig. 1 Sketch of a possible autocorrelation function. Ii(r)
A /
\J
\/\ /T \1/ \-/ Fig. 2 Autocorrelation of fl(t) = sinusoid + normally distributed noise.requires an infinite time. It is the pur-pose of this paper to show what can be accomplished in a practical measurement in a finite time, and also what advantages can be derived from the use of cross-correlation.
The unique Fourier transform rela-tionship between the autocorrelation func-tion 11(T) and the power density spectrum
+11(X) of a time series given by Eqs. (4) and (5) 11(X) W:
ll
(11
)1
/
1:
e11(T)cosm dr L(W)coswT d) (4) (5) makes it possible to consider correlation in the detection of a sinusoid in noise as "filtering in the time domain".II. Electronic Method for Computing Correlation Functions*
In order to introduce the problems of measuring correlation functions, Fig. 3 shows a portion of a random time function f(t). According to the
mathematical definition of ¢11(T), given in Eq. (1), a graphical method for its computa-tion would be to delay f(t) by an interval , giving f(t + ), to multiply these two func-tions continuously, integrate, and average. This interpretation electronically required a means for delaying and storing the entire
time function and in addition an a priori
Fig. 3 Graphical method of knowledge of the bandwidth requirements of obtaining an auto- the time function - a characteristic which,
correlation function.
correlation in general, we are trying to measure. Afunction
simpler process is suggested through a re-interpretation of the mathematical expression of the correlation function, where emphasis is placed on the fact that it represents the mean relation-ship of the product of all pairs of points of the time series separated by *A detailed report on the electronic correlator is given by T. P. Cheatham, Jr. in
Technical Report No. 122, Research Laboratory of Electronics, M.I.T. (to be published).
2-M _MEAN POWER "[t9MAc POWER - --1---'11~11--.--"111 11 I II I
---V ---V
f (A /__/
an interval T. That is, an arbitrary or random selection of a large number of pairs of points separated in time 1 seconds, multiplied together, summed, and their mean taken, determines one point on the correlation curve. The important point is that the correlation function can be represented by a summation and averaging of a large number of discrete multiplications, where sampled values of f(t), rather than the entire time function, are delayed and stored. This means that the mathematical definition of Eq. (2) becomes approximated by:
N I
ll( Tk) anbn
0
(6)
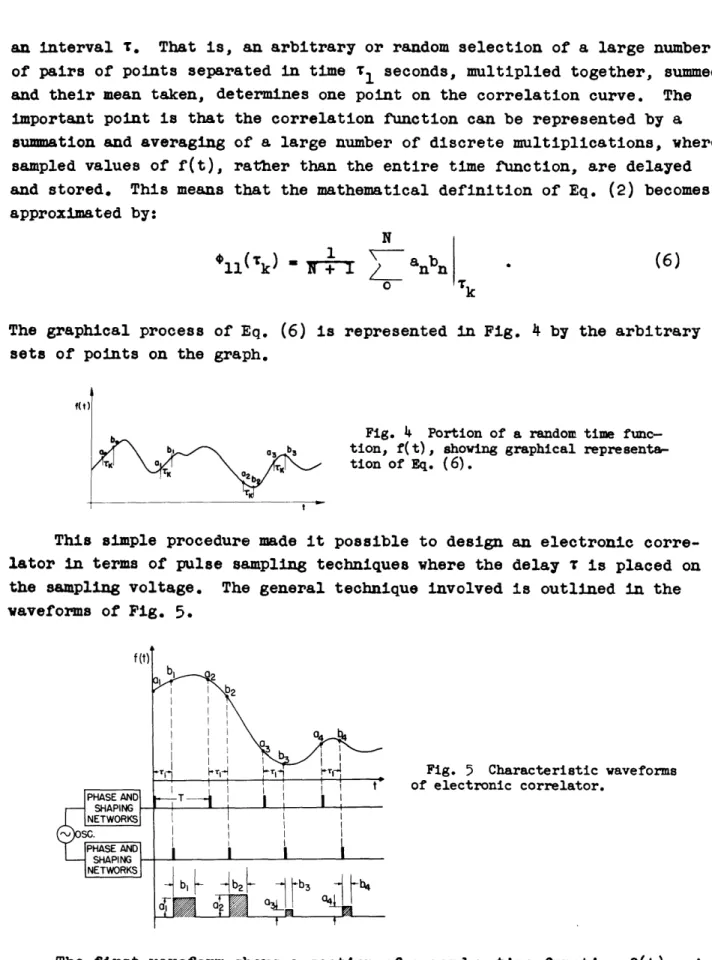
The graphical process of Eq. (6) is represented in Fig. by the arbitrary sets of points on the graph.
Fig. 4 Portion of a random time func-tion, f(t), showing graphical representa-tion of Eq. (6).
This simple procedure made it possible to design an electronic corre-lator in terms of pulse sampling techniques where the delay T is placed on
the sampling voltage. The general technique involved is outlined in the waveforms of Fig. 5.
Fig. 5 Characteristic waveforms of electronic correlator.
The first waveform shows a section of a random time function f(t). A
sine-wave master oscillator is used to derive the timing and sampling pulses
-3-of the next two lines. These sampling pulses are used to measure the ampli-tude of f(t) at the a and b points as indicated. These ampliampli-tudes are stored over a sampling period T and multiplied in time-amplitude co-ordinates by converting the b amplitudes into linearly equivalent time-width modulated pulses, which are then used to gate the stored amplitudes of the a points. The output of the gating circuit is the series of pulses of varying ampli-tude and width shown in Fig. 5. The area of each of these pulses is pro-portional to the product of a pair of points an, bn separated in time Tv seconds. The integral or summation of these pulses over a period, say 1, which approximates the statistics of the random time function, then gives a measure of 11('t1). The value of the integral is recorded, T shifted, and
the process repeated.
III. The Application of Correlation Functions in the Detection of a Sinusoidal Signal in Noise
The practical and quantitative properties of the electronic correlator in the detection of a sinusoidal signal in noise in a finite length of time is presented here. In order to arrive at a clear picture of the basic no-tions involved, consider first the general case of two time funcno-tions fl(t) and f2(t), both consisting of a signal plus random noise as indicated by Eq. (7).
fl(t) - Sl(t) + l(t)
f2(t) = 52(t) + N2(t) . (7)
By substituting Eq. (7) into Eq. (2), the cross-correlation of these two time functions will be seen to be made up of four component cross-correlation terms:
¢1 2(s) = 2 (T) + S N (T) + N S (T) + *N N ( ) . (8)
If the two time functions fl(t) and f2(t) are independent and incoherent
then each of the four component terms of Eq. (8) will be identically zero as the period of correlation approaches infinity. For a finite time of correlation, however, the standard deviation of the points of the corre-lation curve will approach zero as a function of the number of discrete independent samples taken by the correlator.
As a first specific case, consider the properties of autocorrelation in the light of a practical problem of detecting a periodic signal in ran-dom noise where the only a priori knowledge of the signal is, perhaps, its probable location within a certain broad bandwidth. In terms of the pre-vious general case, f2(t) is identically fl(t); both channels of the
111-111-correlator operate in parallel from the same input. Here again the corre-lation function will be made up of four terms:
*°11i) - 93(T) + SR(T) + NS(T) + °N(T) · (9) The first term is the autocorrelation of the signal component - it will be nonzero - the next two terms are the cross-correlations of the signal and noise components, These, theoretically, as T approaches infinity, will be
identically zero. The fourth term is the autocorrelation of the noise com-ponent, Theoretically, this term will be zero for large T and can be made zero for all by compensation. The first term is a measure of our desired signal, and the last three are essentially noise terms whose dispersion
approaches zero as a function of the number of samples computed by the corre-lator. It is important to note that there are at least three effective
noise terms and actually a fourth if one includes the inherent amount of dispersion in the measurement of the signal term in a finite length of time.
It is convenient to evaluate the use of autocorrelation in the detec-tion of a signal in noise in a finite length of time in terms of the rms signal-to-noise ratio improvement at the output of the correlator. This improvement can be determined as a function of the rms signal-to-noise ratio at the input and the length of correlation time.
It should be noted that the cross-correlation terms of Eq. (9), as well as the autocorrelation term for the noise component (for large T), are com-puted from the average product of two independent variables. Since the dispersion of the product of two independent variables is equal to the product of the individual dispersions (providing first moments are zero, as in our case), we are able to evaluate the dispersion of each component
term of Eq. (9) and hence the aggregate rms noise term at the output of the correlator.
A. At Input to the Correlator
If the signal is E cos(cot + ), and the noise is normally distributed with a standard deviation , then the input rms signal-to-noise ratio is given by:
Signal E
fois( . 10
rms - a( B. At Output of the Correlator
The measure of the desired signtal is the autocorrelation signal compo-nent term of Eq. (9). Analytically, it is determined by substitution in Eq. (1).
im T E2
$SS (T) *lm
1G
[E coswrt] [E cosca(t + T)]dt. - cosoT . (11)The above expression for OSB(T) is its theoretical value. The electronic correlator practically measures a value which approaches close to
2
(T) cosaT (12)
where
N number of samples computed K = a variable normalizing factor.
The desired output rms signal component as measured by the correlator is therefore
NE2 21 K
The rms contributions of the effective noise component terms at the output of the correlator are evaluated by assuming that minimum T is set suffi-ciently large so that the correlation of the noise at the discrete sampling points is effectively zero. It has already been pointed out that this is an unnecessary restriction since the correlation of the noise, once measured and known a priori, can be compensated.
Since the four effective noise terms are independent, their aggregate contribution can be evaluated as the square root of the sum of the squares. Therefore, for autocorrelation:
NE2 output BSl-l .'- - * (13) rms aN + 2NE22 NE4 If we define: Z = input Sn p= E oise rms Q W output o-se1 rms
Equation (13) can be simplified symbolically to the following relation: N= Z2
TW d2 Z . (l4)
The derivation of Eq. (14) serves to illustrate the fundamental notions
and experimental techniques involved in the use of autocorrelation functions for the detection of small signals in noise. While the relation of Eq. (14) is explicit and useful, its greatest importance lies in its role as an intro-duction to and part of a more general concept concerning the evaluation and use of a priori knowledge in the detection of a desired signal.
A sinusoidal signal E cos(Ot + ) is completely described by a knowledge of the three constants: amplitude, E; angular frequency, m; and phase angle,
O. One knows intuitively from the notions of information theory that if we have an a priori knowledge of any of these three constants of a sinusoidal
signal, the knowledge should be of some advantage in the detection of the sinusoid.
A practical demonstration and evaluation of this notion is that with an a priori knowledge of the frequency of the signal we wish to detect we can locally generate as an input to the second channel of the correlator a sinusoid having the same frequency, thus measuring cross-correlation. In this case, we shall find that the cross-correlation 12(T) is made up of the desired signal correlation component and only one noise term. We have
fl(t) - s l(t) + Nl(t)
f 2(t) - 2(t)
T
12(T) - T a 1f -T+ [31(t) + Nl(t)] 32(t + T)dt
It¢12(t) , 1 32 (Tr) + *N 3Tl) (15)
We see, therefore, that cross-correlation has reduced the effective number of noise terms from three to one or, if we include the effect of a certain dispersion in the measurement of the signal component in a finite time interval, from four to two. The quantitative advantage of this over auto-correlation is derived below in a manner similar to Eq. (14), but with a
parameter a introduced to show the transition from auto- to cross-correlation, thus allowing for a corresponding possible physical method of utilizing any a priori knowledge of the probable signal location in frequency.
The generalized problem of the detection of a signal in noise through auto- and cross-correlation as outlined above can be presented in the following manner. Let
fl(t) - Sl(t) + Rl(t) f2(t) S2(t) + 2(t) -7-_U _ 1 -· _ I I ~ · I -·~. 111_ 111
where N1(t) is the noise from a bandwidth B, and N2(t) is the noise from a reduced bandwidth aB, where a < 1. If the rms value of N1 - , then the rms
value of N2 -= v . Also, if Sl(t) - E coscot, let S2(t) - mE cos (t + 0),
where m I l21/1311, and -. phase angle between S1(t) and 2(t).
In a fashion analogous in its reasoning to the specific case of auto-correlation already considered, the effective signal and noise component terms can be evaluated giving the following output signal-to-noise ratio.
miE 2
output Si7n l 2 . (16)
rms
mNE
aN
E2
22
E2oa
2NaJ
4 4K2 + Q- T + m1 r + < If we define as before Z - input se a E rms and W output sig i rms
we may write Eq.(16) as:
W Z2 (17)
4Z4 + Z2(1 + am2) + am2
Equation (17) has several interesting interpretations. If we let a m 1, we see that it reduces to Eq. (14) for the case of autocorrelation. For
the case of cross-correlation, a is equal to zero, and it is interesting to observe that W is then independent of m. That is, the advantage of knowing, a priori, the frequency of our desired signal is exact and complete and
independent of the amplitude parameter of the cross-correlated signal. Our advantage is solely determined by the extent of our a priori knowledge. A
physical interpretation can be given for values of a other than 0 (cross-correlation) and 1 (auto(cross-correlation). For intermediate values of a, the process is essentially autocorrelation, but a strong a priori probability of the signal's location in a restricted bandwidth makes it possible to shape the bandwidth characteristic of one channel of the correlator to fit this a priori knowledge and hence take advantage of it by reducing a, which increases the input rms signal-to-noise ratio. It should be noted that physical reasoning restricts m to be equal to unity except when a is equal to zero (cross-correlation).
In the case of cross-correlation, it should be noted that since no
knowledge has been assumed of the phase angle constant , of the desired signal, the maximum of the signal cross-correlation component must be determined. This will require a measurement of the correlation curve at a minimum of two different values of .
However, if it is assumed that we know both the frequency and phase angle of the desired signal, there will be no ambiguity as to the position of the maximum since, as already pointed out in section I, it must occur periodically at T = 0, T, 2T, etc. The advantage of an a priori knowledge of is then seen to give a constant 3-db improvement in output signal-to-noise ratio.
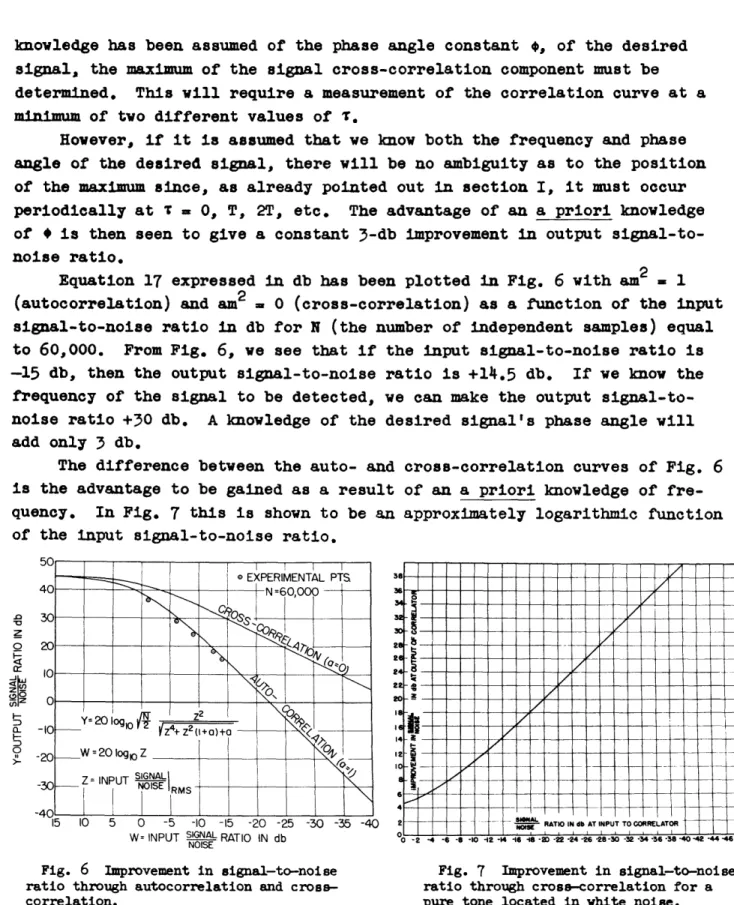
Equation 17 expressed in db has been plotted in Fig. 6 with am2 1 (autocorrelation) and am2 = 0 (cross-correlation) as a function of the input signal-to-noise ratio in db for N (the number of independent samples) equal to 60,000. From Fig. 6, we see that if the input signal-to-noise ratio is -15 db, then the output signal-to-noise ratio is +14.5 db. If we know the
frequency of the signal to be detected, we can make the output signal-to-noise ratio +30 db. A knowledge of the desired signal's phase angle will add only 3 db.
The difference between the auto- and cross-correlation curves of Fig. 6 is the advantage to be gained as a result of an a priori knowledge of fre-quency. In Fig. 7 this is shown to be an approximately logarithmic function of the input signal-to-noise ratio.
o 0
z
0
Fig. 6 Improvement in signal-to-noise Fig. 7 Improvement in signal-to-noise ratio through autocorrelation and cross- ratio through cross-correlation for a
correlation. pure tone located in white noise.
It is significant to note that this curve is independent of N, the number of samples, and hence the averaging time. For example, if a certain output signal-to-noise ratio in db could have been obtained through
I_--g 0 93 4 .14 qr O 1 .9r40 00 0 wv
i,
I I= N 0 A 96 U 11 10r 'E A Iautocorrelation for an input signal-to- noise ratio of, say, -40 db, then a possibility of having switched to cross-correlation through a knowledge of the frequency constant will give a +40-db improvement.
As a point of some importance, a few quick calculations will show that an attempt to use cross-correlation in the detection of a signal of "unknown" frequency, and hence with a flat a priori probability of location within a broad bandwidth, by "hunting" will give no advantage over autocorrelation.
Fig. 8 shows some examples of experimentally measured correlation curves that check fairly well the analytical results above for autocorrelation.
It is well to emphasize that theoretically no claim can be made that correlation or "filtering in the time domain" is superior to filtering in the frequency domain in the sense of accomplishing in the time domain what is impossible in the frequency domain. Such a claim would be false, since it has already been shown in section I that correlations and power-density spectrums are uniquely related by the Fourier transform. However, it is pointed out that many equivalent operations may be more practicable and feasible from an engineering standpoint in the "time domain". A zero band-width in the frequency domain, for instance, corresponds in the time domain to a very stable oscillator. At the present time it is much easier to build a stable oscillator than to build a network having effectively "zero" width. Also, the flexibility of control in the time domain of the effective filter width appears to be a considerable advantage.
Acknowledgment
The writers wish to express their appreciation for the valuable sug-gestions and assistance given by Dr. M. Cerrillo, Dr. E. R. Kretzmer, and Mr. C. A. Stutt of this Laboratory, and also to Dr. M. Loewenthal, now with Sylvania Inc. and formerly of this Laboratory.
* *S