Analyzing VC Influence on Startup Success
A people-centric network theory approach
by
Beth M. Hadley
S.B., Massachusetts Institute of Technology (2015)
Computer Science
Submitted to the
Department of Electrical Engineering and Computer Science
in Partial Fulfillment of the Requirements for the Degree of
Master of Engineering in Electrical Engineering and Computer Science
at the
Massachusetts Institute of Technology
June 2017
c
○ 2017 Beth M. Hadley. All rights reserved.
The author hereby grants to MIT permission to reproduce and to
distribute publicly paper and electronic copies of this thesis document
in whole or in part in any medium now known or hereafter created.
Author . . . .
Department of Electrical Engineering and Computer Science
May 22, 2017
Certified by . . . .
Peter Gloor
Research Scientist, MIT Center for Collective Intelligence
Thesis Supervisor
Accepted by . . . .
Christopher J. Terman
Chairman, Masters of Engineering Thesis Committee
Analyzing VC Influence on Startup Success
A people-centric network theory approach
by
Beth M. Hadley
Submitted to the Department of Electrical Engineering and Computer Science on May 22, 2017, in partial fulfillment of the
requirements for the Degree of
Master of Engineering in Electrical Engineering and Computer Science
Abstract
In this thesis, we study the impact of venture capitalists on startup success using social network analysis. Using multiple sources, we compile a unique dataset of 3199 US-based technology startups and their board members, from which we generate and analyze the interlocking directorates network (formal network) and Twitter network (informal network). We find that startups with more VC board members are more central in the formal network, receive greater funding, have greater annual sales, yet a smaller return-on-investment. We also find that VCs are more central in the Twitter network than non-VCs, have greater Twitter popularity, yet tweet significantly less. Our results indicate that VCs carry a considerable amount of financial and social capital, which they transmit to the startups they invest in, yet their participation leads to lower startup ROI. Additionally, our dataset enabled us to investigate more general questions regarding startup success, including gender diversity on startup boards.
Thesis Supervisor: Peter Gloor
Acknowledgments
Foremost, I sincerely thank Peter Gloor of MIT’s Center for Collective Intelligence for being a tremendously supportive thesis supervisor and mentor on this project. Although when I began I knew very little about social network analysis nor venture capital, Peter never ceased to support and encourage me by sharing his insightful ideas, research expertise, and vast knowledge. He astounded me with his availability and responsiveness - he often replied to my emails just minutes after I had sent them, with specific ideas and responses to my questions. I can’t imagine a better thesis advisor than Peter.
I also wish to thank Stephanie Woerner, of MIT’s Center for Information Systems Research, for enthusiastically joining this research project and becoming a valuable advisor to my thesis. Stephanie consistently proposed clever ideas and insights that pushed our research questions in new and exciting directions. Her encouragement and enthusiasm were always contagious, and her delicious baked goods always very welcome.
I thank Yuhong Zhou, visiting scholar at the Center for Collective Intelligence, for her partnership on this work, and in general for her friendship. Yuhong provided a unique perspective and helped me to think about this work using a global approach. I also gratefully acknowledge the developers of the Condor software (Peter Gloor, Marton Makai, Hauke Fuehres, Joao Marcos da Oliveira) for simplifying the creation and analysis of social networks in this thesis. My project would not have been possible without their years of dedication and commitment to Condor.
I also thank Shikha Sharma, MIT Business and Management Librarian, for helping me get started with MIT’s business databases.
I’d like to thank my friends, family, and the many MIT professors and staff who supported my decision to take a "gap" year to work abroad - in France and Mongolia - before returning to MIT to complete my MEng. That gap year very much redefined my interests, both personally and professionally, and for that I am tremendously grateful.
I also thank the MIT Computer Science department and specifically professors Rob Miller and Julie Greenberg for extending teaching assistant positions to me for two courses (6.811 Principles and Practice of Assistive Technology and 6.813/6.833 User Interface Design), which provided the funding for my MEng year.
Dedication
I dedicate this thesis to my grandpa, Thomas H. Dooley. Having completed an ex-tremely successful career in corporate finance, Grandpa always encouraged me to di-versify my technical education by learning about business, finance, and management. Thank you, Grandpa, for sharing with me your breadth of intellectual curiosity.
Contents
1 Introduction 13 1.1 Motivation . . . 13 1.2 Our Approach . . . 14 1.3 Research Questions . . . 14 1.4 Contributions . . . 15 1.5 Outline . . . 16 1.6 Thesis Scope . . . 16 1.7 Definitions . . . 171.7.1 Network Theory Definitions . . . 17
1.7.2 Network Centrality Measures . . . 19
1.8 Research Standards . . . 19
2 Background and Related Work 21 2.1 Demonstrated Impact of VCs on Startup Success . . . 21
2.2 Networks and Venture Capitalists . . . 25
2.3 Interlocking Directorates . . . 26
2.4 Social Networking Analysis . . . 27
3 Data Sources 28 3.1 Formal Network Data Sources . . . 28
3.1.1 Constructing the Formal Network Dataset . . . 28
3.1.2 Data Source: Capital IQ . . . 28
3.2 The Dependent Variables . . . 33
3.2.1 Crunchbase: Total Funding . . . 34
3.2.2 Capital IQ & Crunchbase Dataset Merge . . . 34
3.2.3 OneSource: Annual Revenue . . . 34
3.2.4 Dependent Variables as Startup Success . . . 35
3.3 Informal Network Data Sources . . . 36
3.3.1 Constructing the Informal Network . . . 36
4 Analysis of VC Influence on Startup Success 40 4.1 Location of Successful Startups in Formal Network . . . 40
4.2 Comparing Formal & Informal Networks . . . 46
4.3 Venture Capitalists in the Twitter Network . . . 49
4.4 Network Centrality and Financial Success . . . 52
4.4.1 Network Centrality and Income . . . 52
4.4.2 Network Centrality and Startup Funding . . . 53
5 Additional Startup Success Factors 56 5.1 Number of Founders . . . 56
5.2 Female Diversity in the Networks . . . 59
5.2.1 Female Board Membership . . . 59
5.2.2 Gender and the Twitter Social Network . . . 66
5.3 Influence of Educational Prestige and Social Capital on Income . . . 68
5.4 Top Startup Categories . . . 71
5.5 Residential Location and Network Centrality . . . 73
6 Future Work & Conclusion 75 6.1 Demonstrating Causality . . . 75
6.2 Construction of a Third Informal Communication network . . . 76
6.3 Comparing Across Geographies . . . 76
List of Figures
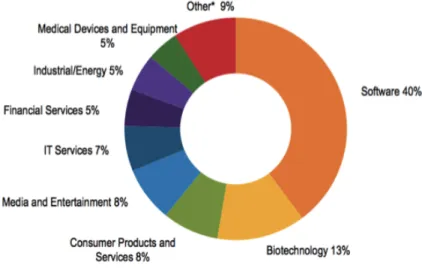
1-1 The distribution of venture capital investments in 2015 according to sector. The IT/Software industry accounted for the largest percentage (40%) of venture capital investments in 2015. . . 17
2-1 Demonstrates the trade-off entrepreneurs must make between financial gains and control over their company. These trade-offs indicate the potential for conflict between entrepreneurs and CEOs. . . 23
3-1 The formal interlocking directorates network, containing a single large central connected component surrounded by a sea of disconnected islands. 31 3-2 A zoom on the central connected component of the interlocking
direc-torates network, where there is a greater presence of VCs. Node size is proportional to betweenness centrality. . . 31 3-3 The informal twitter network, containing a single large central
con-nected component surrounded by a few satellites of concon-nected islands. 39
4-1 This figure demonstrates that both betweenness and degree central-ity in the formal interlocking directorates network is correlated with greater startup funding. . . 41 4-2 Distribution of VC board membership across our dataset of 525 startups. 42 4-3 Distribution of the percentage of VCs on a starups’ board of
direc-tors versus the startups’ ROI. Fewer VCs on the board correlates with higher ROI. . . 43
4-4 The typical company lifecycle in terms of funding, from initial loss to exponential gain. . . 45 4-5 The 3 people who ranked in the top 100 in both formal and informal
networks, ranked by betweenness and degree centrality. . . 49 5-1 Distribution of startups by number of founders. . . 57 5-2 A graph showing the number of startup founders versus funding for
1217 startups in our dataset. The more founders, the more funding. . 57 5-3 A figure from a similar study comparing startup number of founders
and funding, provided for comparison. . . 58 5-4 Number of founders vs. number of startups with >$10M in funding
(enabling direct comparison to previous study). . . 59 5-5 Distribution of female board membership on startups boards. . . 61 5-6 Female board membership (by percentage) across various industries
according to a study by Credit Suisse. . . 62 5-7 Female diversity among investment partners in the top 100 US VC firms. 65 5-8 Distribution of IT categories among dataset. . . 72 5-9 The top 5 residential locations of individuals in our dataset. . . 73
List of Tables
3.1 Summarizes the datasets we extracted from Capital IQ, including the size of each unique dataset. . . 29 3.2 Includes t-tests which demonstrate that VCs are more central in the
formal network. . . 30 3.3 The top 10 people, ranked in order of betweenness, in the interlocking
directorates network. . . 32 3.4 The top 10 startups, ranked in order of betweenness, in the interlocking
directorates network. . . 33 4.1 Correlations between centrality measures of formal interlocking
direc-torates network and total startup funding from Crunchbase. . . 41 4.2 Correlations between centrality measures in formal interlocking
direc-torates network and log of annual sales from One Source. . . 41 4.3 T-tests demonstrate that startups with VCs on their board have greater
funding and sales, yet lower ROI. . . 43 4.4 Pearson correlations between centrality measures in the interlocking
directorates network and the Twitter network . . . 47 4.5 The people who ranked in the top 100 most central people (by
be-tweenness and degree centrality) in both the formal (interlocking di-rectorates) and informal (Twitter) networks. . . 48 4.6 T-Tests on centrality measures for VCs and non-VCs in formal and
4.7 T-tests between VCs and non-VCs for a number of Twitter usage char-acteristics. . . 51 4.8 Correlations between centrality measures and individual income. . . . 52 4.9 Correlations between an individual’s Twitter centrality measures and
an individual’s maximum affiliated startup funding. . . 54 5.1 T-tests on funding between startups with females and without females
on their board (excluding female VCs). . . 60 5.2 T-tests on the number of current board memberships and previous
board memberships held by women versus men. . . 67 5.3 T-tests on a number of statistics between males and females, mostly
demonstrating lack of significance. . . 68 5.4 Excerpt from World University Ranking 2016 to illustrate ranking
methodology. . . 70 5.5 Correlations with average income between school rank, reach-2, and
the combined metric. All are significantly correlated. . . 71 5.6 The top two categories with the highest correlations with the log of
total funding amount. . . 72 5.7 Pearson correlations on centrality measures of interlocking directorates
Chapter 1
Introduction
The purpose of this research is to use social network analysis techniques to measure the impact of venture capitalists on startup success, by analyzing both formal and informal networks. In addition, the dataset we collected for this purpose allowed us to investigate a number of additional questions, including the gender diversity of board membership, number of founders, geographic location of startup headquarters, indus-try specialization, and relationship of schooling and social prominence on individual income.
1.1
Motivation
There is much uncertainty involved with early stage startups. Venture capitalists are faced with literally million dollar questions as they seek to evaluate early stage startups, to determine the potential of an investment. Likewise, entrepreneurs are faced with equally valuable questions as they seek venture capitalists from whom to not only gain funding, but also support and mentorship. We hope that this work will provide some answers regarding the VC-startup ecosystem and reveal key trends and indicators of success by studying the formal and informal networks of both venture capitalists and entrepreneurs.
1.2
Our Approach
VC and startup success has been studied from many angles. In this work, we address the question with a people-centric approach, constructing social networks of the board members of each startup. We choose to study the board of directors of a startup, as board directors have a great deal of influence over a startup due to their financial, intellectual, and social capital resources. Furthermore, board members often sit on multiple boards, and therefore may share their resources with multiple startups. The resulting network formed by board membership represents a communication network, through which critical resources (money, knowledge, and opportunities) flow.
We strive to answer questions about startup success and the participation of VCs in this success by constructing two types of networks: a formal network and an infor-mal network. The forinfor-mal network is an interlocking directorates network composed of people and the boards they sit on, whereas the informal network is a Twitter social network composed of tweets and retweets.
1.3
Research Questions
Fundamentally, we aim to investigate the question of how venture capitalists, in particular through their networking behavior, influence the success of a startup, and how this is manifested in people-centric networks. To answer this broad question, we adopt a network theory approach and investigate questions that we believe shed light on the ultimate question. We first look at the position of successful startups in the formal network, and compare this to the position of startups with many VCs on their boards. Secondly, we construct an informal social network composed of Twitter data, and look at the behavior of venture capitalists in this network. By looking at venture capitalists’ influence in these networks, we develop evidence that informs our response to the ultimate research question - how do venture capitalists influence the success of startups.
that influence startup success. For example, we investigate the correlation the follow-ing factors have with startup success: number of founders, female board membership, and tech industry. We also investigate individual success, and ask if someone’s loca-tion in the Twitter social network is indicative of professional success. By answering our research questions, we provide evidence for various trends of success and failure in the tech startup ecosystem.
1.4
Contributions
In this thesis, we make the following contributions:
1. Demonstrate a novel approach to studying startup success by creating and com-paring formal and informal networks based on startup board of directors mem-bership.
2. Collect a substantial dataset from multiple sources (Capital IQ, Crunchbase, OneSource, US Tax Data, and US News & World Report School Rankings) which did not previously exist and which permitted investigation of questions not previously analyzed in this way.
Given our analysis of this dataset, we provide evidence for the following conclu-sions:
1. Startups and individuals located more centrally in both the formal and informal network are generally more successful - in terms of startup funding, revenue, Twitter popularity, educational background, and personal income.
2. Startups with more VCs on their board tend to receive greater funding, have greater annual sales, but a smaller return-on-investment (defined as revenue ÷ funding).
3. VCs are significantly more central in both formal and informal networks than non-VCs, and they have greater popularity (defined as the ratio of followers to number of people you follow on Twitter). Interestingly, VCs tweet significantly
less than non-VCs, further proving the point VCs are inherently more "popular" than non-VCs.
4. The number of startup founders is positively correlated with startup success. 5. The number of female board members is negatively correlated with startup
funding.
6. A person’s educational rank (measured by the prestige of their university) and their social capital (measured by reach-2 in the Twitter network) is correlated with their residential income.1
1.5
Outline
In the remaining sections of the Introduction, we provide contextual information and definitions about this thesis. In Chapter 2 we review previous work in this area. In Chapter 3 we summarize the data sources used and the process of constructing the networks. In Chapter 4 we present our analysis of this data and how our results address our research questions regarding the influence of VCs on startups. Chap-ter 5 discusses some additional research questions we investigated related to startup success. Chapter 6 provides some ideas for future work and concludes the thesis.
1.6
Thesis Scope
We limited the scope of this study to the US tech startup industry. We describe below specific details regarding the scope limitations we imposed in our study.
Startup: We define a startup as any company founded in 2011 or more recently. We began with a dataset from Capital IQ which contained 3199 startups, out of which 1514 had Crunchbase funding data, from that 525 had OneSource sales data.
Industry: Only startups in the IT/Software domain were investigated. In 2015, software startups received 40% of all dollars invested in startups that year, which is
1As defined by the average residential income of the zip code address in which they live. See section 5.3 for details.
by far the largest percentage by sector. Therefore, restricting this study to only IT startups insures both a large dataset and controls for industry effects.
Source: Franklin and Haque [2016]
Figure 1-1: The distribution of venture capital investments in 2015 according to sec-tor. The IT/Software industry accounted for the largest percentage (40%) of venture capital investments in 2015.
Venture Capital Firms: We limit our study to only those firms managing a venture capital investment fund, as opposed to private equity or hedge fund.
Geography: The study is limited to startups with headquarters in the United States.
1.7
Definitions
1.7.1
Network Theory Definitions
Formal Network A network that is constructed based on formal rules and con-tracts that exist in the real-world. In this thesis, the interlocking directorates network is our formal network.
Informal Network In contrast to a formal network, an informal network is one that is not constructed based on rigid rules and often does not represent strong real-world ties and/or relationships. The informal network is often much more socially structured. In this thesis, the Twitter social network is our informal network.
Interlocking Directorates (ID) Network A network composed of companies (the nodes) and links between two companies where the same director sits on the boards of both companies. This is also referred to as the formal network in this thesis.
ROI (Return-on-investment) Measures the efficacy of a startup in transforming dollars of investment into revenue. Calculated as the ratio between sales and funding. We use sales rather than revenue because the database (OneSource) only provided annual sales data, although we expect sales to be highly correlated with revenue so we do not anticipate this to alter our results.
Social capital The networks of relationships among people who live and work in a particular society, enabling that society to function effectively [Nahapiet and Ghoshal, 1998].
Twitter (Social) Network A network composed of people (the nodes) and a link between two people if one of the people has tweeted about the other person and/or retweeted something that person has tweeted.
VC (Venture Capitalist) A VC, or venture capitalist, is someone who invests pri-vate equity in small, early-stage, emerging companies that they deem to have high growth potential. In this thesis, we limit our study to only VCs associated with formal VC firms.
𝐴𝑛𝑛𝑢𝑎𝑙𝑆𝑎𝑙𝑒𝑠(𝑂𝑛𝑒𝑆𝑜𝑢𝑟𝑐𝑒)𝑈 𝑆𝐷𝑚𝑖𝑙 𝑇 𝑜𝑡𝑎𝑙𝑆𝑡𝑎𝑟𝑡𝑢𝑝𝐹 𝑢𝑛𝑑𝑖𝑛𝑔(𝐶𝑟𝑢𝑛𝑐ℎ𝑏𝑎𝑠𝑒)𝑈 𝑆𝐷𝑚𝑖𝑙
1.7.2
Network Centrality Measures
Betweenness Centrality The extent to which a vertex lies on paths between other vertices. People with high betweenness may have considerable influence within a network by virtue of their control over information passing between others. Removing them from the network will most strongly affect communications between other vertices because they lie on the largest number of paths taken by messages.
Closeness Centrality The mean distance from a vertex to other vertices. A person with lower mean distance to others (high closeness) are likely able to spread their opinions to others in the community more quickly than someone with higher mean distance, as the information must "travel" farther.
Degree Centrality The number of neighbors a node has. The more neighbors a node has, the greater number of people who will be directly influenced by that person and the information they distribute.
Reach-2 Counts the number of nodes a node can reach in 2 or less steps. Effec-tively, this is a measure of the strength of your "friend-of-a-friend" network. It measures how many people someone can reach via their friends.
1.8
Research Standards
Throughout this thesis, we compare various sets of data and seek to determine if there is a statistically significant difference and/or correlation between the data sets.
We use t-tests to make a binary conclusion regarding whether or not there is a difference between the mean of two datasets. All t-tests are two tailed Student’s t-tests. A t-test is considered significant if the p-value is less than 0.05.
We use correlations to indicate the strength of similarity between two datasets. All correlations are two-tailed Pearson correlations. A correlation is considered significant if it has a p-value less than 0.05. As is typical in research in the domain of managerial
science and behavioral economics, it is rare to see correlation coefficients greater than 0.5, and typically correlations of 0.05 - 0.30 are considered interesting, so long as they have a p-value less than 0.05. Furthermore, we do not make any causal claims, as this would require temporal data which we unfortunately had no ability to acquire (see section 6 for a discussion on future work).
Chapter 2
Background and Related Work
2.1
Demonstrated Impact of VCs on Startup Success
Venture capital (VC) is well established as one of the key driving forces in the Amer-ican entrepreneurial ecosystem. According to the National Venture Capital Associ-ation, in 2015 nearly $60 billion in venture capital was deployed across 4,380 deals. More than 30% of those deals were to companies receiving venture investment for the first time [Franklin and Haque, 2016]. That said, studies have not provided con-sistent conclusions regarding the impact of VC investments on entrepreneurial firms, and whether this impact is a net positive or negative. Although the answer is likely, "it depends", the question is worthy of continued rigorous analysis.
Advocates for the positive influence of VCs claim that VCs serve three main roles to identify and promote successful startups:
1. Screening
VCs choose to invest in high quality companies with promising potential. They are experienced at selecting for certain criteria that predict success, such as technical expertise and founder commitment [Chan, 1983], Amit et al. [1998]. 2. Monitoring
VCs track the status of their portfolio companies, comparing investments with market trends and opportunities. They protect the value of their investments
by adding credibility and prestige to those companies they invest in [Lerner, 1995], [Kaplan and Strömberg, 2003].
3. Coaching
VCs provide advice and support to their portfolio companies with the intent of improving their chances of success and, in return, the return on their investment. This may include connecting the firm with resources (networking), assisting with recruitment, and providing experience, advice, and mentoring [Hellmann and Puri, 2002], [Hellmann, 2000].
Some researchers advocating for the positive influence of VCs on startup growth have demonstrated the correlation between VC backing and startup success: VC-backed firms have faster growth, faster times-to-market of their products, more patents, higher productivity, and are more likely to go public [Wright and Mike, 1998]. Some studies have also been able to demonstrate a causal relationship between VC involve-ment and startup success. For example, one study investigated how VCs’ on-site involvement with their portfolio companies (as facilitated by the introduction of di-rect airline routes between VC firms and their portfolio companies) increased the portfolio companies’ innovation and success. The study found that the introduction of a new airline route led to a 3.1% increase in the number of patents the portfolio company produces (a measure of "innovation") and an increase of 1.4% probability of having a successful exit (via IPO or acquisition). Although small yet significant, these results do indicate that VC involvement is an important determinant of innovation and success [Bernstein et al., 2015].
Another longitudinal study compared the efficiency gains generated by venture capital (VC) investment in private firms from 1972 to 2000. They compared the productivity and efficiency of 1,881 VC-backed firms with 185,882 non VC-backed firms. They found that the overall efficiency of VC-backed firms is higher than that of non-VC-backed firms at every point in time, and they demonstrated that this was due to both screening (pre-investment) and monitoring/coaching (post-investment). Interestingly, they also demonstrated that companies backed by "high-reputation VC
firms" have significantly greater productivity, likely a reflection of the monitoring ability of high-reputation VCs. Lastly, they showed that both screening and moni-toring activities of VCs positively affect the probability of a successful exit (IPO or acquisition) [Chemmanur et al., 2008].
That said, reasons and explanations abound which indicate just the opposite, that venture capitalists can and do have a negative influence on startups and their entrepreneurs. Foremost, a large body of research exists regarding conflicts between startup entrepreneurs and VCs. Prior research has identified three main areas of VC-CEO conflicts [Khanin and Turel, 2013]:
Source: Wasserman [2008]
Figure 2-1: Demonstrates the trade-off entrepreneurs must make between financial gains and control over their company. These trade-offs indicate the potential for conflict between entrepreneurs and CEOs.
1. Conflicts of interests and unfavorable attributions
In this conflict type, the interest of the VC/VC firm is directly in conflict with the interest of the entrepreneur/startup. For example, the higher the pre-money valuation (the value of a startup before VC investment), the better for the startup, yet the worse for the VC. Tradeoffs and compromises are often the solution to these conflicts, as illustrated in figure 2-1 (extracted from a Harvard Business Review article) [Wasserman, 2017].
2. Conflicts of inefficient collaboration
In this conflict type, the VC and the entrepreneur fails to work together and does not form a mutually beneficial collaborative partnership. For example, if a VC maintains a high degree of oversight over the startup, the entrepreneur may perceive this as having a low degree of autonomy whereas the VC may simply be wishing to contribute expertise and add value to their investment.
3. Conflicts of VC-CEO mismatch
In this conflict type, the VC and the entrepreneur does not align regarding fundamental characteristics such as personality type, educational background, and/or strategic vision. For example, if the CEO is a "builder", i.e. he is really focused on creating a viable enterprise whereas the VC is an "investor", i.e. primarily focused on achieving fast financial results, conflicts are likely to occur [Perry, 1988].
Although research indicates sources of conflict between founders and VCs abound, the implications of such conflict are not entirely obvious. Conflict does not necessarily have a negative impact on the success of a startup; one study showed how disagree-ment can be beneficial to venture performance, although conflict as personal friction was negatively associated with performance [Higashide and Birley, 2002]. Nonethe-less, at high levels of occurrence and intensity, conflict is generally considered to be costly to those involved [Reve and Stern, 1989]. It can thus be reasoned that in the VC-entrepreneur relationship, conflict is a likely contributing factor to negative outcomes regarding VC investment in startups.
The negative impacts of VC investments have been demonstrated analytically for a number of geographies external to the US, although to the author’s knowledge no studies in the US have reached similar conclusions. A study of startups in Singapore demonstrated that the post-IPO operating performance of VC-backed companies was inferior to non VC-backed companies, though they were less underpriced [Wang and et al., 2003]. Another study analyzed startups in China, and found that VC firms failed to enhance the development of startups, and to some extent even exerted a
hampering effect on the performance of funded firms [Xi and Su-Sheng., 2016]. A study of the French startup ecosystem from 1996 to 2006 demonstrated that VC financing had a negative impact on firm survival [Pommet, 2017].
There seems to be a growing sentiment emanating from Silicon Valley to be dubi-ous and extremely aware of venture capitalist investment. A number of recent news articles - mostly targeted at entrepreneurs - warns VCs may have a negative or at best neutral or insignificant influence over the success of a startup. In a 2014 article "VC Funding Can Be Bad For Your Start-Up" [Mullins, 2014] published in the Harvard Business Review, the author provides four clear reasons to be wary of VCs:
∙ Pandering to VCs is a distraction.
∙ Term sheets and shareholders’ agreements can burden you. ∙ The advice VCs give isn’t always that good.
∙ The stake you keep is small - and tends to get smaller.
Fred Wilson, co-founder at Union Square Ventures, wrote in a blog post in 2013: "The fact is that the amount of money start-ups raise in their seed and Series A rounds is inversely correlated with success. Yes, I mean that. Less money raised leads to more success. That is the data I stare at all the time" [Wilson, 2013]. While academic research remains to prove or disprove his claim, it is inherently intriguing that a venture capitalist would make such a comment, and begs further analytical investigation.
In this thesis, we attempt to disentangle the conflicting messages coming from academia and industry regarding the impact of VCs on startup success. By applying a unique approach to studying the industry, namely a network theory analysis of the board membership network and Twitter social network, we believe our work provides a unique contribution to the literature.
2.2
Networks and Venture Capitalists
In this thesis, we take a unique network theory approach to understanding the impact of VCs on startup success. We discuss below related literature in the domain of social
network theory. To the best of our knowledge, we are the first to analyze the question of VC influence through an analysis and comparison between both formal and informal networks.
Since the mid 1980s, social networks and relationships have been demonstrated to be absolutely critical to an entrepreneur’s success [Hoang and Antoncic, 2003]. Social networks can take a variety of forms, from people and physical conversations to online personas (via Facebook, LinkedIn, and Twitter) and electronic messages. The value of real-world, physical networking is certainly well-understood and proven [Zimmer, 1986], [Allen et al., 2009]. However, the role of digital networks, and their comparison to physical networks, is less understood, as there is a fundamental difference between strengths of ties in physical networks versus digital ones [De Meo et al., 2014]. In the context of venture capitalists and entrepreneurs, a network composed of venture capitalists and entrepreneurs in the physical world might vary drastically from one in the digital world. In the digital world, a tie, albeit weak, may be created in seconds when a venture capitalists creates a tweet, whereas in the physical world the tie might represent thousands, millions, or even billions of dollars of investment. On the other hand, a simple 140 character tweet could be seen by thousands or millions of people in a single minute, and impact their actions and behaviors on a daily basis. The contrast between these two kinds of networks is not well understood, but better knowledge of their congruency may lead to a better understanding of the influence venture capitalists play on startups, both in the physical world and in the digital.
2.3
Interlocking Directorates
A physical network commonly studied among venture capitalists and entrepreneurs is an "interlocking directorates" network. Companies are represented by nodes in this network, and ties exist between companies if an individual (either a venture capitalist or an entrepreneur) sits on the board of directors of both companies. The presence of interlocking directorate networks was a source of fervent academic study during the 20th century - as concern mounted that monopolistic corporations were supported
by interlocking directorate relationships [Mizruchi, 1996]. Studies demonstrated that interlocking networks have correlated with performance of corporations, organiza-tional failure, economic downturns, CEO pay, the sale price of a corporation, stock synchronicity, and prices for a corporation’s services. Fundamentally, it is clear that interlocking networks facilitate the flow of information among corporations [Saavedra and et al., 2014]. It is less clear to what extent the practice of venture capitalists sitting on multiple startup boards plays in the success of these startups.
2.4
Social Networking Analysis
In contrast to the interlocking directorates network, a social network is an informal network composed of links between individuals who communicate of their own accord. Studies have demonstrated that social networks can indicate and predict the success of startups. For example, a study analyzing the Twitter network associated with 644 IT startups indicated that the higher the centrality and connectedness of the startup in the social network, the more successful the startup in the real world [Yu and Perotti, 2015]. Another study involving the LinkedIn, Facebook, and e-mail networks of an entrepreneurship community in Boston indicated that the more central actors in the network, the more successful they are. Furthermore, proximity to key people in the network correlates with success [Gloor et al., 2013]. Few studies have analyzed the social networks formed between VCs and entrepreneurs. One study, however, investigated the influence of VCs’ social capital on the funding of startups. They constructed a social network based on VC syndication (a link between a startup and a VC if the VC invests in the startup) [Hopp, 2010]. Through the analysis of 1500 funding rounds, they found a positive effect of VCs’ social capital on the amount of money that startups receive [Alexy et al., 2012] For this reason, we too expect that those people who are centrally located in our Twitter social network (hence higher social capital) will sit on the boards of more highly-funded startups. To our knowledge, however, no study has analyzed the Twitter social network of people in an interlocking directorates network.
Chapter 3
Data Sources
3.1
Formal Network Data Sources
3.1.1
Constructing the Formal Network Dataset
The process of constructing a dataset to conclusively answer the research questions was a non-trivial task. Foremost, no single data source contained all the data required, so a combination of data sources was required. Secondly, the data being sought was of a sensitive nature, and not commonly nor publicly available.
In summary, the basic1 dataset we created contains the following fields: Startup
Name, Number of Founders, Board Members, Total Funding, and Annual Sales. We also constructed a dataset of individuals, namely the board members: Persons Name, Gender, Board Memberships, Is a VC?. We describe below the datasource used and the process taken to acquire the data fields listed above.
3.1.2
Data Source: Capital IQ
IT Startups, Board Memberships, List of Venture Capitalists
S&P Capital IQ2 is a financial information platform that was originally designed
1 Basic meaning the minimal dataset. We compiled a vast amount of additional data on these startups, including for example date founded, headquarters location, investors, industry categories, etc. but these data fields were not used in this analysis.
2
for the investment banking industry. The platform provides detailed content in four major areas: company profiles, industry profiles, transaction profiles, and executive profiles. Over 62,000 public companies and 4.4 million private companies are profiled [Financial, 2016]. The platform provides a convenient interface to generate specific datasets according to search constraints.
Of all the data sources we investigated, Capital IQ proved to have the most com-plete and easily extractable information regarding startup board memberships. On January 13, 2017 we extracted three datasets from Capital IQ, as seen in table 3.1
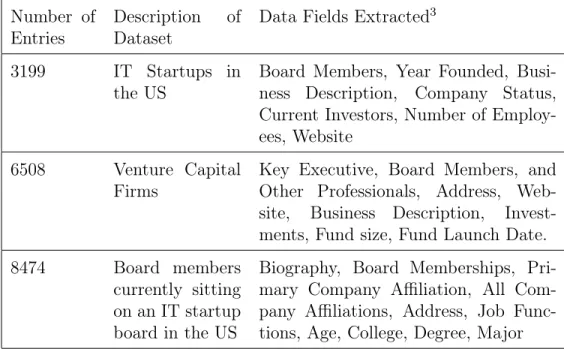
Table 3.1: Summarizes the datasets we extracted from Capital IQ, including the size of each unique dataset.
Number of Entries
Description of Dataset
Data Fields Extracted3
3199 IT Startups in
the US
Board Members, Year Founded, Busi-ness Description, Company Status, Current Investors, Number of Employ-ees, Website
6508 Venture Capital
Firms
Key Executive, Board Members, and Other Professionals, Address, Web-site, Business Description, Invest-ments, Fund size, Fund Launch Date.
8474 Board members
currently sitting on an IT startup board in the US
Biography, Board Memberships, Pri-mary Company Affiliation, All Com-pany Affiliations, Address, Job Func-tions, Age, College, Degree, Major
A simple matching was performed to mark board members as venture capitalists if they appear in the venture capital firms dataset. Individual’s gender, which was not included as a data field in Capital IQ, was extracted from their biography, with a simple lookup for occurrence of “Ms.” vs. “Mr.” and gendered pronouns.
3.1.3
Constructing the Interlocking Directorates Network
Step 1: People Network
Given the Capital IQ listing of startups and board members, the interlocking direc-torates network was constructed. Foremost, a network was constructed with 8474 individuals (nodes) and links between individuals who sit on the same startup board. The network consisted of one large central connected component with 412 individuals, surrounded by a sea of smaller connected components. The average individual was connected to 2.94 individuals in the network.
As a preliminary verification of the data, we wanted to ensure that venture capi-talists were central within the network. We expected this characteristic because it is well known that VCs obtain control over companies in which they invest by acquiring board seats. Having control over their investment is critical for VCs to attempt at influencing the return on their investment. Influence over decisions made by boards of directors is commonly viewed as among the most effective governance mechanisms in VC investments. In an analysis of 182 startup contracts between VCs and founders, at least one board seat is held by a venture capitalist who invested in the round [Bengtsson, 2011].
To verify VCs were central within our network, we calculated three standard net-work centrality measures (betweenness, degree, and closeness as described in section 1.7.2) and compared the position of VCs to non-VCs in the network. As expected, VCs were more central. This may be observed visually in figures 3-1 and 3-2, as well as numerically in table 3.2.
Table 3.2: Includes t-tests which demonstrate that VCs are more central in the formal network.
T-Test VCs Non-VCs n p-value
Mean Degree Centrality 3.4 2.87 1124 6.79e-09
Figure 3-1: The formal interlocking directorates network, containing a single large central connected component surrounded by a sea of disconnected islands.
Figure 3-2: A zoom on the central connected component of the interlocking direc-torates network, where there is a greater presence of VCs. Node size is proportional to betweenness centrality.
VCs not only have on average more connections than non-VCs, but also much higher betweenness centrality. This demonstrates the dataset we collected does indeed conform to our expectations, namely that VCs are more central in the network.
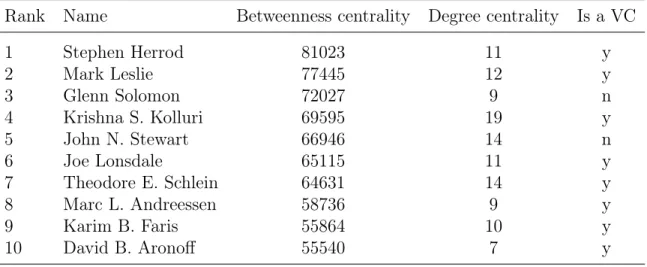
The top 10 people, ranked in order of betweenness centrality, are listed in table 3.3. Eight out of ten of these individuals are VCs, and many are well known in the industry.
Table 3.3: The top 10 people, ranked in order of betweenness, in the interlocking directorates network.
Rank Name Betweenness centrality Degree centrality Is a VC
1 Stephen Herrod 81023 11 y 2 Mark Leslie 77445 12 y 3 Glenn Solomon 72027 9 n 4 Krishna S. Kolluri 69595 19 y 5 John N. Stewart 66946 14 n 6 Joe Lonsdale 65115 11 y 7 Theodore E. Schlein 64631 14 y 8 Marc L. Andreessen 58736 9 y 9 Karim B. Faris 55864 10 y 10 David B. Aronoff 55540 7 y
Step 2: Startup Interlocking Directorates Network
Given the formal network of 8474 individuals, we then collapsed this network to pro-duce a network of 3199 startups, with links between startups who share at least one board member. This is known as the interlocking directorates network [Mizruchi, 1996]. We calculated three centrality measures on this network: betweenness cen-trality, degree cencen-trality, and closeness centrality. Listed in table 3.4 are the top 10 startups ranked by betweenness.
Given this network of startups and various centrality measures, we then turned our attention to acquiring the necessary dependent variables to measure startup success.
Table 3.4: The top 10 startups, ranked in order of betweenness, in the interlocking directorates network.
Rank Startup Betweenness
Centrality Degree Centrality Closeness Centrality Board size
1 Threat Stack, Inc. 79789 22 0.15545 10
2 BetterWorks Systems, Inc. 78697 20 0.15402 9
3 DataGravity, Inc. 66450 17 0.15553 10
4 Turi Inc. 65110 23 0.15435 10
5 Circle Internet Financial, Inc. 59982 15 0.15334 9
6 Nok Nok Labs, Inc. 54984 11 0.15304 10
7 Viptela, Inc. 52513 14 0.15205 10
8 BlueData Software, Inc. 52135 12 0.15164 10
9 QASymphony LLC 50586 11 0.15323 10
10 Wealth Access, Inc. 49946 11 0.15155 10
3.2
The Dependent Variables
One of the fundamental challenges of conducting this kind of study is determining a reliable metric for startup success. Ideally, we would have a dataset containing a listing of startups with their market valuation, in addition to their annual profits and revenue. However, this is practically impossible. Foremost, startups often do not have valuation until they receive funding, and even then this information is rarely disclosed publicly. Startup profits and revenue data is often rarely available, especially for young startups.
In this study, we identify three dependent variables for each startup:
∙ Total Funding The total amount of funding (venture capital or otherwise) that the startup has received since its founding
∙ Annual Sales The startup’s most recent annual sales
∙ ROI Return on investment, defined as the ratio of annual sales to total funding We describe below our process of acquiring total funding data (from Crunchbase) and annual sales data (from OneSource). We also include ROI as a dependent variable because it indicates the efficacy of a startup in transforming dollars of investment into revenue.
3.2.1
Crunchbase: Total Funding
The first dependent variable we sought was the amount of funding each startup re-ceived. For this, we turned to Crunchbase4, an online database containing thorough
information primarily about US-based companies and the people (founders, employ-ees, investors) associated. Data is contributed by registered users and approved by the public. Crunchbase is known for its coverage of startups, especially technology startups. It is also commonly used as a data source in academic research, not only for the breadth of the dataset, but also the efficient data extraction interface via its API [Alexy et al., 2012], [Block and Sandner, 2009]. Although in this work we did not gain access to the Crunchbase API, we did subscribe to Crunchbase Pro, which permitted an albeit limited query of the database and download of data into .csv files for analysis.
On January 2, 2017, we extracted from Crunchbase all IT startups founded since 2011 which have non-zero funding amounts. This produced 16,029 results. The fol-lowing data fields were extracted: Startup Name, Website, Industry Categories, Head-quarters, Description, Status, Founded Date, Twitter Handle, Number of Founders, Date of Last Funding, Last Funding Amount, Last Equity Funding Amount, Total Equity Funding Amount, Total Funding Amount, and Number of Investors.
3.2.2
Capital IQ & Crunchbase Dataset Merge
We then merged the datasets from Capital IQ and Crunchbase, by writing an au-tomated matching script based on startup company name. The auau-tomated matcher was robust to naming variations such as lower and upper case and suffixes (Inc, Corp, Ltd, etc.). This resulted in a combined dataset of 1514 startups.
3.2.3
OneSource: Annual Revenue
The second dependent variable required in this study was startup revenue/sales. This was certainly the most challenging and least publicly available data field. However, we
4
found relevant data in the datasource OneSource Global Business Browser, produced by Avention (recently acquired by Dun & Bradstreet5). This database includes nearly
50 million company profiles, and collects data from over 100 data sources [Hoovers, 2017]. The database includes a field called "Annual Sales" for each company. This is not exactly revenue, as it neglects long-term revenue, for example from licensing or from patent settlements, although sales is a decent proxy for revenue. To extract this sales data, there was unfortunately no easily automated method so we performed a manual lookup of each startup in the dataset. Of the 1514 startups in the original dataset, 525 were found to have revenue information in OneSource.
Although revenue information is notoriously difficult to acquire for private com-panies, and harder still for startups, we have reason to believe that the accuracy of the revenue data we collected from OneSource is relatively high. As a check on the accuracy of the revenue dataset, we collected the revenue of 40 startups from the Cap-ital IQ dataset. We ran a simple Pearson’s correlation between the revenue data in Capital IQ and the corresponding sales data of startups from OneSource, and found a correlation of r=0.627 (p=1.31E-05). Thus, even with this small sample size of 40 startups we demonstrate the validity of the OneSource sales dataset, which gives us reasonable confidence that the revenue data acquired from OneSource is accurate.
3.2.4
Dependent Variables as Startup Success
We have identified three dependent variables in our study with which we use to approximate startup success. Although we acknowledge that funding and sales are not absolute measures of startup success and/or performance, we make the assertion that startups with higher funding, higher sales, and/or higher ROI are generally considered more successful.
We do claim that there is a positive relationship between startup funding and annual sales. Based on a sample size of 525 startups, we correlated the total funding amount (from Crunchbase) with the annual sales (from OneSource) and obtained a correlation of 0.513 (p=1.17E-36). Therefore, we feel confident making the claim that
5
companies with higher funding and higher revenue are more successful.
Furthermore, throughout our analysis we take the logarithm of financial data -funding amount or revenue - to calculate correlations. Taking the log of financial data is standard practice in organizational research. This is convenient, as a log transformation acts as both a transformation to normality and as a variance stabi-lizing transformation. Fundamentally, it transforms an exponential dataset into a linear dataset, which is appropriate in our analysis as we are applying linear analysis techniques such as Pearson’s correlation. Throughout our discussion, when we refer to financial data (funding or sales), we may not explicitly state that we are referring to the log of the financial data, but this is implied.
3.3
Informal Network Data Sources
3.3.1
Constructing the Informal Network
Choice of Social Network
Given our formal interlocking directorates network, we wanted to construct a network of the same people but built on more informal social ties. Whereas the formal network represented social interactions in a very formal context (i.e. the boardroom), this informal network would represent more organic social interactions. We hoped this informal network would provide a unique perspective into the communications among individuals, especially in contrast to the formal network.
A number of sources were considered for constructing such an informal social network, including Facebook, LinkedIn, a survey, and Twitter. Twitter was quickly selected as the optimal choice because:
1. Twitter is the social media platform most extensively used by startups and investors, and broadly used by the business community [Wu et al., 2015]. 2. Twitter provides an easy-to-use public API to access its data.
provide a public API to access data regarding relationships among individuals, and a survey would likely have returned incomplete information and not to the scale we desired.
Matching People with Twitter Handles
Having chosen Twitter, the first task was to lookup the Twitter handles of the 8474 people in our formal network. Unfortunately we did not already have a listing of the Twitter handles of each person, as the data source from which we extracted these people (Capital IQ) did not contain the person’s Twitter handle.
We started with our dataset of 8474 people, which included a list of all companies each person is "affiliated with", in addition to the person’s biography. From the biography, we extracted the person’s nickname, if present. We then wrote a script to query Twitter’s search API for users with a matching full name or nickname (including last name). We also extracted people’s profiles from Crunchbase, which included an individuals’ Twitter handle (although sometimes these pairings were inaccurate).
We then conducted a series of tests to search through the potential Twitter user match(es) in an attempt to only accept those users that represented the individual in our interlocking directorates network. After attempting a variety of strategies, both relaxed and strict, we settled on the following two criteria for accepting a match:
The Twitter user’s description must contain at least one of the companies that the real user is affiliated with
OR
The Twitter user’s description contains “vc”, “capital”, or “partner” and the real user is a venture capitalist.
This resulted in 1,271 matched Twitter handles. To measure the accuracy of this dataset, we manually verified 127 randomly selected people (10% of dataset) and found 87.4% accuracy. We therefore argue that the contribution due to inaccuracy of the dataset is minimized and negligible.
As an added check, we compared the ratio of VCs to non-VCs in the larger In-terlocking Directorates (ID) network to the smaller Twitter network. We found that 15% of the ID network are VCs, whereas 23% of the Twitter network are VCs. We argue that these numbers are relatively similar and therefore our Twitter network is an accurate representation of the larger ID network. We do not expect the slight over-representation of VCs in the Twitter network to bias results, especially since we can explain explicitly why this overpopulation occurs: the additional check of keywords “vc”, “capital” or “partner” selected specifically for venture capitalists. We experimented with conducting a similar test for “founder”, “ceo”, and “entrepreneur” but these words we discovered to be much more common in Twitter descriptions and caused a higher rate of incorrect matches. In conclusion, we believe the Twitter dataset of 1,271 Twitter users to be an accurate representation of Twitter users among the 8,474 people in our ID network.
Building the Twitter Network
Given our list of 1,271 twitter handles, we used the Condor tool 6 to automatically
generate the tweet and retweet network. This produced a network of 45,521 nodes - the 1,271 people initially in the search combined with any Twitter user that they had either tweeted to (with @user_name) or retweeted. We limited the network construction to only the users’ past 100 tweets. This network was constructed on March 23, 2017. Links in this network exist between a person who has tweeted to another person, or a person who has retweeted another person’s tweet. This produced 168,326 links as seen in figure 3-3.
6
Figure 3-3: The informal twitter network, containing a single large central connected component surrounded by a few satellites of connected islands.
The resulting network was quite highly connected - with a large central connected component surrounded by smaller islands (the image fidelity of the figure is not enough to distinguish the thousands of nodes in the network, but merely presented to provide a visualization of the network). Reasonably, the top Twitter accounts ranked by betweenness were TechCrunch, Forbes, WSJ, realDonaldTrump, nytimes, YouTube, VentureBeat, LinkedIn, POTUS, Inc, FortuneMagazine, Google, WIRED.
Network Centrality Metrics
We analyzed the Twitter network using standard centrality algorithms including be-tweenness, degree, closeness, and reach-2 (the number of nodes the ego can reach in 2 steps). Additionally, because we had previously constructed our interlocking direc-torates network from these same individuals, we had centrality metrics (betweenness, closeness, and degree) for each individual from the formal ID network (see section 3.1.3 for a discussion regarding the construction of the interlocking directorates net-work).
Chapter 4
Analysis of VC Influence on Startup
Success
Using the datasets and networks previously described, we conducted an analysis to measure the impact of VCs on startup success. We developed a number of research questions to inform our investigation of this topic.
4.1
Location of Successful Startups in Formal
Net-work
Foremost, in order for us to make any conclusions regarding startup success, we needed to locate successful startups within our networks. Therefore, we investigated the question: are more successful startups more centrally located in the interlocking directorates network? To answer this question, we looked for correlations between the various centrality measures and our three dependent variables (total funding, annual sales, and ROI).
We observed strong positive correlations between total funding and annual sales and all three centrality measures, as seen in Tables 4.1 and 4.2 and in figure 4-1.
Table 4.1: Correlations between centrality measures of formal interlocking direc-torates network and total startup funding from Crunchbase.
Correlation with: Log of Total Funding
r p
Betweenness Centrality 0.217 1.51E-17
Degree Centrality 0.312 1.50-35
Closeness Centrality 0.220 4.52E-18
n=1514
Table 4.2: Correlations between centrality measures in formal interlocking direc-torates network and log of annual sales from One Source.
Correlation with: Log of Annual Sales
r p
Betweenness Centrality 0.232 7.33E-08
Degree Centrality 0.298 3.27E-12
Closeness Centrality 0.197 5.17E-06
n=525
Figure 4-1: This figure demonstrates that both betweenness and degree centrality in the formal interlocking directorates network is correlated with greater startup funding.
Based on these results, we can conclusively say that startups which are more cen-tral in the interlocking directorates network tend to receive more startup funding and generate higher sales revenue. In constructing the formal network, we observed that venture capitalists were much more centrally located than non-VCs, as is commonly understood. We therefore proved the hypothesis that startups with more VCs on their board are more successful, in terms of startup funding and annual sales. What was much less clear was the relationship between VC participation on a startup’s board and that startup’s ROI. To address this question, we studied our dataset of 525 startups, consisting of a total of 1,803 board members (473 of whom are venture capitalists). VC Board membership is distributed throughout the dataset, as seen in figure 4-2.
Figure 4-2: Distribution of VC board membership across our dataset of 525 startups.
To answer our research question, we investigated correlations between our three success metrics and VC board membership. We observed positive correlations be-tween VC board membership and total funding (r=0.29, p=6.02E-12, n=525) and between annual sales (r=0.21, p=1.99E-06, n=525). This is not surprising, as ven-ture capital firms which invest in startups often negotiate for board representation,
so a correlation between total funding and VC board membership is to be expected. We have already seen a correlation between total funding and annual sales, and this holds true as well. Startups with more VCs on their board tend to have higher annual sales.
We then looked at VC board membership and ROI, defined as the ratio of revenue to funding. Surprisingly, we observed a negative correlation between board member-ship and ROI (r=-0.10, p=0.02, n=525). We verified these results with a Welch Two Sample t-test, where we broke the dataset into two groups: startups with VCs on their board, and startups without. All t-tests proved statistically significant, as seen in table 4.3.
Table 4.3: T-tests demonstrate that startups with VCs on their board have greater funding and sales, yet lower ROI.
T-Test Mean (no VCs on Board) Mean (Nonzero VCs
on Board)
p-value
Log of funding 6.679 7.207 9.431e-10
Log of sales 0.4387 0.7639 <2.2e-16
ROI 2.15 0.737 0.00273
n=525
Figure 4-3: Distribution of the percentage of VCs on a starups’ board of directors versus the startups’ ROI. Fewer VCs on the board correlates with higher ROI.
Turning to the raw data, we discovered that startups with VCs on their board earn on average $6.81M annually in sales more than startups without VCs on their board, and receive $15.7M more in funding. However, startups without VCs conclusively experience higher ROI, specifically 191% higher than startups with VCs. When sorted
by ROI, the top 20% of startups have on average 18% VC board membership, whereas the bottom 20% of startups have on average 31% VC board membership. This is statistically significant (p=0.0037, n=525).
Discussion
Given these findings, what does VC membership mean for a startup? We’ve con-clusively demonstrated that more VCs on your board correlates with more funding. This is reasonable, because when VCs commit funding to a startup, it is in their best interest to support that startup’s success, not just financially but also by pro-viding advice and opportunities. VCs often request a board seat to gain authority over the startup, and potentially influence decisions that will yield the greatest return on the VC’s investment. We’ve also conclusively demonstrated that more VCs on a startup’s board correlates with more sales revenue. There are a variety of explana-tions for such a correlation. Foremost, startup funding amount and sales amount are correlated, which is logical. The more funding the startup receives, the more resources it has to generate revenue. Additionally, receiving funding is an indication that ven-ture capitalists place trust in a startup and expect a return on their investment, so it is logical to expect such startups to generate greater sales. This said, it is somewhat surprising that VC board memberships correlates negatively with ROI. This is neither good from the startup’s perspective nor the venture capitalist’s perspective. From the startup’s perspective, startup funding is not free money, but rather money that is traded for company equity and potentially decision making power. The more funding a startup receives, the less equity the founders and employees themselves get to keep. Company sales, however, represent money being generated by the company that con-tribute to a company’s valuation. A higher ROI ratio (sales / funding) indicates that the value generated by the startup itself - the founders and the employees - is likely to stay within the startup and not be diluted by external investors such as VCs who "purchased" equity via investment. From the startup’s perspective, a low ROI indi-cates that the startup has taken on a substantial amount of funding but not seen a relative level of sales; and are therefore in the "trough" phase of startup creation (see
figure 4-4). We have shown that low ROI correlates with a greater percentage of VCs on the board. It is likely that in this early stage of startup creation, more VCs invest in a startup and gain board membership, yet the cash they pump into the company in the form of investment is not matched in terms of startup revenue generated.
Figure 4-4: The typical company lifecycle in terms of funding, from initial loss to exponential gain.
This is a disappointing realization, especially since VCs typically invest in startups with high growth potential. They expect a rapid return on their investment, and will typically do what it takes to direct a startup down this path to rapid growth. That said, it is well known that venture capitalists invest in a large suite of portfolio startups with the hope of just a small percentage yielding massive returns. According to Dave McClure, a partner at the VC Firm 500 Startups, 50-80% of startups yield no exit or return. 15-25% yield a small return of 2-5 times investment amount. 5-10% of investments might reach a valuation of $100 million with exits yielding 10-20 times investment amount. And unicorns are, of course, extremely rare (<1% reach $1 billion valuations returning 50 times investment amount or more). In summary, McClure concludes that "...most startup investments fail, a few work out ok, and a very tiny few succeed beyond our wildest dreams" [McClure, 2015]. Perhaps this is simply the innate process of VC funding, and our data analysis exposes the inefficiencies of the system. On the other hand, startups with high ROI seem to have less VC members on their board. These startups likely did not receive high amounts of funding, yet are generating a disproportionately large amount of sales. Because they did not
receive a large amount of startup funding, they were not in a position to need to accept VCs onto their board. This does seem to lead to the logical conclusion that startups without VCs on their board - and therefore without VC funding - seem to do better in terms of ROI, at least in the first 5 years. This concept has been written about numerous times in a number of entrepreneurship blogs and articles, with the underlying recommendation (as one article put it): "If you are looking towards more measured growth for your startup, want to keep control or you’re simply not established yet, you probably want to avoid VCs" [Jee, 2016]. The evidence is clear - avoid VC investment if possible.
4.2
Comparing Formal & Informal Networks
Using our formal network, we demonstrated VC membership on a startup’s board is positively correlated with funding and revenue, yet negatively correlated with ROI. This already provides evidence that the formal structure embedded within the VC and tech startup industry enables VCs to associate with successful startups and likely boost their success. However, our formal network was simply a proxy for communi-cation among people in this environment, namely the communicommuni-cation that happens in a boardroom. That said, it is well known that communication happens much more informally than this - and much more frequently. We believe that by analyzing a dif-ferent, more informal, network of communication, we would likely reach new insights regarding the influence of VCs on the success of startups.
We began our analysis by first comparing the formal network with the informal network, as both networks were composed of the same people. Our approach to ana-lyzing the congruence of these two networks was to use first and foremost a Pearson’s correlation between the corresponding centrality measures in each network. We found no significant correlation between closeness nor degree centrality, and although we did find a significant correlation in betweenness centrality (r=0.093, p=.001, n=1271) this is quite low and not representative of a strong correlation. See table 4.4 for details. Note that the interpretation of this correlation as low is distinct from all other
corre-lations we make claims on in this thesis, as other correcorre-lations are between real-world variables and a variety of uncontrolled environmental factors, whereas in this correla-tion we truly are comparing two controlled metrics. A meaningful correlacorrela-tion would need to be much higher than 0.093 to be able to consider the networks significant, and even then we would need to use a different correlation calculation - namely QAP (Quadratic Assignment Procedure) to accurately assess congruence. Therefore, we conclude that these two networks really are not very similar.
Table 4.4: Pearson correlations between centrality measures in the interlocking direc-torates network and the Twitter network
Correlation (r) Significance (p)
Betweenness 0.093 0.001
Closeness 0.025 0.375
Degree 0.000 0.999
n=1271
That said, we wondered if the core networkers - the top 100 most central people - were similar between the two networks. To fairly perform this comparison, we extracted from the interlocking directorates network all those people that did not exist in the Twitter network, leaving only the 1271 people that we have in our Twitter network. We then ranked people by betweenness centrality in each network, and counted the number of people that appeared in the top 100 of each network. We did this for each centrality measure: betweenness, closeness, and degree. Generally, we found relatively little overlap in the "core" networkers in these two networks. By betweenness centrality, 13 people overlapped; by degree, 6 people overlapped (see table 4.5). Overlap due to closeness was inconclusive, as many people in the interlocking directorates network had the same closeness metric. 13% and 6% overlap between the core central members of the two networks represent very little congruence in these networks. Therefore, we can safely conclude that the interlocking directorates network and the Twitter social network are very different networks, governed by different motivating mechanisms.
Table 4.5: The people who ranked in the top 100 most central people (by betweenness and degree centrality) in both the formal (interlocking directorates) and informal (Twitter) networks.
Rank Name Is a VC ID Rank Twitter Rank
Ranked By Betweenness 1 Jon Sakoda N 11 66 2 Roger H. Lee N 30 43 3 Ping Li Y 9 65 4 David B. Aronoff Y 7 86 5 David L. M. Sze Y 71 49
6 John William Gurley Y 13 2
7 Neeraj Agrawal Y 77 79 8 James J. Goetz N 92 22 9 Peter J. Levine N 8 28 10 Chamath Palihapitiya Y 16 15 11 Jason M. Lemkin Y 41 1 12 Byron B. Deeter N 92 83 13 Martin S. Hauge N 65 33 Ranked By Degree 1 Jon Sakoda N 68 26 2 Roger H. Lee N 68 22 3 Peter J. Levine N 3 31 4 Venkataraman Vishnampet Ganesan Y 12 95 5 Brian O’Malley N 22 39 6 Erik Benson Y 68 71
network are generally different than the top networkers in the Twitter network, we were curious to identify the few individuals who rank in the top 100 in both net-works across both measures of centrality - betweenness and degree. Just three such individuals exist: Jon Sakoda, Roger Lee, and Peter Levine, as seen in figure 4-5. These three individuals, all venture capitalists with a long history in the tech startup industry, sit on 12 or more boards (as compared to the average number of boards someone sits on in our dataset which is 3.92) and have an above-median1 number of Twitter followers (as compared to the median number of followers in our dataset
which is 1142).
Figure 4-5: The 3 people who ranked in the top 100 in both formal and informal networks, ranked by betweenness and degree centrality.
4.3
Venture Capitalists in the Twitter Network
Our comparison of the formal network with the informal network demonstrated that the two are very different networks, with no clear correlation between individuals’ po-sition between the two. That said, in our continued attempt to ascertain the influence of venture capitalists on the success of startups, we reasoned that an investigation of venture capitalists’ behavior and location in the Twitter network would inform our understanding of their communication patterns. We previously demonstrated