Building a business case for corporate fleets to adopt vehicle-to-grid
technology (V2G) and participate in the regulation service market
by
Andres De Los Rios Vergara
Bachelor of Civil EngineeringUniversidad de los Andes, Bogoti, Colombia, 2004 and
Kristen E. Nordstrom
Bachelor of Arts, EconomicsWesleyan University, Middletown, Connecticut, 2006
IA A SSACHUSETTS INSTITUTE OF TECHNOLOGY
OCT
2 0 2011
LIBRA RIES_
ARCHIVES
Submitted to the Engineering Systems Division in Partial Fulfillment of the Requirements for the Degree of
Master of Engineering in Logistics
at theMassachusetts Institute of Technology
June 20110 2011 Andres De Los Rios Vergara and Kristen E. Nordstrom. All rights reserved.
The author hereby grants to MIT permission to reproduce and to distribute publicly paper and electronic copies of this document in whole or in part.
Signature of Authors.
Certified by....
M ter of Eng66eering in Logistics Program, i e ring Systems Division
/
May 6,
2008
. .
...
.
...
r. Jarrod Goentzel Executive Director, Masters of Engineering i Logistics Program Thesis S ryr
A ccepted by ...
SProt. Y asVShetti Professor, Engineering Systems Division Professor, Civil and Environmental Engineering Department Director, Center for Transportation and Logistics Director, Engineering Systems Division
Building a business case for corporate fleets to adopt vehicle-to-grid
technology (V2G) and participate in the regulation service market
by
Andres De Los Rios Vergara and Kristen Nordstrom
Submitted to the Engineering Systems Division in Partial Fulfillment of the Requirements for the Degree of Master of Engineering in Logistics
Abstract
Electric (EV) and Plug-in Hybrid Electric vehicles (PHEV) continue to gain attention and market share, not only as options for consumers but also for corporate fleets. EVs and PHEVs can contribute to lower operating costs through reduced maintenance requirements and enhanced fuel economy. In addition, a fleet of EVs or PHEVs, when parked and aggregated in a sizeable number, can provide regulation services to the grid through the electricity stored in the vehicle's batteries. This opportunity is known as Vehicle-to-grid technology (V2G). This thesis evaluates the economics for V2G-enabled fleets to participate in the regulation services market. In order to build a business case for fleet managers, we constructed a 10-year cash flow model that compares the operating, infrastructure, and capital costs, as well as the revenue opportunities for EVs, PHEVs, and ICEs. To quantify potential revenues, we adapted a tool that the ISO New England has used to simulate the revenues of participants in the regulation market for an alternative energy pilot. We show that ICEs, while having the lowest retail value, actually have the greatest NPV due to their high operating costs and inability to participate in the regulation services market. EVs have the highest retail value, but due to their large battery size are able to provide the most regulation services. The opportunity for V2G is critical for the attractiveness of the EV. PHEVs offer lower V2G revenue opportunity than the EVs but have greater operational flexibility. We determined that V2G revenue potential is driven by the charger capacity and battery size and there are tradeoffs associated with these components. A larger battery and charger will generate more money from regulation services, but their high investment cost may outweigh these benefits. The correct combination of charger capacity, battery size, and state of charge (SOC) is important. If the charger capacity is too large and SOC too high or low, a small battery can be charged or depleted too quickly, hindering its ability to provide regulation services.
Thesis Supervisor: Dr. Jarrod Goentzel
Acknowledgements
We would like to thank the following people for their invaluable contribution to our research:
* Jarrod Goentzel, Executive Director, Masters of Engineering in Logistics Program and thesis supervisor
" Stephen Connors, Director of the Analysis Group for Regional Energy Alternatives (AGREA), Laboratory for Energy and the Environment (LFEE), Massachusetts Institute of Technology * Tim Heidel, postdoctoral associate with the MIT Energy Initiative at the Massachusetts Institute
of Technology
* Tod Hynes, CEO of XL Hybrids
* Jonathan Lowell, Principal Analyst at the ISO New England * Mike Payette, Fleet Equipment Manager at Staples, Inc.
* Craig Van Batenburg, CEO of Automotive Career Development Center (ACDC)
* A special thanks to Clay Siegert, VP of Supply Chain at XL Hybrids and thesis sponsor, for his patience and tireless commitment to this project.
Table of Contents
List of Figures...5
List of Tables...6
1 Introduction and M otivation...8
2 Literature Review ... 13
2.1 An Examination of the Electric and Plug-In Hybrid Electric Vehicle Market...13
2.2 Operational Cost Savings ... 15
2.3 Vehicle-To-Grid Technology ... 17
2.4 Regulation Services and the Electric Grid... 20
3 M ethodology and M odel Overview ... 23
3.1 Costs Components...25
3.1.1 Capital ... 25
3.1.2 Infrastructure ... 29
3.1.3 Operation...30
3.2 Revenue Components...40
3.2.1 ISO Sim ulation tool...43
3.2.2 Regulation Service Compensation ... 47
4 M odel Configuration...54
4.1 M odel Control Panel ... 54
4.1.1 Control panel parameters... 57
5 Results and Sensitivity Analysis ... 65
5.1 Base case ... 65
5.1.1 Ram p down V2G ... 65
5.1.2 Ram p up & down V2G ... 70
5.2 Sensitivity Analysis Scenarios ... 73
5.3 Ram p down V2G ... 74
5.3.1 Electric Vehicle ... 74
5.3.2 Plug-in Hybrid Electric Vehicle ... 78
5.4 Regulation up & down V2G ... 81
5.4.1 Electric Vehicle ... 81
5.4.2 Plug-in Hybrid Electric Vehicle ... 84
5.5 Best case scenario...87
6 Conclusions ... 91
6.1 Future research ... 93
7 Bibliography ... 95
List of Figures
Figure 3-1 Cash Flow M odel Example ... 24
Figure 3-2 Degree of Electrification for Vehicle Types... 26
Figure 3-3 Regenerative Braking Process... 27
Figure 3-4 Staples' Electric Vehicle ... 28
Figure 3-5 Retail price of diesel fuel... 32
Figure 3-6 Electric car battery cost breakup ... 33
Figure 3-7 Estimates of electric-vehicle battery costs reductions ... 34
Figure 3-8 Cycle life of a lithium-ion battery ... 35
Figure 3-9 Decisions made by a controller in a PHEV ... 36
List of Tables
Table 3-1 Cash flow model cost components ... 25
Table 3-2 Locational Marginal Price of Electricity (dollars per MWh)...31
T able 3-3 C harger levels ... 37
Table 3-4 Regulation Clearing Price (dollars per MWh)...42
Table 3-5 ACE signals ISO New England ... 46
Table 3-6 Cash flow model revenue components ... 47
Table 4-1 B ase Case - Control Panel... 55
Table 4-2 Cash flow components and their drivers...56
Table 4-3 Infrastructure changes costs according to the type of charger ... 64
Table 5-1 Total Overall Costs - Ramp down - V2G Base Case...66
Table 5-3 Total cost per mile according to diesel price -Ramp down - V2G Base Case ... 67
Table 5-2 Percent Change Overall Costs -Ramp down - V2G Base Case ... 67
Table 5-4 Operating Costs -Ramp down - V2G Base Case ... 68
Table 5-5 Percent Change Operating Costs -Ramp down - V2G Base Case...69
Table 5-6 Total Overall Costs - Ramp up & down -V2G Base Case ... 70
Table 5-8 Total cost per mile according to diesel price -Ramp up & down - V2G Base Case ... 71
Table 5-7 Percent Change Overall Costs - Ramp up & down -V2G Base Case...71
Table 5-9 Operating Costs - Ramp up & down -V2G Base Case...72
Table 5-10 Percent Change Operating Costs - Ramp up & down -V2G Base Case ... 73
Table 5-11 Sensitivity analysis scenarios -Electric Vehicle...74
Table 5-12 Possible values for sensitivity scenarios - EV -Ramp down - V2G...74
Table 5-13 Scenario 1 -EV -Ramp down - V2G ... 75
Table 5-14 Scenario 2 -EV -Ramp down - V2G ... 75
Table 5-15 Scenario 3 -EV -Ramp down - V2G ... 76
Table 5-16 Scenario 4 - EV -Ramp down - V2G ... 77
Table 5-17 Scenario 5 -EV -Ramp down - V2G Total Cost per Mile ... 77
Table 5-18 Possible values for sensitivity scenarios - PHEV -Ramp down - V2G...78
Table 5-19 Scenario 1 -PHEV -Ramp down - V2G ... 78
Table 5-20 Scenario 2 -PHEV -Ramp down - V2G ... 79
Table 5-21 Scenario 3 - PHEV -Ramp down - V2G ... 80
Table 5-22 Scenario 4 - PHEV -Ramp down - V2G ... 80
Table 5-23 Scenario 5 - PHEV -Ramp down - V2G ... 81
Table 5-24 Possible values for sensitivity scenarios - EV - Ramp up & down -V2G ... 81
Table 5-25 Scenario 1 - EV - Ramp up & down -V2G ... 82
Table 5-26 Scenario 2 - EV - Ramp up & down -V2G ... 83
Table 5-28 Scenario 4 -EV - Ramp up & down -V2G ... 83
Table 5-29 Scenario 5 -EV - Ramp up & down -V2G ... 84
Table 5-30 Possible values for sensitivity scenarios - PHEV - Ramp up & down -V2G ... 84
Table 5-31 Scenario 1 -PHEV - Ramp up & down -V2G ... 85
Table 5-32 Scenario 2 -PHEV - Ramp up & down - V2G...85
Table 5-33 Scenario 3 -PHEV - Ramp up & down -V2G ... 86
Table 5-34 Scenario 4 -PHEV - Ramp up & down -V2G ... 86
Table 5-35 Scenario 5 -PHEV - Ramp up & down V2G... 87
Table 5-36 Control Panel -Best Case Scenario ... 87
1 Introduction and Motivation
Vehicle-to-Grid technology (V2G) describes a vehicle-connected grid system in which plug-in hybrid (PHEV) and electric vehicles (EV) connect to the electric grid to sell energy storage services to utilities. In a V2G system the vehicle acts as a distributed power resource, providing load and acting as a generation and storage device, through integration with the grid (Guille & Gross, 2009). The common characteristic that enables EVs and PHEVs to participate in V2G is their re-chargeable battery, the source of all or part of the energy required for propulsion. In theory, V2G could be a viable way to improve the cost-effectiveness (and promote the adoption of) EVs and PHEVs due to the fact that revenue can be generated through participating in the energy and ancillary services markets.
Our study examines the benefits of V2G at a fleet-level perspective, focusing on corporate fleets of grid-enabled electric and plug-in hybrid electric trucks that are used on a daily basis to deliver products and services. We treat the batteries in aggregate and model the revenue potential for participating in the frequency regulation market in New England. We then use this financial analysis to assess how the revenue earned through V2G can impact the overall cost of ownership of these vehicles. Finally, we assess if this potential could help promote the adoption of EVs and PHEVs in corporate fleets in the future.
Fossil fuels are currently the main source of energy for on-road transportation in the United States (US). The US dependence on foreign oil, price volatility, and the setting of oil prices by cartels has cost the economy upwards of $5.5 trillion since 1970 and US fuel prices continue to rise (MIT Energy Initiative,
2010). The rise in the cost of fuel affects not only the consumer, but businesses as well. One of the main objectives of a business is to keep its operating expenses low and fleet managers at companies such as Staples, Inc., Frito-Lay, FedEx, and AT&T have recently begun purchasing electric (Ramsey, 2010). A conversation with Mike Payette (Payette, 2011), the fleet manager at Staples, Inc. confirmed a promising future for the adoption of electric vehicles due to their low maintenance and electricity costs and overall
favorable acceptance by drivers. While electric (EV) and plug-in hybrid electric (PHEV) vehicles provide
lower overall operating costs, they continue to remain more expensive to purchase due to the high cost of
batteries and lack of proliferation in the marketplace.
As previously stated, EVs and PHEVs can plug into the grid to charge their batteries. A fleet, when
aggregated in a sizeable number, constitutes a new demand load that the electricity system must supply.
However, an EV or PHEV can be much more than a simple load due to the fact that bi-directional power
transfer is possible when an interconnection is implemented. Given the fact that vehicles remain parked
for a large part each 24-hour day, the integration with the grid allows the deployment of EVs to act as a
generation resource as well as a storage device for the system operator (Guille & Gross, 2009). In order to
maintain a reliable operation, the system operator, commonly known as an Independent System Operator
(ISO), contracts out with utilities and other suppliers for the provision of ancillary services. Such services include frequency control, regulation, load following, energy imbalance, spinning reserve, supplemental
reserve, non-operating reserve, and standby service.
Many different sources agree that regulation services will be the first step for V2G because (1) it has the
highest market value for V2G among the different forms of electric power, (2) it minimally stresses the
vehicle power storage system, and (3) battery-electric vehicles are especially well-suited to provide
regulation services (Tomic & Kempton, 2007). Regulation uses on-line generation equipped with
automatic generation control (AGC) and can quickly change output (MW/min). It tracks the
moment-to-moment fluctuations in customer loads and corrects for the unintended fluctuations in generation.
Regulation helps to maintain interconnection frequency, manage the differences between actual and
scheduled power flows, and match generation to load, or supply to demand (Kirby, 2007).
Regulation services have historically been provided by gas, coal, and fuel plants; but as the ISOs are in
continual search for cheaper, cleaner, and more reliable resources, new ways to provide these services are
geothermal, wind, and photovoltaic cells (or solar energy), as well as grid-scale batteries, compressed air, and flywheels. In addition to these alternative energies, V2G technology is becoming a possible future resource. With V2G the utility offers a capacity payment for being an available power source to the grid and an energy payment for actually supplying energy to the grid. The capacity payment is for the maximum capacity contracted for the time duration regardless of whether it is used or not. The energy payment is for the actual kWh of energy produced (Kempton & Tomic, 2004a).
In order for vehicles to participate in electricity markets, a vehicle must have the following elements: (1) a power connection to the grid to facilitate the flow of energy, (2) a control or logical connection in order to communicate with the grid operators, and (3) precision metering on-board the vehicle to maintain electricity levels (Tomic & Kempton, 2007). While the utilities will benefit from these energy sources, corporate fleets can also generate revenue through their participation in the service. The V2G market is expected to be worth around $2.9 billion by 2020 (Zpryme, 2010) and corporate fleets are expected to make up a sizeable share of the market.
For the purpose of this project, we built a business case for fleets of V2G-enabled vehicles to participate in the regulation services market. One of the main goals of a company is to increase its profitability. Through our analysis, a fleet manager can use the business case to decide whether it makes economic sense for them to adopt electric and plug-in hybrid electric vehicles in their fleet and participate in the V2G market. Our project consists of three main components: (1) a study of electric (EV) and plug-in-hybrid vehicles (PHEV); (2) an examination of the operational cost savings through operating a plug-in-hybrid or electric vehicle in lieu of a conventional vehicle; and (3) the prospective additional revenue to be gained through connecting to the electric grid and providing ancillary services.
In order to fully understand the possible opportunities of embracing V2G technology and to build a business case, we performed a thorough review of the available literature on the topic and had several meetings with industry insiders, including a market analyst at the ISO New England (Lowell, 2011), a
fleet manager for a prominent office supply store (Payette, 2011), a postdoctoral researcher on the future
of the electric grid (Heidel, 2011), an MIT lecturer from the Energy Ventures class (Hynes, 2009), the
Director of the Analysis Group for Regional Energy Alternatives (AGREA) (Connors, 2011), and the
CEO of Automotive Career Development Center (ACDC) (Van Batenburg, 2011). In addition, we explored the current rate of adoption of electric and plug-in hybrid electric vehicles as well as the factors
limiting their adoption, including their high retail cost. In order to build a business case, we broke down
each component, for each vehicle type, which adds to the operational costs of the vehicle (e.g. the cost of
the battery, yearly maintenance costs, electricity and fuel costs) as well as the lifetime of each component.
Finally, we took the appropriate components and built a ten year net present value cash flow model for
each vehicle type: an electric vehicle, a plug-in hybrid electric vehicle, and an internal combustion engine
vehicle. This cash flow model served as a working tool with the capability to be customized to a specific
fleet owner's specifications. In addition to evaluating each of the operational costs, the valuation process
also included an examination of the sources of revenue to be gained through participation in V2G, namely
regulation services. We simulated the economics of a corporation having hundreds of alternative vehicles
and identified implementation strategies for fleet managers.
Throughout this research we worked with XL Hybrids, an MIT startup based in Somerville,
Massachusetts. XL Hybrids currently retrofits commercial fleet vehicles into battery electric vehicles
through a process called hybrid conversion. Their target customer base consists of fleet owners looking to
embrace the benefits of hybrid technology. This project will help prepare XL Hybrids to capitalize on
future V2G opportunities when the company offers a plug-in hybrid conversion system starting in 2012.
XL Hybrids can use the results of our simulations to build a business case of their own. The working
simulation we develop can be used to help them decide if it is economically feasible for them to act as an
aggregator, attracting and providing the necessary services for vehicles to participate in the ancillary
owner/operators of corporate fleet vehicles, but can also have an impact on efforts to decrease the United States' dependence on foreign oil and reduce the environmental impacts of fossil fuels.
2 Literature Review
Vehicle-to-Grid (V2G) is an innovative technology that is still in its developmental stages. The benefits of
V2G are not fully understood, and the literature related to this topic is relatively scarce. The majority of available publications correspond to academic works, such as theses and research papers, lectures, conferences, interviews with pundits, and popular press articles. These resources theorize about the
potential applications and benefits of the technology and highlight some short-range experiments
employing a few vehicles. The bibliography on V2G and its related research reflects the nascency of this
field of study; the first papers date to the late 1990s and most publishing has occurred after 2006. In
addition, the literature available on the topic concentrates mostly on passenger cars, contrasting with our
corporate fleet scope.
Since V2G is a young and developing technology, the approaches and postulates concerning the field may
change. We aimed our efforts at studying the most current literature in order to gain a fundamental
understanding of the technology and its related concepts. Through this review, we attempt to document
the significant sources of information and identify the necessary knowledge needed to answer our
research question and prove our hypothesis.
2.1 An Examination of the Electric and Plug-In Hybrid Electric Vehicle Market
Electric and plug-in hybrid electric vehicles constitute research fields in themselves and we have
conducted an extensive investigation on each vehicle type. A research report by Shanker and Steinmetz
(2008) from Morgan Stanley hypothesizes that PHEVs will transform the auto industry in the next ten years; mainly due to their favorable fuel economy and reduced emissions. Unlike pure electric vehicles
which are powered by an electric motor and battery, plug-in hybrids are powered by an internal
combustion engine as well as a battery and electric motor. While hybrid electric vehicles also use an
electric motor that is powered by a battery pack, the battery on the PHEV can be recharged from the grid
approximately 20-40 miles of pure electric driving range, but can also drive long-distances due to their gasoline engine (Steinmetz & Shanker, 2008). In contrast, pure electric vehicles have an approximately
100 mile driving range with no engine to expand this range.
Markel and Simpson expand on the key benefits of PHEV technology; PHEVs are not dependent on a sole source of fuel and can achieve dramatic petroleum consumption reductions (Markel & Simpson, 2006b). These authors also note some of the barriers to widespread commercial PHEV production: the battery life, packaging, and cost. An article by Millner et al. notes the barriers of the high expense of lithium ion battery systems, the technology of choice today, which will probably remain so for some years to come (Millner, Judson, Ren, Johnson, & Ross, 2010).
Due to the fact that the battery is the most important component in these systems, more extensive research has been conducted on battery technology. The consulting firm PRTM has widely documented the options as well as the barriers for broad adoption of alternative vehicles (PRTM, 2010b). In a 2010 presentation, they clearly defined the differences between HEVs, PHEVs, and EVs, stating that they expect alternative vehicles to reach a 50% market share in the future, up notably from their current market share of less than 10%1. PRTM estimates the battery market to reach $40 billion in 2013 and $95 billion in 2020. PRTM's analysis also evaluates the evolution of battery costs for each type of technology and estimates a 50% reduction in battery prices from 2010-2020, mainly due to projected increases in the scale of operations, technological innovations, design standards, and sources (PRTM, 201 Oa).
A research report by Morgan Stanley also highlights the benefit of lithium-ion batteries for use in hybrid and electric vehicles due to their high energy capacity (contributing to more efficient packaging) and low "memory effect" leading to efficient charging and discharging times (Steinmetz & Shanker, 2008). The Boston Consulting Group (BCG) ran a study on Batteries for Electric Cars, projecting costs out to 2020. BCG also stresses the fact that battery costs will decline significantly as the production volumes increase,
but asserts that the costs of raw materials and standard, commoditized parts, which represent 25% of
overall costs, will not change with the increase in volume. Overall, BCG forecasts that the battery cost to
consumers will fall from an estimated $1,400 - $1,800 per kWh to $570 - $700 per kWh by 2020; a significant overall reduction in costs (Dinger, et al., 2010).
An article in Technology Review by Peter Fairley also estimates battery costs along a ten-year period,
beginning in 2010, and the additional costs of a PHEV over a conventional ICE vehicle. Battery costs are
expected to decrease by 50% during this period. The author makes a helpful comparison of battery
capacity, electric range (in miles) and projected price for various PHEV and EV. It also estimates the CO2
emitted per mile driven for each vehicle type. However, as most of the literature reviewed above, these
references concentrate on passenger vehicles and include estimates rather than observed measures
(Fairley, 2011).
To gain a more fleet-oriented perspective, we conducted an interview with Mike Payette, the Fleet
Equipment Manager of Staples, Inc., which has recently added 50 electric trucks to its delivery fleet. The
interview offered realistic operating data (e.g. vehicle ranges and types, operating hours, operating and
maintenance costs) that form the basis of our fleet assumptions (Payette, 2011). However, further data
were scarce and rather static, and no definitive trends or evolution in costs and performance could be
definitively discerned.
2.2 Operational Cost Savings
Alternative vehicles have been in use for more than a decade. While these vehicles generally have a
greater capital expense, PRTM estimates that by 2012, PHEVs will reach a parity with internal
combustion engine vehicles (ICE) in terms of ownership costs, including capital expenses and operating
costs (PRTM, 2010b).
Mike Ramsey (2010) presents an analysis of the operational benefits that three companies have achieved
Corp, AT&T, and a few other firms have begun employing electric delivery trucks. Currently, FedEx is employing 19 electric vehicles in London, Paris and Los Angeles; and Frito-Lay has ordered 176 electric trucks with the goal of employing 2,000 electric vehicles (half of its total fleet) in the future. These vehicles have shown to provide operating savings compared with diesel or gasoline ones, not only in fuel costs but in maintenance. According to Ramsey, the fleet equipment manager for Staples, Mike Payette, estimates that the annual maintenance costs for an electric vehicle are approximately 10% of the total maintenance costs of their diesel counterparts: $250 rather than $2,700. Electric trucks costs upwards of $30,000 more than diesel vehicles, but according to Payette the expense can be recovered in 3.3 years due to the cost savings through operating these vehicles. However, companies need to be cautious about the accuracy of these numbers due to the fact that part of the savings are due to the relatively low prices of trucks through federal grants provided to the vehicles manufacturer (Ramsey, 2010). This situation may change as electric vehicle manufacturers believe their costs are decreasing enough to not have to raise their prices after the federal grants issued to the fleets employing electric vehicles expire (Ramsey, 2010). Several researchers have attempted to develop models that take into account the variables that drive the costs of alternative vehicles, such as electricity and fuel, spare parts and maintenance costs. These models are usually aiming to determine an average operational cost and compare it to the operational costs of ICE vehicles in order to demonstrate the benefits of adopting alternative vehicles. Dr. Willet Kempton, one of the prominent researchers in the V2G field, together with Leonard Beck developed a spreadsheet model to calculate the savings and earnings from operating electric vehicles and participating in V2G (Beck & Kempton, 2008). Kempton's model considers a ten-year evaluation but makes no adjustments for the time value of money. Further, the model evaluates performance for only one or two passenger vehicles and does not highlight the potential for multiple trucks, vans and other fleet vehicles. This model became a baseline tool for our research. Throughout the course of the project we added various features to create a more extensive working tool.
2.3 Vehicle-To-Grid Technology
In order to understand V2G, one must understand key concepts in electric grid infrastructure. We had
access to the class notes from a lecture on the US Electricity Value Chain in an Energy Ventures class and
attended a presentation where the instructor explained the components of the electric grid infrastructure.
Discussion topics included an explanation of electricity generation, transmission, and distribution, grid
operation, regulatory practices, and the requirements for a smart grid (Hynes, 2009). This information
helped us more effectively incorporate the utilities and grid operators as well as the ancillary services and
regulation markets into our research.
Dr. Tim Heidel believes there are distinct opportunities for V2G: Grid-to-Vehicle and Vehicle-to-Grid.
Grid-to-Vehicle involves a very intelligent charging of the vehicle's battery serving as a regulation
service; and Vehicle-to-Grid involves the vehicle providing the grid with power. Dr. Heidel is unsure of
the prospect for V2G to become a prevalent solution in the near future. While he does not think that the
economics are favorable and the electric vehicle market has not gained enough traction to be a notable
source of energy, he believes electric vehicles can be utilized as a capacity resource for certain grid
services. Batteries can respond very quickly to signals from the grid (at a faster rate than conventional
energy resources) and thus will be paid a premium for their rapid response time. Dr. Heidel asserts,
however, that a small number of vehicles could saturate the frequency regulation market (Heidel, 2011).
Steven Connors, the Director of the Analysis Group for Regional Energy Alternatives (AGREA)
expresses a similar sentiment as Dr. Heidel. He agrees in the potential for Grid-to-Vehicle and the idea of
smart variable charging, where the vehicle can adjust to the load and charge only when the grid is able to
supply the requested energy. The vehicle is provided with the benefit of participating in regulation
services (through ramp down only) as well as purchasing electricity at a lower projected cost. In addition,
Like Dr. Heidel, Mr. Connors is unsure of the future of V2G opportunities since the price of regulation
services could diminish as the EV market proliferates, affecting the overall monetary benefits of the
Peterson et al. (2009) examine the economics of battery storage as well as the potential impacts of battery degradation through participation in V2G. They also believe that the market for regulation could be saturated by a small number of vehicles and thus explore the idea of energy arbitrage in lieu of frequency regulation. Arbitrage involves storing energy in the battery during off-peak periods for use in the grid during peak hours. Overall, they see annual profits at around $140-$150 per vehicle and around $10-$120 per vehicle when battery degradation is accounted for (Peterson, Whitacre, & Apt, 2009b). In their second article Peterson et al. (2009) determined the impact of battery degradation due to driving use and participation in the V2G market. Their results showed promising performance for the batteries as 90% of the original capacity in the battery remained after thousands of driving days (Peterson, Apt, & Whitacre, 2009a).
A paper from the 2010 MIT Energy Initiative Symposium provides good info on the current and project course of the technology and market. The study discusses the background, state-of-the-art, barriers and future of three key areas relevant to our thesis: electrification of transportation, vehicle technologies, and grid infrastructure. Its conclusions are focused on the fact that EVs and PHEVs can help address security, climate, and economic issues associated with oil consumption, but even under the most aggressive deployment scenarios, but vehicles will continue to be dependent upon oil and the ICE for years to come. Increasing the EV penetration rate substantially will require major battery cost reductions and significant build-out of vehicle charging infrastructures. (MIT Energy Initiative, 2010).
Tomic and Kempton map out the three different types of electric drive vehicles (EDVs) that can produce V2G power: battery, fuel cell, and hybrid. The authors also highlight V2G's promise as a back-up source to balance the grid's fluctuations in load and variability in supply (Tomic & Kempton, 2007). Letendre and Kempton had published an earlier article in 2002 that also explained the possible roles that EDVs and ancillary services (spinning reserves and regulation) can play and the benefits that can be gained through V2G. They believe that for battery and fuel cell vehicles, and possibly plug-in hybrids, the net value of this power is over $2,000 annually per vehicle (Letendre & Kempton, 2002). Guille and Gross (2009) also
stipulate the proposed framework for V2G and the possible services that battery vehicles can provide to
the grid. Such services include leveling the off-peak load at night as well as storage resources that can
charge and discharge energy as needed. The authors also outline the necessary steps to bring V2G to
fruition: the communication and control system between the vehicles, their aggregator, and the service
operators as well as an incentive scheme between the aggregator and the vehicles (Guille & Gross, 2009).
Finally, an article by Sovacool and Hirsh examines the possible barriers, in addition to possible benefits, that surround the adoption of V2G. Such barriers are not specifically related to technology and include
social and cultural values, business practices, and political interests. Sovacool and Hirsh imply that these
barriers are important to evaluate, on top of the technological issues, for V2G to move forward and
become a viable practice in the future (Sovacool & Hirsh, 2008).
A vehicle's battery can charge during low demand times and discharge when power is needed, i.e. when the demand for electricity has outpaced the supply (Kempton & Tomic, 2004b). Kempton defines the
economic value of V2G as the revenue that the vehicle owner can obtain through providing V2G services
to the grid operator. Some markets only pay for energy, such as peak power and base load power (power
that is provided continuously throughout the day). The revenue generated from these services is simply
the product of price and energy dispatched. According to Kempton, however, V2G is not suitable for base
load power due to the fact that this energy can be provided by large generators at a much lower cost
(Kempton & Tomic, 2004b). Other markets pay for spinning reserves and regulation services.
Even though the concept of V2G was developed more than a decade ago, the application of the
technology to fleet vehicles is practically nonexistent. We found only one paper in which this issue is
explored. Kempton and Tomic evaluate the economic potential of two utility-owned fleets of EVs to
provide power for a specific electricity market. They found that V2G power for regulation services is
profitable in the four different markets they analyzed: PJM (dispatching to all or parts of Delaware, Illinois, Indiana, Kentucky, Maryland, Michigan, New Jersey, North Carolina, Ohio, Pennsylvania,
Tennessee, Virginia, West Virginia and the District of Columbia), ERCOT (Texas), CAISO (California), and the NYISO (New York). The article coincides with our research in that the market value of regulation services, the power capacity (kW) of the electrical connections and wiring, and the energy capacity (kWh) of the vehicle's battery are important variables in the regulation service revenues. However, they reach this conclusion through the development of equations for the calculation of V2G revenues, whereas our model uses a simulation tool provided by the ISO New England (Tomic & Kempton, 2007).
Leonard Beck also conducted an economic analysis of regulation services and is in agreement with several of the other researchers that regulation service has the best near-term earnings proposition for V2G vehicles. He employs basic calculations and concepts to prove the benefits of V2G and his main focus is centered on passenger cars. Additionally, Mr. Beck is aware that the future benefits of the technology are uncertain as the potential of the regulation market can change as the market becomes saturated with V2G-enabled vehicles (Beck, 2009).
2.4 Regulation Services and the Electric Grid
This section describes the market for regulation services. An article entitled "Ancillary Services" by Hirst and Kirby (1996) explains these services using a definition from FERC (Federal Regulatory Energy Commission). FERC defines regulation as "those services necessary to support the transmission of electric value from seller to purchaser given the obligations of control areas and transmitting utilities within those control areas to maintain reliable operations of the interconnected transmission system" (p. 1) .The authors delineate the six different types of ancillary services: reactive power and voltage control,
loss compensation, scheduling and dispatch, load following, system protection, and regulation (Hirst & Kirby, 1996). For the purpose of this project, our analysis focuses primarily on regulation services. A survey of ancillary services defines regulation as "the use of on-line generation that is equipped with automatic generation control (AGC) and that can change output quickly (MW/min) to track the moment-to-moment fluctuations in customer loads and to correct for the unintended fluctuations in generation" (Kirby, 2007). Regulation helps to (1) Maintain interconnection frequency (2) Manage differences
between actual and scheduled power flow between balancing areas and (3) Match generation to load
within the balancing area (Kirby, 2007).
V2G is aimed at the EV and PHEV market. Researchers have theorized that V2G-enabled electric vehicles are ideally suited to serve the regulation and spinning reserve markets (Kempton, et al., 2008).
The regulation and spinning reserve markets pay primarily for capacity and an immediate reaction time to
requests. Batteries in a vehicle can provide energy storage as well as a quick response to either draw
power or send energy back into the grid. These unique features of V2G enabled vehicles are essential
factors for a grid system operator to consider when determining where to contract these services
(Kempton, et al., 2008). In order to participate in V2G, a vehicle must have the following elements: (1) a
power connection to the grid to facilitate the flow of energy, (2) a control or logical connection in order to
communicate with the grid operators, and (3) precision metering on-board the vehicle to maintain
electricity levels (Tomic & Kempton, 2007).
Since our analysis is based on in a region where the ISO New England manages the grid, important
references for our work include the ISO New England Manual for Operations (ISO New England, 2008),
paying special attention to the market operations and regulation market sections, and conversations with
Jonathan Lowell (Lowell, 2011), a principal analyst at the NE ISO specializing in market development.
The ISO has employed various pilot programs in regulation services in the past using various
technologies. Some of the alternative technologies involved in the past pilots include fly wheels, large
batteries, and a residential electric storage heater, which acts like an aggregator. Mr. Lowell stipulated
that the regulation market has declined in the past couple of years from $50 million in 2008 to $15 million
in 2010, signaling a small market in which it may be difficult to make a business case. In addition, Mr.
Lowell covered the three different payments that the ISO contracts out to participants in the pilot
programs: a capacity payment (a payment for being an available energy or storage source to the grid), a
service payment (a payment for the amount of energy charged or discharged), and an opportunity cost
Using the information we have gained through a review of the available literature, we seek to find ways for V2G to work in the corporate fleet environment. We built a business case that will provide fleet managers solid reasons to adopt or not adopt this technology as they plan for the future.
3 Methodology and Model Overview
The economic viability of V2G is based on technological advancement, energy policy, and operations
management. The availability of components and equipment, the expertise to bring the system to fruition, and the legislation and regulation that determine the way in which the technology will operate are the
backbone of V2G economic model. As previously mentioned, the scope of our research is to assess the
business case for corporate fleets incorporating V2G opportunities, and our efforts are focused on
developing a projected cash flow model of the topic. No special emphasis is placed on technological
advances. In addition, we do not discuss policy matters, possible tax credits and other incentives, which
could offset the fleet's operating costs. Rather we assess different operating approaches using the
near-term technological and policy context.
In order to evaluate a system, various modeling techniques can be employed. Some projects use physical
models that mimic the physical behavior of the real system by providing, for example, a smaller replica of
it. However, when a physical model is neither effective nor possible, as in the V2G case, due to its
technological and conceptual infancy and high cost of implementation, analysts resort to analytical
models. An analytical model is an abstraction of the real system and tries to capture its essence to assess
key issues. A great benefit to this type of model is that it measures how the system is affected by these initial parameters without actually implementing the system. The analyst can analyze the project by trial
and error in a relatively short period of time, which would be very difficult to implement with a real
system due to time and cost constraints. In order for a fleet manager to consider a big change such as
V2G, they must be able to achieve a high degree of certainty that their daily operations will not be adversely affected and the efforts required to incorporate this new process will benefit their bottom line.
The ability to run a model with various inputs to reflect different scenarios will enable the analyst to be
We modeled the economics of the investment, infrastructure, and operating costs as well as the potential
grid revenues for each type of vehicle (Electric, Plug-in Hybrid Electric, and Internal Combustion Engine)
through a ten year projected cash flow model. We use simulation (See Section 3.2) as the tool to assess
the grid opportunities for corporate fleets to adopt this technology.
The costs and revenues for each vehicle were modeled with a standard fleet size and compared using the
Net Present Value (NPV) at a 10% discount rate. The 10% discount rate is based on the 10 year Treasury
note, which is yielding around 3%, plus a 7% risk premium due to the fact that this is a high-risk business
proposition with a lot of unknown variables. The NPV analysis provides the fleet manager with a distinct
figure of the total overall costs and V2G revenue for the ten year period. Figure 3-1 shows an example of
a cash flow model for the PHEV. Appendix 1 presents the cash flow models for the best case scenario2 of
ramp up & down for each type of vehicle: EV, PHEV, and ICE.
Capital investment 14,850,000 Infrastructure Cost 0
Electricty cost 67,405 67,405 67,405 67,405 67,405 67,405 67,405 67,405 67,405 67,405
Fuel cost 1,459,079 1,459,079 1,459,079 1,459,079 1,459,079 1,459,079 1,459,079 1,459,079 1,459,079 1,459,079
Battery replacement costs 0 0 0 0 0 0 0 0 0 487,500
ControllerCosts 0 0 0 0 0 0 0 0 0 0
Charger, wiring, switches, adapterCosts 0 0 0 0 0 0 0 0 0 0
Brake Costs 0 0 0 0 0 300,000 0 0 0 0
Engine Costs 0 0 0 0 0 0 0 0 0 0
Electric Motor/Generator Costs 0 0 0 0 0 0 0 0 0 0
Maintenance Costs 1,407,715 1,407,715 1,407,715 1,407,715 1,407,715 1,407,715 1,407,715 1,407,715 1,407,715 1,407,715
Total Costs 14,850,000 2,934,199 2,934,199 2,934,199 2,934,199 2,934,199 3,234,199 2,934,199 2,934,199 2,934,199 3,421,699 Capacity payment 159,062 159,062 159,062 159,062 159,062 159,062 159,062 159,062 159,062 159,062
Service payment 324,303 324,303 324,303 324,303 324,303 324,303 324,303 324,303 324,303 324,303 Total payment 483,365 483,365 483,365 483,365 483,365 483,365 483,365 483,365 483,365 483,365
Regulation revenue afterdeductingaggregatorfee 483,365 483,365 483,365 483,365 483,365 483,365 483,365 483,365 483,365 483,365
Net cashflow -14,850,000 -2,450,834 -2,450,834 -2,450,834 -2,450,834 -2,450,834 -2,750,834 -2,450,834 -2,450,834 -2450,834 -2,938,334
Net Present Value -30,266,606
Figure 3-1 Cash Flow Model Example
The next section discusses the theoretical and practical background of the different cost components
included in the cash flow model and the appropriate parameters required to model them. The following
section describes the simulation tool used to project V2G revenues. The specific parameters we selected
for our analysis are given in Chapter 4.
2 See Chapter 5 for a description of simulated scenarios and cases. 24
3.1 Costs Components
The costs are limited to the products and services that a company must pay to operate its fleet. We
organized the costs in our analysis into three subgroups: capital costs, infrastructure costs, and operating
costs. Operating costs include nine components listed in Table 3-1. We describe each cost component
below.
ICaital c
Table 3-1 Cash flow model cost com onents
osts
X
X
X
Infrastructure costs
X
X
Operating costs
Electricity
X
X
Diesel
X
X
Battery
X
X
Controller X XCharger and wiring X X
Brakes X X X
ICE Engine X X
Electric Motor/Generator X X
Maintenance X X X
3.1.1 Capital
A truck fleet can be classified according to various parameters: weight, purpose, fuel efficiency, etc. Our research characterizes the fleet by the drive train -the set of components that propel the vehicle. In a
traditional ICE, the engine is the sole source of propulsion. Adding an electric motor to the drive train
drive enables the use of electricity for propulsion and creates three classes of vehicles: Hybrid Electric
(HEV), Plug-in Hybrid Electric (PHEV), and Electric (EV) (MIT Energy Initiative, 2010). As depicted in
Figure 3-2, each vehicle has a different blend of fuel and electric propulsion. Our thesis considers EVs
Degree of Electrification
0 -- -- -- -- - -- --- -- 1-
0 0 W0 0
Gasoline/Diesel Gasoline/Diesel and Electricity
input electricity input input
Figure 3-2 Degree of Electrification for Vehicle Types (MIT Energy Initiative, 2010)
A company can lease or purchase a new or used vehicle. In the case of EVs and PHEVs, the vehicle can be manufactured as a hybrid or electric vehicle, or it can be retrofitted to become a hybrid or electric
vehicle. For the basis of this thesis we assumed that the company purchases new vehicles, originally
manufactured to operate as an EV, PHEV, or ICE, in year zero; and thus the capital investment is the cost of the new delivery vehicles.
As outlined in the literature review, there are several differences between EV, PHEV, and ICE vehicles.
EVs are powered by an electric motor and a re-chargeable battery. These vehicles use the energy stored in
the battery as the source for propulsion. PHEVs, in contrast, are powered by an internal combustion
engine, anctrd motorid a eechargeable battery. PHEVs have approximately 20-40 miles of pure
electric driving range, but can also drive long-distances due to their internal combustion engine (Steinmetz & Shanker, 2008). For example, if a PHEV needs to serve a 100 mile route, it has the ability
to travel the first 20-40 miles in full electric mode. Once the battery is drained, it can switch over to
hybrid mode for the remaining 60-80 miles. The PHEV also has the "start-stop" functionality. After the
vehicle is idle for a specific amount of time, for instance stopped at a red light or in bad traffic, the
combustion engine shuts down, improving fuel economy (J.D. Power and Associates, 2011). The batteries
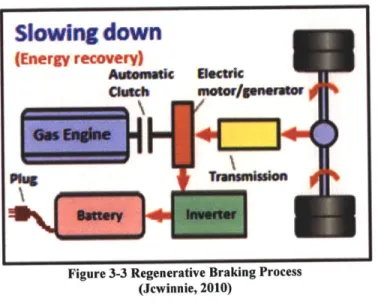
One of the main characteristics that separate plug-in hybrid electric and electric vehicles from ICE
vehicles is the regenerative braking process. In an ICE, the energy that is used to stop the vehicle
dissipates into the air as heat. In contrast, when the vehicle is braking, the electric motor on a PHEV and
EV acts as an electric generator and kinetic energy can be converted into electric energy and stored in the
battery. Thus, braking can provide energy (in the form of electricity) for future use at zero cost to the
driver. In effect, the regenerative braking process provides the driver the benefit of purchasing less
electricity than is required for full operation. Figure 3-3 depicts the regenerative braking process.
Slowing dowm
(Energy recovery)
Figure 3-3 Regenerative Braking Process (Jcwinnie, 2010)
In order to determine which components to include in the cash flow model, we made use of the literature
concerning the different vehicle types as well as the interview with Mike Payette, the Fleet Equipment
Manager for Staples, Inc. Mr. Payette operates a fleet of over two thousand delivery vehicles, including
over 50 electric delivery trucks (Payette, 2011). Figure 3-4 shows one of the electric vehicles currently
igure .3-4 stapies' Liectric venicle (Auto parts marketplace, 2010)
Through the American Recovery and Reinvestment Act (or "Stimulus Bill"), the federal government offers subsidies for EVs and PHEVs. Some states also offer subsidies. Buyers of plug-in hybrid and electric vehicles benefit from a tax credit ranging from $2,500 to $7,500, depending on the size of the vehicle's battery. On the low end of the spectrum, vehicles with a 4 kWh battery pack will qualify for a
$2,500 tax credit. This credit maxes out at $7,500 for vehicles with a 16 kWh battery pack (Berman, 2011). An additional $200 tax credit is added for each Kilowatt-hour thereafter the 16 kWh limit (Center for Sustainable Energy California, 2010). Some states such as California, Delaware, and Georgia, offer
additional incentives. For our thesis, no additional state incentives were included. While outside the scope of this research, it is worth mentioning that a driver or a company that converts a vehicle into a plug-in
hybrid or electric vehicle receives a tax credit equal to 10% of the conversion cost, up to a maximum
credit of $4,000 for a $40,000 conversion. These credits are only available until December 31, 2011.
Individual states, such as Colorado and Florida, provide additional incentives, such as rebates and state
tax credits (Berman, 2011).
The overall capital investment is equal to the cost per vehicle (less the subsidy) times the fleet size. Other
already included in the vehicle price and are only applicable cost factors when they reach their maximum
lifespan.
3.1.2 Infrastructure
The charging infrastructure will play a key role in consumer acceptance of alternative vehicles, especially
those with a high electrification requirement, and the standards for EV-to-grid communication are still
undergoing revision. Because the electrification requirements of EVs are still unclear, it is difficult to
determine how much or what type of infrastructure is needed to support EVs. There is agreement that the
lack of public infrastructure will impede EV market penetration but disagreement on timing and degree of
public support for its development (MIT Energy Initiative, 2010).
Changes in infrastructure depend on the desired charging speed, which is defined by the capacity of the
charger (kW/vehicle) (Section 3.1.3 discusses chargers in more detail). Fast charging requires an
industrial-type electric service (voltage greater than 208 V and amperage above 15 A). According to
Craig Van Batenburg, CEO of ACDC (Automotive Career Development Center), fast charging produces
a high energy loss, which is converted directly into heat. This heat could harm the battery pack and
related electronics and cooling equipment must be used to cool down the system (Van Batenburg, 2011).
While the above factors make fast charging stations more complicated and expensive for the consumer, the government is providing incentives for their implementation. In late December 2010, the federal
government continued the tax credit for installation of home-based charging equipment, set to expire at
the end of 2011. EV buyers can now claim a credit of 30% of the purchase and costs of the charging
equipment, up to $1,000 for individuals and $30,000 for businesses, and these rules are in effect until
December 31, 2011 (Berman, 2011).
Accounted for in year zero of our projected cash flow, this up-front cost depends on the fleet size (one
charging station per vehicle), the cost of each charging station (depending on the level of charge), and the
3.1.3 Operation
The operating costs are organized into nine different components, which we describe next. These costs can be considered as variable costs since they are assumed during fleet operation (253 days/year), not while sitting idle.
3.1.3.1. Electricity
In our analysis, EVs and PHEVs utilize electricity as energy for propulsion. EVs are propelled solely by electricity, whereas PHEVs are able to run a pre-determined number of miles in only-electric mode, and automatically switch over to hybrid mode3.
The electric grid is a network of high-power transmission lines and "last mile" distribution lines that deliver energy to residential and commercial customers. The ISO New England market features eight "Zones" and nearly 500 "Nodes" each with its own Locational Marginal Price (LMP). Nodal prices vary by time of day, season, and location within the New England region. For example, the price of electricity may be trading at $63 per Kilowatt-hour in Cambridge, Massachusetts, and the same hour the price could be $58 in Maine. In Cos Cob, Connecticut, electric prices in the summer can range from $3 to over $300 per Kilowatt-hour in a single day, while winter prices may only top out at $270 (Saran & Siegert, 2009). Table 3-1 depicts the LMP, in dollars per MWh, for each hour of the day, for the week between May 1, 2008 and May 7, 2008. The prices are for the Massachusetts hub and are most likely lower than the prices set in urban settings, such as Boston.
The cost of electricity also depends on the battery state of charge (SOC) and size of the battery. The electricity necessary to fully charge the batteries is aggregated for the workdays and fleet size. This amount of electricity is affected by the charger efficiency and regenerative braking efficiency (Described in Section 3.1.3.6). The final amount of energy (including all adjustments) is paid at the LMP, which depends on the location, hour, and day when charging occurs.
3 When PHEVs cease operating in only-electric mode, they do not switch over to a pure diesel mode. During this
period, the regenerative braking produces some electricity that the vehicle employs to assist some phases of driving. 30
15
97.23
121.94
86.23
10 0.121,4
16
93.1
5.7
74
94.8915k
17
99.77
16M
89.98
113.23
18
98.01
07 8
92.6
121.11
171
19
90.15
114.64
93.46
107.35
134.2
14.1
1306
20
93.71
14.4
106.21
119.1
1IO
0
21
131.61
93.49
124
22
133.07
97.78
120.33
121.93
23
8.52
98.15
92.83
93.03
104.1
99.49
106.69
24 ,
134.3
86.63
97.58
129.69
92.16
ISO New England
3.1.3.2. Diesel
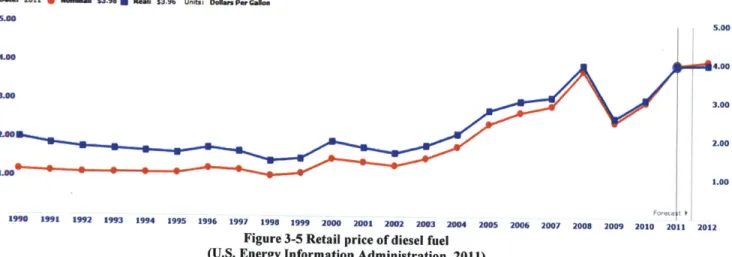
Currently, fossil fuels are almost the exclusive source of energy for the transportation system in the
United States (US) and the price of fuel is volatile. The US dependence on foreign oil, price volatility,
and the setting of oil prices by cartels has cost the economy upwards of $5.5 trillion since 1970 (MIT
Energy Initiative, 2010). Our cash flow model shows the cost of diesel to assume up to 65% of the
operating costs for the ICE and 60% for PHEV. Figure 3-5 exhibits the behavior of diesel real prices in
Dul 2011 I smra $3-E98 ieek $3.96 Unitsi Done Per Gala 5.00 5.00 4.00 3.M 3.00 2.000 L.a i 1.00 1990 1991 1992 1993 1994 1995 1996 1997 1998 1999 2000 2001 2002 2003 2004 2005 2006 2007 2008 2009 2010 2011 2012
Figure 3-5 Retail price of diesel fuel (U.S. Energy Information Administration, 2011)
Overall, diesel consumption depends on the number of miles driven per year and the ICE mode efficiency
determines how much fuel is necessary to cover this mileage. The cost of fuel per gallon defines the total
cost of fuel per year. For the PHEV, the mileage corresponds only to the number of miles operated in
hybrid mode. As regenerative braking produces some energy to assist in driving, the fuel efficiency is a specific value for the PHEV.
3.1.3.3. Battery
Of utmost importance to a fleet operator is the ability to run their operations without interruption. A fleet manager, faced with the decision of whether or not to purchase electric vehicles for their fleet, wants to be
certain that their operations will not be interrupted by a vehicle running out of energy. Moreover, they
would want to ensure that the battery size for the electric vehicle corresponds to the number of miles
driven. Thus, the battery selection becomes one of the most important decisions in an electric vehicle.
Although there are several different types of batteries, we focused our research on lithium-ion batteries.
Absent a major future technological breakthrough in battery chemistry, Li-ion batteries will most likely
be the battery technology of choice for the near future (MIT Energy Initiative, 2010). Lithium-ion
market. For further reading on lithium-ion chemistry and its properties, please consult Dinger, et al., 2010
and Peterson, Apt, & Whitacre, 2009a.
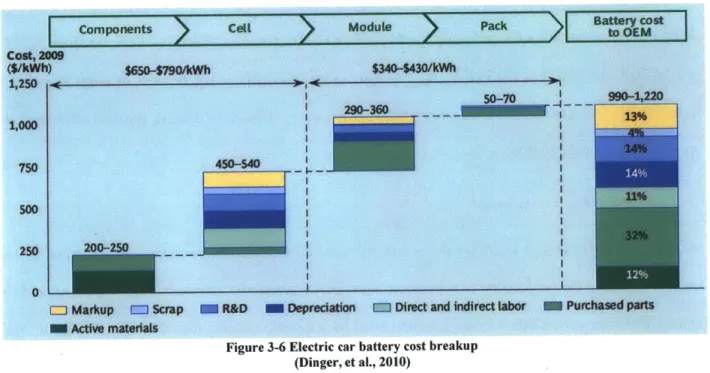
The cost of the battery is perhaps the biggest deterrent for the commercial viability of electric cars.
Sources estimate the current cost of lithium-ion battery packs at between $1,000 and $1,200 per kWh
(Dinger, et al., 2010). Actual cost data from manufacturers is not publicly available, however, because of
proprietary restrictions (MIT Energy Initiative, 2010). This significant cost, even when distributed over
the life cycle of the vehicle, can easily be more than the cost of the electricity. Figure 3-6 shows the
estimated breakdown of the battery cost in terms of materials, R&D, labor, etc.
Components Cell Co-t,2-($/kWh)
1,250
<
1100f
750 50 250 0Module
Pack
Bti
$340--430/kWh
SO-70
200-250
J Markup E Scrap R&D
-
Depreciation r- Direct and indirect labor-
Purc = Active matedailsFigure 3-6 Electric car battery cost breakup (Dinger, et al., 2010)
I
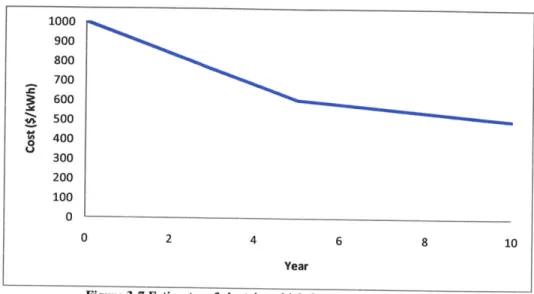
Nevertheless, significant cost reductions are anticipated for lithium-ion batteries. As a consequence of
increased manufacturing volume, the impacts of federal subsidies, and technological advancement, batteries for automotive use are expected to follow a descending trajectory (MIT Energy Initiative, 2010),
with $500/kWh attainable by 2020, and even greater declines thereafter (Fairley, 2011). $650-ta90wh