HAL Id: inserm-00809395
https://www.hal.inserm.fr/inserm-00809395
Submitted on 9 Apr 2013HAL is a multi-disciplinary open access archive for the deposit and dissemination of sci-entific research documents, whether they are pub-lished or not. The documents may come from teaching and research institutions in France or abroad, or from public or private research centers.
L’archive ouverte pluridisciplinaire HAL, est destinée au dépôt et à la diffusion de documents scientifiques de niveau recherche, publiés ou non, émanant des établissements d’enseignement et de recherche français ou étrangers, des laboratoires publics ou privés.
Access to healthcare of excluded people in 14 cities of 7
European countries
Pierre Chauvin, Nathalie Simonnot
To cite this version:
Pierre Chauvin, Nathalie Simonnot. Access to healthcare of excluded people in 14 cities of 7 European countries. Médecins du Monde/Doctors of the World International Network, pp.91, 2013. �inserm-00809395�
April 2013
Argentina Belgium Canada France Germany Greece Japan Netherlands Portugal Spain Sweden Switzerland United Kingdom United States of America
Access to healthcare of excluded people
in 14 cities of 7 European countries
Final report on social and medical data collected in 2012
Photo: Alfredo Matilla
Pierre CHAUVIN
MD PhD, Social epidemiologist, Director of research at INSERM (French National Institute of Health and Medical Research), Social Determinants of Health and Health Care Unit
Nathalie SIMONNOT
Acknowledgements
This report could not have been edited without the contributions of many people involved in the data base collection and analysis - especially Marion SOLER at INSERM, Olivier CHEMINAT at Médecins du Monde, Frank VANBIERVLIET and Yves BAULAC at Doctors of the World International Network, and all the coordinators of the different MdM programmes where the data collection took place.
This work is supported by the French Ministry of health-DGS and by the European Programme for Integration and Migration (EPIM), a collaborative initiative of the Network of European Foundations. The sole responsibility for the content lies with the authors and the content may not necessarily reflect the positions of NEF, EPIM, or the Partner Foundations.
Suggested citation:
Chauvin P, Simonnot N. Access to healthcare of excluded people in 14 cities of 7 European countries. Final report on social and medical data collected in 2012. Paris, Médecins du Monde/Doctors of the World International Network, 2013, 65 p.
Table of contents
Acknowledgements ... 2
Key figures ... 4
Introduction ... 6
Methods ... 9
Statistics ... 10
Demographics and countries of origin ... 11
Legal status ... 17
Reasons for migration ... 21
Homophobia: a reason for migration ... 21
Living conditions ... 23
Housing conditions ... 23
Available emotional support ... 25
Work and income ... 26
Violence... 27
Access to healthcare ... 32
Coverage of healthcare costs ... 32
Barriers to accessing healthcare ... 34
Language barriers ... 38
Limited mobility due to the fear of being arrested ... 38
Denial of access to healthcare ... 39
Racism in health structures ... 40
Giving-up seeking health care ... 42
Health conditions ... 43
Reasons for consulting MdM clinics ... 43
Perceived health status ... 44
Health problems ... 47
Chronic diseases and essential treatments ... 49
Urgent care ... 53
Access to care for pregnant women ... 54
Access to vaccinations... 57
Serological status ... 60
Conclusion: Time for action ... 63
Tables of tables and figures ... 64
4
Key figures
Data was collected in 2012 in 14 cities (7 countries) through direct interviews with 8,412persons (19,302 contacts including 10,968 medical consultations; 11,921 diagnoses).
54.0% were male
Median age was 34 years; 8.2% were 18 years old or less, and 7.7% were over 60 years old (27.7% in Perama-Greece)
25.1% were EU citizens among whom 9.4% were nationals (up to 88.0% in Perama-Greece)
55.1% of the EU citizens were not permitted to reside in the host country, 20.8% were in the host country for less than 3 months, 17.9% were permitted to reside after 3 months stay
61.0% of all MdM service users were not permitted to reside in the host country (between 22.3% in Greece and 89.7% in Amsterdam)
Of the reasons given for migration, personal health reasons represented 1.6%, escaping from war 5.8% and economic survival 42.8%.
49.2% had unstable or temporary housing
One third of the patients said that their housing was affecting their health or their children’s health (56.9% in Greece)
52.3% of the patients had a low emotional support, including 14.2% who could never rely on anybody
23.9% had a job but the vast majority declared that their income was not sufficient for basic needs (over 70% in Greece and Spain)
6.8% of the patients were asked about their personal experience of violence
o 40% of the respondents had lived in a country at war; 1/5 had been physically threatened, imprisoned or tortured because of their ideas; 1/5had been victim of violence from the police or army forces; 40% had been beaten up; 22% had been confronted with psychological violence; 8% had been sexually assaulted and 5% raped.
o 26.6% of the respondents reported having suffered of violent acts after their arrival in the host country
80.7% had no possibility to access care without paying full costs on the day we met them
76.9% reported at least one barrier in accessing health care. The 2 most cited barriers were a lack of knowledge of one’s own rights or understanding of the health system (21.2%), and administrative problems (19.9%)
o Expensive cost of consultation, treatment or deposit constituted 20% of the barriers cited by nationals or EU citizens
o Fears of being reported or arrested constituted 6.6% of the barriers cited by undocumented migrants
About 40% of the patients needed an interpreter. MdM managed mostly to get one as only 7% to 13% of the consultations in need were made without an interpreter
65.9% of the migrants with precarious administrative status declared that they limited their activities and movements due to the fear of being arrested
One patient in five reported having been denied access to care by a healthcare provider in the last 12 months (up to 61.9% in Spain)
5
11.3% of the patients belonging to ethnic minorities in Greece, 8.5% in Spain and 6.9% in Amsterdam had been confronted with racism in a healthcare structure in the last 12 months
35.8% of the patients had given up seeking healthcare in the last 12 months
65.6% of the patients consulted MdM for medical reasons, 32.4% came for administrative, legal or psychosocial issues
25.8% of the patients had a bad or very bad perceived health status
o 28.0% declared a bad or very bad mental health. Mental health was particularly damaged in Greece where this proportion was 50.8%
o Altogether 66.7% of MdM service users declared a low perceived health status (i.e. very bad, bad or fair), which is much higher than what is observed in immigrants over 50 years old in Europe (37.8%) even though they are much younger in MdM programmes (median age = 34 years)
Hypertension, diabetes, back symptoms, teeth or gum problems, abdominal pain, pregnancy, upper respiratory infection, depression and anxiety, and cough were the 10 most frequent diagnoses (among the total number of 11921 diagnoses reported by the doctors)
Half of the medical consultations were for urgent (18%) or fairly urgent (32%) cases
Chronic diseases concerned 61.4% of all the diagnoses made; 51.6% of the patients seen by a doctor had at least one chronic disease
o Medical doctors considered that 62.5% of their consultants needed a “necessary” treatment and 23.3% a “precautionary” one
o 75.9% of all the diagnoses made during the medical consultations required a “necessary” treatment
o 54.6% of the patients had at least one health problem which required a necessary treatment and was not being dealt with or treated at all at the time of the consultation o 10.5% of the migrants had a chronic disease that they knew of before migrating
5.9% of the women seen by MdM were pregnant.
o When interviewed about their access to care, 59.3% of the pregnant respondent did not have access to antenatal care when we met them, and
o 46.7% did not receive care timely (i.e. after the 12th
week of pregnancy)
Around 10% of the children were surely not vaccinated for tetanus, HBV and MMR; another 10 to 17% had an unknown vaccination status
14% of adults were surely not vaccinated against tetanus and 19.4% against HBV; another 28.4% and 33.6% had unknown vaccination status respectively
6
Introduction
Faced with the economic crisis, many governments have cut back on social and health spending despite the fact that the number of people in need of support and social protection is higher than ever. In the long term, such budgetary restrictions are counterproductive. This has been highlighted by the World Health Organisation (WHO) in the Tallinn Charter recommendations which point to the fact that ensuring health is a key factor for economic development and wealth,1 “[…] Beyond its intrinsic value, improved health contributes to social well-being through its impact on economic development, competitiveness and productivity. High performing health systems contribute to economic development and wealth” […] “We, the member states commit ourselves to: promote shared values of solidarity, equity and participation through health policies, resource allocation and other actions, ensuring due attention is paid to the needs of the poor and other vulnerable groups[…].”
Furthermore, the 2011 WHO Rio Political Declaration on Social Determinants of Health2 clearly states, “We understand that health equity is a shared responsibility and requires the engagement of all sectors of government, of all segments of society, and of all members of the international community, in an ‘all for equity’ and ‘health for all’ global action.”
The European Parliament has acknowledged that healthcare is not available to all. In its resolution3 dated the 8th of March 2011, the European Parliament clearly stated that, “[…] equitable access to healthcare is not secured, not only in practice but also in law, for undocumented migrants in many EU countries. […] The European Parliament calls on Member States to ensure that the most vulnerable groups, including undocumented migrants, are entitled to and are provided equitable access to healthcare.”
In the same way, the European Union Agency for Fundamental Rights (FRA)4 also stresses upon the fact that, “As EU member states, faced with an ageing population and the repercussions of a global economic crisis, struggle to contain public health expenditure, the right to health for all - regardless of legal status - must remain a key concern”.5
Soaring unemployment rates6, rising child poverty, people losing their homes because of insolvency every month… The social welfare systems in Europe are quaking under the strain. Whereas most European countries have in recent years been host countries for immigrants, an increasing number of
1 June 2008: http://www.euro.who.int/__data/assets/pdf_file/0008/88613/E91438.pdf 2
October 2011: http://www.who.int/sdhconference/declaration/Rio_political_declaration.pdf
3
In this resolution, the European Parliament stresses that, “[…] health inequalities are not only the result of a host of
economic, environmental and lifestyle-related factors, but also of problems relating to access to healthcare[…]”; furthermore, “[…]equitable access to healthcare is not secured, not only in practice but also in law, for undocumented migrants in many EU countries”. The European Parliament calls on member states, […] to ensure that the most
vulnerable groups, including undocumented migrants, are entitled to and are provided equitable access to healthcare[…] to assess the feasibility to support healthcare for irregular migrants by providing a definition based on common
principles for basic elements of healthcare as defined by their national legislation; […] to ensure all pregnant women and children, irrespective of their status, are entitled to and effectively benefit from social protection as defined in their national legislation”. See: http://www.europarl.europa.eu/sides/getDoc.do?type=TA&reference=P7-TA-2011-0081&language=EN&ring=A7-2011-0032
The Charter of Fundamental Rights of the European Union clearly stipulates in the Article 35 (which covers health care) that “Everyone has the right of access to preventive health care and the right to benefit from medical treatment under the
conditions established by national laws and practices. A high level of human health protection shall be ensured in the definition and implementation of all Union policies and activities”.
5
http://fra.europa.eu/fraWebsite/research/publications/publications_per_year/2011/pub_irregular-migrants-healthcare_en.htm
6 According to the latest Eurostat figures, the highest increases in unemployment were registered in Greece (18.9% to
26.0% between September 2011 and September 2012), Cyprus (9.5% to 14.0%), Spain (23.0% to 26.6%) and Portugal (14.1% to 16.3%). In November 2012, the youth unemployment rate (under 25 years old) was 23.7% in the EU-27. In Greece 57.6% of young people are out of work (September 2012), while in Spain the figure is 56.5%. See
http://epp.eurostat.ec.europa.eu/statistics_explained/index.php/Unemployment_statistics#Recent_developments_in_unem ployment_at_a_European_and_Member_State_level
7
European citizens are now pushed to economic migration, both within Europe and beyond. The crisis has generated austerity measures that have had a deep impact on all social safety nets, including healthcare provision, in an unprecedented way.
In its 2012 report7 “Health policy responses to the financial crisis in Europe”, the WHO classified the global financial crisis that began in 2007 as a health system shock or “an unexpected occurrence originating outside the health system that has a large negative effect on the availability of health system resources or a large positive effect on the demand for health services”. The WHO further warned that “cuts to public spending on health made in response to an economic shock typically come at a time when health systems may require more, not fewer, resources – for example, to address the adverse health effects of unemployment”. Measures such as reducing the scope of essential services covered, reducing population coverage, increasing user charges for services and reducing the number of health providers were specifically identified as policy tools that undermine health system goals. Nevertheless, many Member States have raised the share of out-of-pocket expenditure for patients. As a consequence, people delay or even abandon seeking healthcare. According to a report published by the OECD in 2011, the most common reason mentioned in Greece and Portugal for self-reported unmet needs is the cost8. According to the OECD, 25% of the Portuguese population still reports unmet needs for dental care. In 2012, 36% of the people who came to MdM clinics had given up seeking healthcare at least once.
The Spanish Government reduced spending on health and education by €7 billion in 2012. In its memorandum signed with the Greek government, the Troika9 specified that public health expenditure should not exceed 6% of gross domestic product10 (versus 10.6% in 200911).
In theory, Greece’s universal public healthcare system entitles insured people on a very low income to visit general practitioners free of charge and to get medicine for free but a lot of people do not get the necessary “welfare card” allowing them not to pay upfront, mainly because of the complexity of administrative procedures in Greece. Since October 2010, all public hospitals impose a €5 entrance fee and further examinations also have to be paid for – a measure that excludes many people. Many hospitals in Greece lack staff, basic equipment and supplies. Pharmacies often lack supplies and demand that customers pay cash upfront, as the state owes them a lot of money. According to Greek journal Kathimerini, these debts were as high as €250 million at one point last year12
.
As vaccinations now have to be paid for, many children do not get any, which not only puts their health at risk but also prohibits them from accessing school. In the MdM polyclinics in Greece13 – which deliver healthcare to the most vulnerable – nearly half of the patients are now Greek citizens (up to 88% at one of them). Many of them have passed retirement age (at the same polyclinic up to 28% are over 60 years old). Their pensions have been cut almost in half due to the austerity measures. There is no doubt that the efficiency of Greece’s healthcare system could be greatly improved. However, current austerity measures imposed by the Troika seem more likely to exacerbate the general collapse of the health system instead of preventing it.
7
See www.euro.who.int/__data/assets/pdf_file/0009/170865/e96643.pdf
8
OECD. Unmet health care needs. In: Health at a glance 2011: OECD indicators. Paris, OECD, pp. 130-131, available at
http://www.oecd-ilibrary.org/social-issues-migration-health/health-at-a-glance-2011/unmet-health-care-needs_health_glance-2011-52-en
9
Name given since the beginning of the crisis to the working group of the European Commission, European Central Bank and International Monetary Fund.
10
See Government of Greece (2012), Letter of Intent, Memorandum of Economic and Financial Policies, and Technical Memorandum of Understanding.
11
See OECD Health Data 2012, www.oecd.org/els/health-systems/oecdhealthdata2012-frequentlyrequesteddata.htm
12
See www.ekathimerini.com/4dcgi/_w_articles_wsite1_1_22/05/2012_443402
13
8
Obtaining access to healthcare for destitute EU nationals living in an EU country other than their own has become an administrative nightmare. In most cases, they are unable to obtain healthcare aid and have to pay 100% of the costs. All they can do is to hope for a hypothetical reimbursement from their home country’s social security scheme – under the conditions that they find the right forms and provide all of the required documents. Non-EU citizens with social security/national healthcare insurance coverage from one EU country who seek healthcare in another EU country face the same obstacles (i.e., a Moroccan woman with social security in Spain living in France). Because all of these barriers hinder timely access to treatment, they lead to increased human and financial costs.
People confronted with numerous vulnerability factors were already facing major health inequalities before the economic and financial crisis hit Europe. Earlier MdM surveys indicated that financial inaccessibility of care for patients led to unmet needs that vastly surpassed the average level of unmet needs of the population of any EU Member State. For instance, in 2011 the MdM France medical teams14 found that in a sample of 1,547 patients, 38% should have been treated earlier.
These figures confirm those from an earlier comparative survey across 11 EU countries (2008) that showed that 25% of the MdM patient population received treatment late (this number rose to 33% for patients with chronic health conditions, such as diabetes and hypertension).
Before the crisis, people confronted with numerous vulnerability factors already reported their perceived state of health to be up to three times poorer than that of the average population across Europe15. Now the MdM teams in Greece and Portugal are faced with patients who have to choose between eating and buying their medicines.
Due to the budgetary cuts, vulnerable groups are now even less likely to receive the necessary attention from healthcare providers, although the number of people facing precarious living conditions is increasing. For instance, in Greece, the legal entitlement to healthcare for the few asylum seekers who manage to formally apply for asylum is far from guaranteed. Undocumented migrants only have access to emergency treatment, but due to the enormous strain on the Greek health system, even this is often not possible anymore.
In 2012, the Spanish government excluded adult undocumented migrants (including the chronically and severely ill) from public healthcare, thereby ignoring the direct and indirect economic benefits of health promotion and prevention for the most vulnerable populations.
In Portugal, the lack of information about the new regulations reduces access to healthcare. For example, homeless people who have not declared their income have no way to prove they have a right to be exempted from the usual co-payment.
On top of all this, many NGOs taking care of the health needs of vulnerable people are also facing important budget cuts, both from private donors and from the State. Several MdM associations that partially depend on government subsidies are finding it hard to cope. For instance, MdM Portugal has had to close eight domestic programmes because of lack of funding from the State. MdM Spain has had to considerably reduce the number of contracted staff and has also had to close quite a few programmes.
We hope that this report will shed a new light on the situation of the persons who, in Europe in 2012, could not access healthcare professionals in the mainstream system. We hope that this report will help to bring changes in the laws and practices which deny one of the fundamental human rights, the right to health. 14 See http://www.medecinsdumonde.org/Publications/Les-Rapports/En-France/Observatoire-de-l-acces-aux-soins-de-la-mission-France 15
Baert K, De Norre B. Perception of health and access to healthcare in the EU-25 in 2007. Brussels, Eurostat (Statistics in focus), 2009, no 24.
9
Methods
In 2006 and 2008, the Doctors of the World European Observatory16 on access to healthcare conducted two surveys that specifically looked at the condition of undocumented migrants in Europe.17,18 These past surveys were based on samples of MdM patients in various European countries. Three years later, in 2012, the Observatory has presented data on the living conditions of all of the patients, including undocumented migrants, seen in 2011 at MdM free clinics in 5 European cities: Amsterdam, Brussels, London, Munich, and Nice19. It was then the first analysis ever made by the Observatory that was based on information on living conditions and health data collected routinely (and not only among subsamples of patients) in our clinics.
One year later, we are pleased to present in this document the analysis and main results observed on data collected in 14 cities located in 7 European countries: Brussels and Antwerp in Belgium, Nice in France, Munich in Germany, Athens, Perama, Patras and Thessaloniki in Greece, Amsterdam in the Netherlands, Alicante, Tenerife, Valencia and Zaragoza in Spain, and London in the United Kingdom.20 Progressively, the coverage of such a routine collection of social and medical data among the vulnerable people who are consulting MdM in our clinics all over Europe has been increasing, and so is the quantitative value of our results and the scope of the testimony of this Observatory.
First and foremost, all the participating sites and the 8412 patients who answered our questions deserve to be thanked for their efforts.
Each patient who consulted MdM in 2012 was systematically interviewed, using one or the other of the 3 questionnaires implemented (social form, medical initial form, re-consultation form).
Belgium, France, Greece and UK are the countries with the highest numbers of patients reported in this survey; Nice and London (and at a lesser extent Brussels) gave the highest number of people in the final surveyed population.
In Greece, data only started being collected end of September 2012. So the figures only count for 3 months activity.
In Spain, a specific survey was organised for over a month (mid-November to end of December) in order to collect at least 100 patient files.
All along this report we shall use in the tables and figures:
BE (Belgium) for Antwerp and Brussels
DE (Germany - Deutschland) for Munich
EL (Greece – Ellada) for Athens, Perama, Patras, Thessaloniki
ES (Spain – España) for Alicante, Tenerife, Valencia and Zaragoza
FR (France) for Nice
NL (the Netherlands) for Amsterdam
UK (United Kingdom) for London
16
The European Observatory was renamed International Network Observatory in 2011
17
Chauvin P, Parizot I, Drouot N, Simonnot N, Tomasino A. European survey on undocumented migrants’ access to health
care. Paris, Médecins du Monde European Observatory on Access to Health Care, 2007, 100 p. 18
Chauvin P, Parizot I, Simonnot N. Access to healthcare for the undocumented migrants in 11 European countries. Paris, Médecins du Monde European Observatory on Access to Health Care, 2009, 154 p.
19
Chauvin P, Simonnot N. Access to health care for vulnerable groups in the European Union in 2012. Paris, Médecins du Monde International Network Observatory on Access to Health Care, 2012, 23 p.
20
In the rest of the document, countries will be cited by alphabetic order of their official code, according to the European recommendations (Interinstitutional Style Guide, EU, Rev. 14 / 1.3.2012). The readers must constantly keep in mind that data are from some cities only in each country (between 1 and 4 cities per country).
10
The present report is based on the description of 8412 patients, 19302 contacts (including 10968 medical consultations) and 11921 diagnoses reported by voluntary doctors.
Statistical results are illustrated with some patients’ stories based on verbatim collected by MdM teams.
Table 1. Breakdown of patients by countries
Statistics
Because of the variation in population size of the 14 clinics and the difference in missing value ratios from one centre to another and from one question to another, we chose to compute three estimates for each global figure (mostly proportions or ratios):
CAP (crude average proportion), i.e. without any correction;
WAP (weighted average proportion) is the mean proportion, i.e. the global proportion if all the countries had contributed for the same number of patients;
MVWAP (missing-values-corrected weighted average proportion) is further corrected by taking into account the rate of missing values in every site for the question analysed.
In the following text, we will give one or the other indicator, depending of the distribution of respondents and missing values.
Statistical tests have been also performed to compare some proportions. Classically, we used Chi-square test or Fisher’s exact test when the numbers were low. All the tests have been performed on crude data, using SAS Software (v. 9.2, SAS Institute Inc., Cary, NC, USA).
11
Demographics and countries of origin
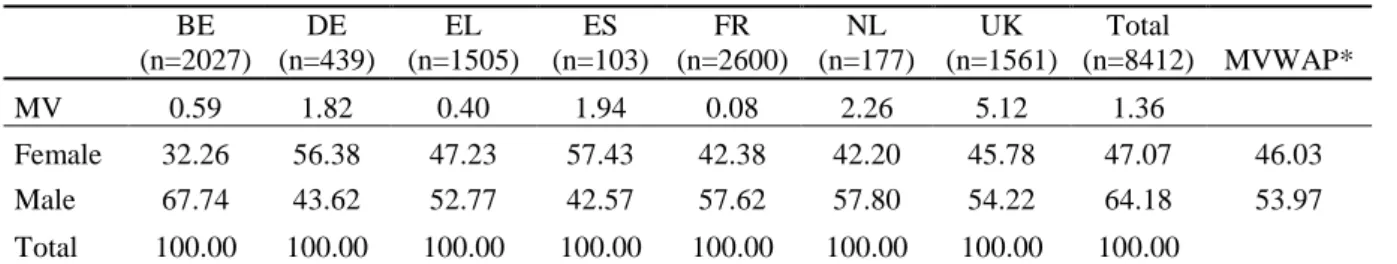
The majority of patients were male (54%), with the exception of Munich and the Spanish clinics where women accounted for the majority of the consulting population. A similar sex ratio was also observed in Munich21 with the 2011 data.
Table 2. Gender distribution by site BE (n=2027) DE (n=439) EL (n=1505) ES (n=103) FR (n=2600) NL (n=177) UK (n=1561) Total (n=8412) MVWAP* MV 0.59 1.82 0.40 1.94 0.08 2.26 5.12 1.36 Female 32.26 56.38 47.23 57.43 42.38 42.20 45.78 47.07 46.03 Male 67.74 43.62 52.77 42.57 57.62 57.80 54.22 64.18 53.97 Total 100.00 100.00 100.00 100.00 100.00 100.00 100.00 100.00
MV=missing values, *Missing values-corrected weighted average proportion
The mean age of the population was 35.7 years (median = 34) and 50% of the population were between 26 and 46 years old (range = [0-93]). In Greece, we observed that a quarter of the patients seen in Perama (27.7%) were over 60 years old, whereas in the other three cities in Greece this was not the case.
Figure 1. Age distribution of the population by country (interquartile, median and mean)
Figure 2. Distribution of the population by age group (in years)
21
A gynaecological consultation takes place in Munich.
20,0 30,0 40,0 50,0 60,0 BE DE EL ES FR NL UK 6,4% 4,9% 24,3% 27,3% 17,9% 11,5% 5,5% 1,8% 0,4% 530 402 2004 2247 1471 946 451 148 33 0 500 1000 1500 2000 2500 0,0% 5,0% 10,0% 15,0% 20,0% 25,0% 30,0% <10 10-19 20-29 30-39 40-49 50-59 60-69 70-79 >=80
12
A small proportion of the patients interviewed were under 18 years of age (8%). This figure was much higher in Greece (19%), especially in Thessaloniki where minors represented 35% of the patients seen. The figure was 15% in Munich where paediatric consultations take place. Only the Spanish clinics did not see any minors at all. This can be explained by the fact that the Spanish health reform does not exclude minors from healthcare (although in practice, some do get excluded) and the fact that the survey in Spain lasted only six weeks.
Figure 3. Proportion of minor patients by country (under 18 years old)
*Missing values-corrected weighted average proportion
Figure 4. Proportion of minors and elderly by city
The origins of the patients varied considerably between countries:
In Munich, 66.4% of the patients were EU citizens, as were 53.6% in Greece (including Germans and Greeks, see below). In contrast, EU citizens were extremely rare in Amsterdam (<2%) and in London (5.4%), whereas they accounted for 10 to 15% of patients in Belgium and Spain and 18% in Nice.
8,7% 15,2% 19,0% 0,0% 8,4% 2,9% 3,2% 8,2% 0,0% 5,0% 10,0% 15,0% 20,0% BE DE EL ES FR NL UK Total (MVWAP*) 9,8% 5,2% 15,2% 4,6% 35,0% 4,3% 10,6% 0,0% 0,0% 0,0% 0,0% 8,4% 2,8% 3,2% 4,1% 3,8% 12,8% 27,7% 14,7% 13,4% 3,9% 20,0% 11,8% 22,2% 6,9% 2,3% 4,4% 0,0% 10,0% 20,0% 30,0% 40,0% < 18 >= 60
13
It is particularly noteworthy that approximately half (49.3%) of the patients seen in the four Greek clinics in 2012 were Greek nationals. Up to 88.0% of patients in Perama, 52.1% in Thessaloniki, 11.8% in Athens and 5.8% in Patras were Greek. The high rate of Greek nationals seeking healthcare from humanitarian NGOs is a dramatic consequence of the severe crisis which has hit Greece over the last two years. It is unique among the clinics that participated in the data collection: in the other countries, this proportion was less than 5% (except in Munich where 12% of patients were nationals) and was almost zero in Amsterdam, Antwerp, Brussels and London.
Figure 5. Proportions of EU citizens, including nationals, by country
**Missing values-corrected weighted average proportion
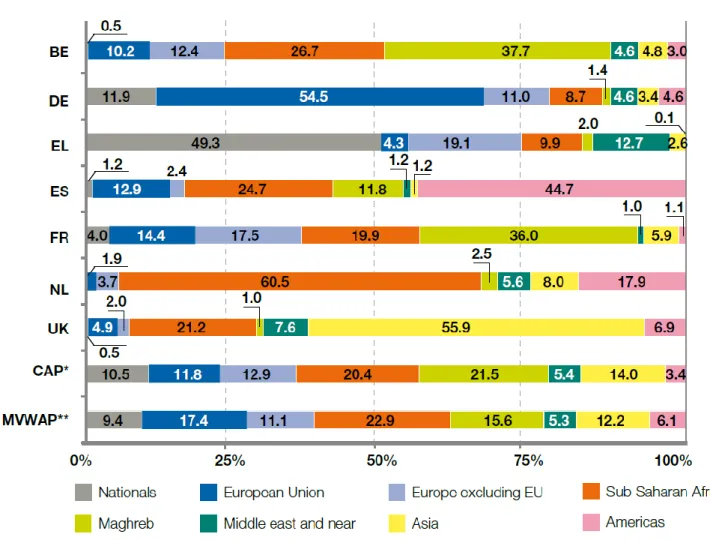
As is usually the case in MdM International Network domestic programmes, the patients’ nationality varied considerably across the countries. Some of these differences may be due to the historical links that still exist between some European countries and their former colonies (e.g. 36% of the patients in Nice were from Maghreb countries and 45% of the patients in Spain were from Latin America). In Amsterdam, 60.5% of the patients were from Sub-Saharan African countries like Ghana (they also represented the majority of patients in 2011). These historical links provide much more of an explanation for the migration process than the welfare systems (which the migrants know nothing about).
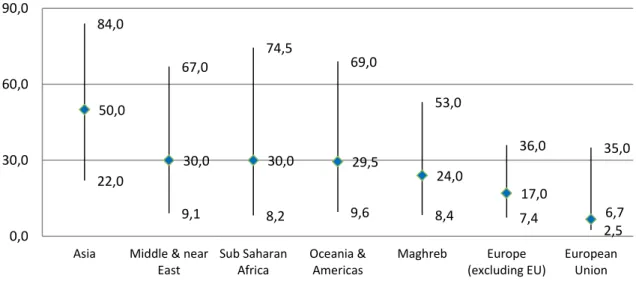
Migrant patients had lived in the host country where they were interviewed for a median length of 32 months (interquartile = [11-73]). This figure was shorter in Belgium and Munich (median <= 20 months), and the longest one in the Greek centres (median=96 months, i.e. 8 years); in all the other centres, it varied between 4 and 5 years. It was also a little – but significantly - longer in men (median=31 months) than in women (26 months, p<0.0001). In average, people from Asia had lived in the country of interview for the longest period of time when Europeans (both from EU or outside EU) had arrived more recently.
10,7% 66,4% 53,7% 14,1% 14,4% 1,9% 5,2% 25,1% 0,6% 11,9% 49,3% 1,2% 4,0% 0,0% 0,5% 9,4% 0,0% 25,0% 50,0% 75,0% BE DE EL ES FR NL UK MVWAP* EU citizens including Nationals
14
Figure 6. Length of stay in the host country (median and interquartile, in months)
Figure 7. Length of stay in the host country by geographical origin (median and interquartile, in months) 6,9 2,5 48,0 29,0 24,0 27,0 16,0 11,0 47,0 48,0 180,0 95,0 102,0 120,0 87,0 73,0 20,0 13,0 96,0 54,0 48,0 61,5 49,0 32,0 0,0 50,0 100,0 150,0 200,0 BE DE EL ES FR NL UK Total 22,0 9,1 8,2 9,6 8,4 7,4 2,5 84,0 67,0 74,5 69,0 53,0 36,0 35,0 50,0 30,0 30,0 29,5 24,0 17,0 6,7 0,0 30,0 60,0 90,0
Asia Middle & near East Sub Saharan Africa Oceania & Americas Maghreb Europe (excluding EU) European Union
15
Figure 8. Patient place of origin by country
16
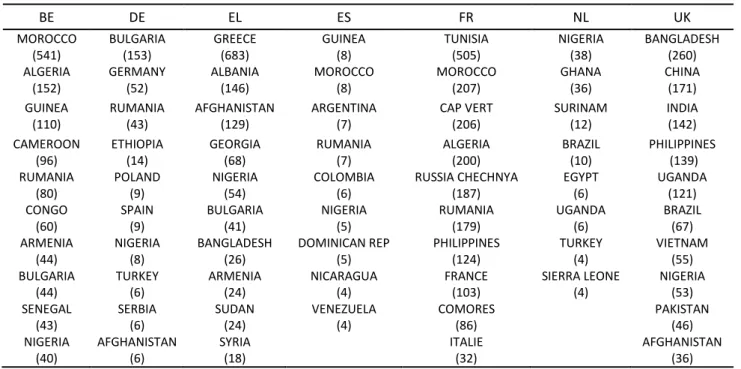
Table 3. Top 10 nationalities by country
BE DE EL ES FR NL UK MOROCCO (541) BULGARIA (153) GREECE (683) GUINEA (8) TUNISIA (505) NIGERIA (38) BANGLADESH (260) ALGERIA (152) GERMANY (52) ALBANIA (146) MOROCCO (8) MOROCCO (207) GHANA (36) CHINA (171) GUINEA (110) RUMANIA (43) AFGHANISTAN (129) ARGENTINA (7) CAP VERT (206) SURINAM (12) INDIA (142) CAMEROON (96) ETHIOPIA (14) GEORGIA (68) RUMANIA (7) ALGERIA (200) BRAZIL (10) PHILIPPINES (139) RUMANIA (80) POLAND (9) NIGERIA (54) COLOMBIA (6) RUSSIA CHECHNYA (187) EGYPT (6) UGANDA (121) CONGO (60) SPAIN (9) BULGARIA (41) NIGERIA (5) RUMANIA (179) UGANDA (6) BRAZIL (67) ARMENIA (44) NIGERIA (8) BANGLADESH (26) DOMINICAN REP (5) PHILIPPINES (124) TURKEY (4) VIETNAM (55) BULGARIA (44) TURKEY (6) ARMENIA (24) NICARAGUA (4) FRANCE (103) SIERRA LEONE (4) NIGERIA (53) SENEGAL (43) SERBIA (6) SUDAN (24) VENEZUELA (4) COMORES (86) PAKISTAN (46) NIGERIA (40) AFGHANISTAN (6) SYRIA (18) ITALIE (32) AFGHANISTAN (36)
17
Legal status
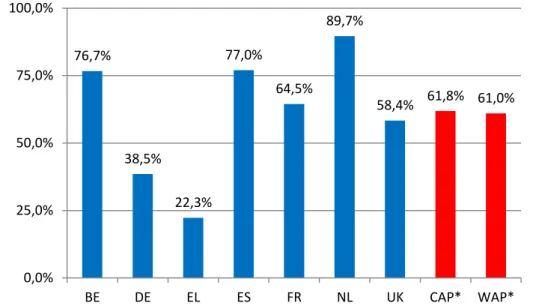
Almost two thirds (WAP=61.0%) of the population were not permitted to reside in the host country; the same proportion as observed in 2011. This proportion differed considerably, depending on the country surveyed: it ranged between 22.3% in Greece and 89.7% in Amsterdam22, whereas London and Nice were close to the global average.
Figure 9. Proportion of patients who were not permitted to reside in the host country
*Crude average proportion, **Weighted average proportion
Two sub-groups of people were not permitted to reside:
Half of the patients (WAP=49.6%) were undocumented migrants from a non-EU country. This proportion was even higher in Brussels and Antwerp (72.3%), Amsterdam (89.1%) and London (57.1%), but was notably low in Munich (8.5%). It should be noted that none of the patients in Perama were undocumented, but 74% were undocumented in Patras where MdM had run a specific mobile unit for migrants in 201123.
11.4% of patients were EU citizens who had lost their legal residency status due to lack of financial resources and/or health insurance. This situation was particularly common in Munich, where 30% of the patients were in this situation, but also in Spain (35.0%). In Spain, this might be a consequence of the combined effect of the financial crisis (and the subsequent dramatic increase in unemployment that affects immigrants first) and the new law, which came into force in September 2012, stopping undocumented migrants from accessing healthcare, whether they are EU citizens or third-country nationals.
22
The MdM support centre in Amsterdam specifically targets undocumented migrants.
23
Chauvin P, Simonnot N. Access to healthcare for vulnerable groups in the European Union in 2012. Paris, Médecins du Monde International Network Observatory on Access to Health Care, 2012, p. 23.
76,7% 38,5% 22,3% 77,0% 64,5% 89,7% 58,4% 61,8% 61,0% 0,0% 25,0% 50,0% 75,0% 100,0% BE DE EL ES FR NL UK CAP* WAP*
18
Table 4. Legal status by country (%)
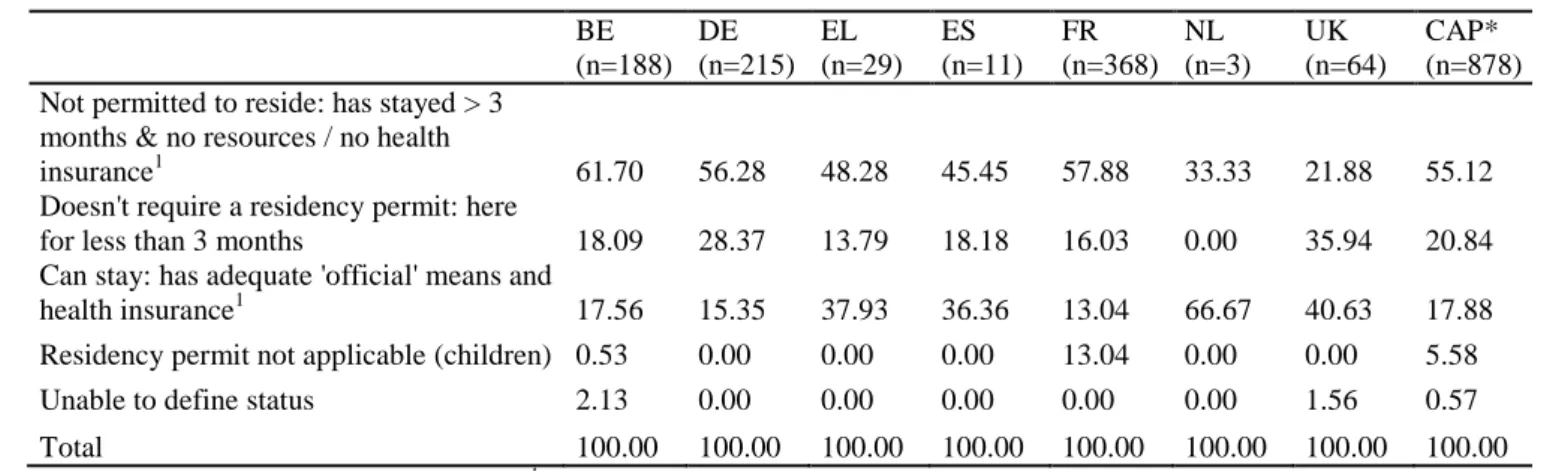
Among the EU citizens seen in the MdM centres (n=878), 55% were not permitted to reside in the host country, due to their lack of resources or health insurance after three months of residence. The other 21% had been in the host country for less than three months and did not need any authorisation; 18% were permitted to reside in the host country.
19
Table 5. Legal status of the EU citizens (excluding nationals) by country (%) BE (n=188) DE (n=215) EL (n=29) ES (n=11) FR (n=368) NL (n=3) UK (n=64) CAP* (n=878) Not permitted to reside: has stayed > 3
months & no resources / no health
insurance1 61.70 56.28 48.28 45.45 57.88 33.33 21.88 55.12
Doesn't require a residency permit: here
for less than 3 months 18.09 28.37 13.79 18.18 16.03 0.00 35.94 20.84 Can stay: has adequate 'official' means and
health insurance1 17.56 15.35 37.93 36.36 13.04 66.67 40.63 17.88 Residency permit not applicable (children) 0.53 0.00 0.00 0.00 13.04 0.00 0.00 5.58
Unable to define status 2.13 0.00 0.00 0.00 0.00 0.00 1.56 0.57
Total 100.00 100.00 100.00 100.00 100.00 100.00 100.00 100.00
1
In the host country or in the country of origin *Crude average proportion
Altogether, a crude proportion of 23.1% of the patients had ever requested asylum or planned to do so. Their numbers were particularly high in Amsterdam (37.3%) and London (44.0%), lower in Brussels and Antwerp (28.7%) and Nice (19.3%), and rare in Greece (5.4%), Munich (5.0%) and Spain (2.9%).
Among these, overall (MVWAP), 27.9% had formally requested asylum and were awaiting a decision, 31.9% had been denied asylum, 30.7% had not yet submitted a request, 4.3% fell within the EU Dublin II Regulation - Eurodac system24, and only 5.3% had been granted refugee status.
24
20
Figure 10. Different situations of asylum seekers by country (in % of total migrant population)
28,7% 5,0% 5,4% 2,9% 19,3% 37,3% 44,0% 23,1% 8,3% 0,7% 9,2% 5,1% 15,2% 8,5% 18,4% 0,7% 0,4% 1,0% 5,7% 19,2% 6,1% 7,8% 7,7% 1,6% 4,0% 1,0% 1,6% 1,7% 16,7% 6,3% 0,2% 2,1% 1,0% 1,9% 1,2% 9,6% 18,9% 4,4% 0,7% 0,7% 0,0% 0,0% 1,8% 0,6% 0,1% 0,8% 0,4% 0,7% 0,0% 0,0% 1,0% 2,8% 2,2% 0,9% 0,0% 10,0% 20,0% 30,0% 40,0% 50,0% BE DE EL ES FR NL UK Total
Have you ever claimed asylum or do you plan to claim asylum? Claim or appealing in process
Refused Asylum seeker Not submitted yet Dublin II
21
Reasons for migration
In all the countries except Belgium and France, the migrants were asked about their reasons for migration. Multiple answers were possible. By far the most frequently cited reasons were economic (42.8% + 2.0% to ensure the future of their children), political (overall 16.4%), familial (either to escape it, 6.4%, or to join someone, 10.5%) or to leave a country at war (5.8%). Health reasons were extremely rare (1.6%), even less frequent than in the 2011 results (2.2%).
Figure 11. Reasons for migration declared by undocumented migrants
Crude average proportions
Usually, the fact of not being able to survive in one’s country of origin is the first reason given for migration, especially among migrants in Spain. Political reasons were most frequently cited in London, where the number of asylum seekers was also high (in the London clinic sexual orientation is commonly cited, especially by homosexuals (women) from Uganda, a factor which is also illustrated by the figure for “family conflicts”).
Once again our surveys reveal one of the highest scores for “personal health reasons” (although it still remains very low) in one of the countries where access to healthcare is most difficult: Germany!
Homophobia: a reason for migration
This year at the MdM UK clinic, 60 individuals (3.6% of the patients) reported leaving their country because of their sexual orientation. An increase of 2.4% was observed in comparison with last year. The vast majority of these patients came from Uganda (85%) and 60% were women. As many as 98% of their asylum claims were refused on first application (as compared to 78% of all asylum claims refused on first application)25. The asylum interview itself is a highly traumatic experience for these men and women. They are often not accustomed to discussing their intimate sexual experiences openly with strangers and interviewers ask very intrusive questions.
25
UK Lesbian and Gay Immigration Group. Failing the grade – Home Office initial decisions on lesbian and gay claims
22
Many end up spending significant periods in detention centres where the staff and other detainees often hold homophobic attitudes. As a result of their experiences, both in their country of origin and in the UK, many of these individuals are amongst the most vulnerable groups seen at the clinic and form a significant proportion of the user group for our Close Follow-Up emotional support programme. Patient story
Sarah, 27, has lived in the UK for more than three years. Her neighbours in Uganda reported her to the police after seeing her with her girlfriend: the two of them were arrested and tortured. As soon as she was freed, Sarah fled to the UK to stay with her sister. She never discovered what happened to her girlfriend.
“My sister told my mother in Uganda that I was a lesbian and she has refused to speak to me since.”
For two years, Sarah rarely left the house. “I was terrified all the time. I thought maybe someone would look at me and see that I was a lesbian and arrest me. My sister didn’t really approve of my sexuality so I didn’t feel I could talk to her. I didn’t claim asylum because I was so scared. I knew that if it went wrong, I would be sent home and killed. I was drinking too much because I couldn’t sleep and I felt so depressed”.
MdM Project London referred Sarah to the Refugee Therapy Centre in North London. She chose to attend a group session rather than individual sessions and reports that, “It is really helping. It’s a chance to talk with people who are also victims of torture. It helps me know I’m not alone, that I’m not the only one”.
Sarah spoke to her MdM clinic Close Follow-Up volunteer, Clare, regularly on the phone for five to six months: “Being phoned was really great. I often felt so alone in the evenings when my sister’s kids were in bed but when I spoke to Clare I felt OK. It helped me build the confidence I needed to claim asylum. When I went for the asylum interview, Clare just told me to be natural and I did. I am so happy that they believed my story.” Clare wrote a letter of support for her asylum claim outlining how Sarah had become involved in Doctors of the World. Finally, Sarah was granted full refugee status in June 2012.
“I would like to study nursing, maybe mental health nursing. There used to be so much pressure on me, I thought about all the ‘what ifs’ and imagined what it would be like if I were forced to go back. It was such a relief to learn that I could stay here. Just knowing I’m not going back tomorrow and that I am somewhere safe for as long as I want to be.”
23
Table 6. Reasons for migration by country (among all migrants)
Living conditions
Housing conditions
Housing conditions are unstable / temporary for half of the patients (MVWAP=49.2%).
The highest rate was recorded in the Netherlands (71.8%), whereas there was not much difference between the patients in the other countries. This means that half of the people who went to an MdM clinic carried the heavy weight on their shoulders of not knowing for sure where they would sleep that night. This hinders people in undertaking any preventive measures in relation to their health. Unstable housing makes it more difficult to take medication in a regular way, implement the doctor’s dietary advice, enjoy regular sleep, etc. Obviously, not having a place to call “home” also has a significant impact on adults’ and children’s mental health and capacity to deal with daily problems.
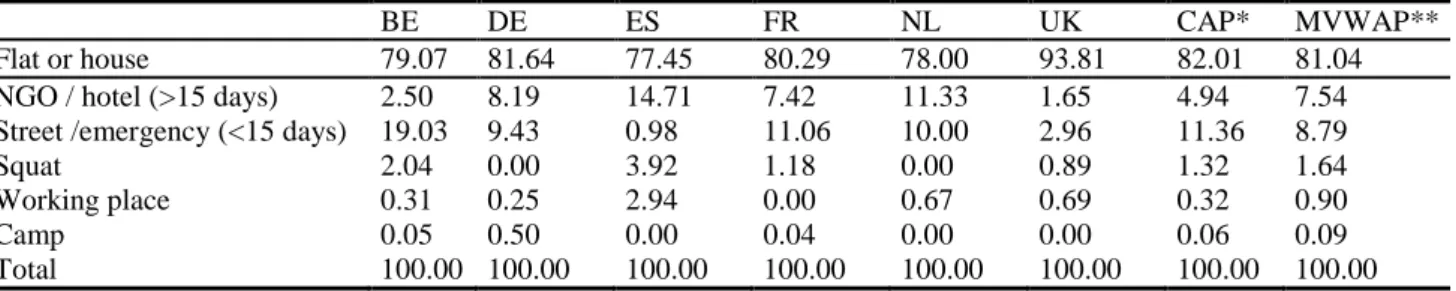
9% of those interviewed were sleeping rough (either on the street or in emergency or short-term shelters), while 7.5% were housed in medium-term accommodation (charity housing, hotels, etc.), 1.6% in squats and a few at their workplace (0.9%) or in camps (<0.1%). Only London seems to offer relatively better housing conditions.
24
Figure 12. Proportion of people housed in temporary/unstable accommodation
*Crude average proportion, **Missing values-corrected weighted average proportion
Table 7. Distribution of housing conditions by site
BE DE ES FR NL UK CAP* MVWAP**
Flat or house 79.07 81.64 77.45 80.29 78.00 93.81 82.01 81.04 NGO / hotel (>15 days) 2.50 8.19 14.71 7.42 11.33 1.65 4.94 7.54 Street /emergency (<15 days) 19.03 9.43 0.98 11.06 10.00 2.96 11.36 8.79
Squat 2.04 0.00 3.92 1.18 0.00 0.89 1.32 1.64
Working place 0.31 0.25 2.94 0.00 0.67 0.69 0.32 0.90
Camp 0.05 0.50 0.00 0.04 0.00 0.00 0.06 0.09
Total 100.00 100.00 100.00 100.00 100.00 100.00 100.00 100.00 *Crude average proportion, **Missing values-corrected weighted average proportion
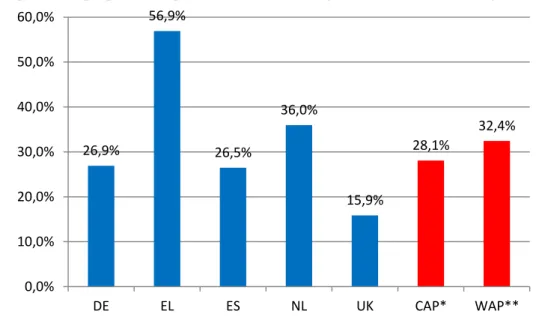
One third of patients felt that their housing conditions were affecting their health or their children’s health. This proportion was highest in Greece where a majority of people expressed such an opinion (56.9%): 87.7% in Patras, 70.3% in Thessaloniki, 44.4% in Perama and 41.8% in Athens. These poor housing conditions can be partly explained by the new housing taxes which must be paid together with electricity bills (the electricity is cut off if the bill is not paid). The data in Greece were collected in autumn 2012, by which time heating was already a necessity.
57,1% 58,3% 43,0% 47,4% 71,8% 36,5% 48,8% 49,2% 0,0% 25,0% 50,0% 75,0% BE DE ES FR NL UK CAP* MVWAP**
25
Figure 13. Proportion of people who reported that their housing conditions were affecting their health
*Crude average proportion, **Weighted average proportion
Available emotional support
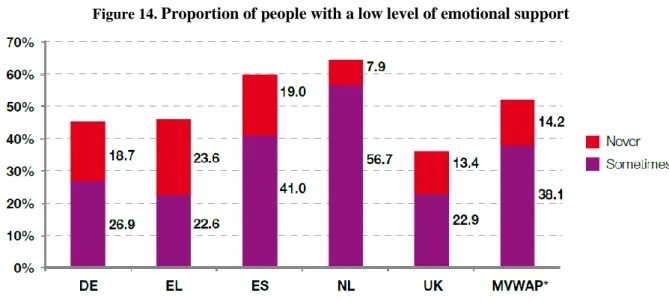
52.3% of people had a low level of emotional support, including 14.2% who were completely without support (especially in Greece). This level of isolation is similar to that observed in our previous surveys. People seemed to be more frequently isolated in Amsterdam (56.7% of people reported having emotional support only sometimes and 7.9% said they never did) and also at the Spanish centres (41% and 19% respectively).
Table 8. Available emotional support by country
DE EL ES NL UK CAP* WAP** MVWAP***
MV 33.03 61.46 2.91 28.25 11.85 Very Frequently 12.59 21.21 14.00 7.87 26.53 22.16 16.44 16.08 Frequently 41.84 32.59 26.00 27.56 37.21 35.73 33.04 31.67 Sometimes 26.87 22.59 41.00 56.69 22.89 25.76 34.01 38.09 Never 18.71 23.62 19.00 7.87 13.37 16.35 16.51 14.16 Total 100.00 100.00 100.00 100.00 100.00 100.00 100.00 100.00 *Crude average proportion, **Weighted average proportion***Missing values-corrected weighted average proportion
26,9% 56,9% 26,5% 36,0% 15,9% 28,1% 32,4% 0,0% 10,0% 20,0% 30,0% 40,0% 50,0% 60,0% DE EL ES NL UK CAP* WAP**
26
Figure 14. Proportion of people with a low level of emotional support
*Missing values-corrected weighted average proportion
Work and income
Only a quarter of the patients declared that they had a job or an activity to earn a living. This proportion was the highest in Nice (34.8%). It was closer to 20% in the other countries. Nice is situated in a rich area of France with many opportunities to work in the domestic service sector (gardens, homes). Among those who declared that they were working, a vast majority in Greece (79.5%) and in Spain (73.7%) indicated that their income was not sufficient to pay for their basic needs. This was also the case for 40.9% of working people in Amsterdam, but more rarely observed in London (13.6%).26
Figure 15. Proportion of people with a job by country
* Missing values-corrected weighted average proportion
26
The question was not asked in Belgium, France and Germany.
9,6% 20,0% 19,1% 20,2% 34,8% 20,1% 23,7% 23,9% 0,0% 10,0% 20,0% 30,0% 40,0% BE DE EL ES FR NL UK MVWAP*
27 Patient story
“During my last five years in Bulgaria I was working for the food industry in a packaging factory. I was responsible for the coordination of the production process. At the time, I had a good life and could go and see a doctor. I lost my job there when the company went bankrupt four years ago. I decided to go to Spain to look for a job there. My family is large and needs money. I am a grandfather. For a while I worked in greenhouses picking tomatoes. Then the crisis started in Spain and I lost my job again. I returned to Bulgaria where I had an accident which caused a hip fracture. I was operated in hospital. But at the time I had lost my insurance and I had to pay the whole bill myself.”
“In Bulgaria, I couldn’t find any work in the food industry. So I left the country to go to Berlin where I worked in a kebab restaurant. I was able to earn my living there but it was not a good business. After I had paid for my rent, as I only earned €3 per hour, I still didn’t have any health insurance. Then I decided to move to Munich. Here I do something different every week. I’ve worked for the maintenance of graveyards, but here also I am paid only €4 an hour instead of the promised €8. My boss refuses to answer his phone. A few months ago I had a chance to get a real contract with health insurance when I started to work as a furniture maker in a hotel. But I lost my chance when one of my colleagues (from East Germany), who didn’t like foreigners like me, started to talk badly about me.”
MdM Germany – Munich – December 2012
Violence
Questions relating to violence were only asked by some of the volunteer doctors. The results presented here are based on the answers of the 396 to 576 patients interviewed about these experiences (depending on the questions asked). Questions about violence were not asked in London and Brussels27 and, at the other centres, this issue could not always be addressed during the medical consultations.
Yet, it is noteworthy to remind that most of the studies have shown the great acceptability (and medical usefulness) of systematic questions about violence in primary care. It is now widely known that women accept very well (or even plea for) any form of systematic screening for domestic violence28. Actually, most of the barriers to such a screening are much more related with the doctors’ personal discomfort with this issue, their lack of knowledge, and their time constraints than with women’s discomfort, emotional distress, or concerns29
.
27
Both teams made this choice: in London this was because they cannot refer the patients who need psychological help; in Brussels the decision was made by the team to let only psychologists talk about experiences of violence.
28
Richardson J, Feder G. Domestic violence: a hidden problem for general practice. Br J Gen Pract 1996; 46: 239-42. Bradley F, Smith M, Long J, O’Dowd T. Reported frequency of domestic violence: cross sectional survey of women attending general practice. BMJ 2002; 324: 271.
Lebas J, Morvant C, Chauvin P. Les conséquences des violences conjugales sur la santé des femmes et leur prise en charge en médecine de premier recours. Bull Acad Natl Med 2002; 186: 949-59.
Chen PH, Rovi S, Washington J, et al. Randomized comparison of 3 methods to screen for domestic violence in family practice. Ann Fam Med 2007; 5: 430-5.
Garcia-Esteve L, Torres A, Navarro P, Ascaso C, Imaz ML, Herreras Z, Valdés M. Validación y comparación de cuatro instrumentos para la detección de la violencia de pareja en el ámbito sanitario. Med Clin (Barc) 2011; 137: 390-7 Nelson HD, Bougatsos C, Blazina I. Screening women for intimate partner violence: a systematic review to update the U.S. Preventive Services Task Force recommendation. Ann Intern Med 2012; 156: 796-808.
29
Sprague S, Madden K, Simunovic N, Godin K, Pham NK, Bhandari M, Goslings JC. Barriers to screening for intimate partner violence. Women Health 2012; 52: 587-605.
28
Regarding other forms of violence among migrants, refuges and/or asylum seekers30, their prevalence varies greatly within the patients populations or care settings studied (between 5% and 35% among refugees, according to a pretty old reference31).
Primary healthcare professionals should play an important role in the identification of the consequences of violence. This applies not only to the well-described post-traumatic stress disorder (PTSD), but also to more unspecific symptoms32. Indeed, knowing the sub-acute and chronic signs and symptoms of violence enables physicians to diagnose and treat (often obscure) symptoms with a much clearer understanding33.
Let’s insist also on the fact that psychiatric disorder or psychological distress may be present years after the initial violence experience (for example, a study on mental health among Guatemalan refugees in Mexico 20 years after the conflict showed that 12% had a PTSD, 54% anxiety symptoms and 39% a depression!34).
Almost 40% of the patients who spoke out about violence in MdM clinics had lived in a country at war; one fifth had been physically threatened, imprisoned or tortured because of their ideas. One fifth had been victims of violence by the police or the armed forces. Civil or domestic violence were also frequently reported: almost 40% of people had been beaten up or injured as a result of domestic violence or by other people, 22% had been victims of psychological violence, 8% had had money they had earned or identity papers confiscated, 8% had been sexually assaulted or molested and 5% had been raped. Generally speaking, men are even more reluctant than women to speak out about sexual violence they have experienced.
As expected, the types of violence experienced were different according to gender. Men have lived in a country at war more frequently than women (44.3% versus 27.3%). Men also have suffered from hunger more frequently than women (40.9% versus 21.1%), have been victim of political (28.7% versus 8.3%) or police/army (27.1% versus 11.4%) violence.
Patient story
Dorian is 26 years old and comes from Burkina Faso. He fled his country 10 years ago. His father used to beat him regularly. He once hit him so hard that Dorian fell to the ground unconscious. One day his mother tried to stop his father, grabbed a gun, and shot him dead. The police came to the house and arrested Dorian’s mother and took her away. In a single day, Dorian lost both his parents. He fled the country and ended up in Europe. After five years of sleeping rough he arrived in the Netherlands. He applied for asylum but with no success. His asylum appeal was refused three times. He is now sleeping rough in Amsterdam.
MdM Netherlands – Amsterdam – February 2012
30 Toar M, O'Brien KK, Fahey T. Comparison of self-reported health & healthcare utilisation between asylum seekers and
refugees: an observational study. BMC Public Health 2009; 9: 214.
31
Baker R. Psychological consequences for tortured refugees seeking asylum and refugee status in Europe. In: Basoglu M, ed. Torture and its consequences. Cambridge, Cambridge University Press, 1992, pp. 83-106.
32 Loutan L, Berens de Haan D, Subilia L. La santé des demandeurs d’asile : du dépistage des maladies transmissibles à
celui des séquelles post-traumatiques. Bull Soc Pathol Exotique 1997; 90: 233-7. Vannotti M, Bodenmann P. Migration et violence. Med Hyg 2003; 61: 2034-8.
33
Weinstein HM, Dnasky L, Lacopino V. Torture and war trauma survivors in primary care practice. West J Med 1996; 165: 112-8.
34
Sabin M, Lopes Cardozo B, Nackrud L, Kaiser R, Varese L. Factors associated with poor mental health among Guatemalan refugees living in Mexico 20 years after civil conflict. JAMA 2003; 290: 635.42.
29
Figure 16. Prevalence of violence by type
37,3% 20,9% 20,7% 32,8% 22,4% 19,4% 8,1% 8,0% 5,4% 11,9% 26,6% 0,0% 10,0% 20,0% 30,0% 40,0%
Have you lived in a country at war?
Have you ever been the victim of violence by police or army forces?
Have you been physically threatened or imprisoned for your ideas or have been tortured?
Have you ever suffered from hunger?
Have you been a victim of psychological violence?
Have you ever been beaten up or injured as a result of domestic violence or by other people? Have you ever been confiscated earned money or
identity?
Have you ever been sexually assaulted or molested?
Have you ever been raped?
Have you ever suffered from any other type of violence that has not been mentioned? Have you suffer from one of these violence since
30
Figure 17. Prevalence of violence by type and gender
A quarter (26.6%) of the people interviewed reported that they have suffered from violence since their arrival in the host country. Among these, the most frequently cited violence was suffering from hunger (49.5% of men and 40.0% of women). Having been a victim of violence on the part of the police or armed forces was also not exceptional (34.0% and 11.4%) and neither was having been physically threatened for their ideas (27.8% of men). Physical violence (including domestic violence), psychological or sexual violence were cited by 20 to 25% of the women who declared they had been victims of violence in the host country.
Patient story
Fatima is 29 years old and from Tunisia. She lives in Athens. Last October she was attacked at night by a group of six men, as she was returning home with a friend. They were approached in a threatening way with a pit-bull dog and asked about their nationality. Four men attacked her while another one attacked her friend. The last one just watched what was happening, holding the dog. Although there were quite a few people passing by who witnessed the scene, nobody intervened to help and stop the attack. Fatima was severely injured. She mentioned that the men were dressed in black with clear gold signs and white crosses – members of Golden Dawn, the Greek neo-Nazi party.
MdM Greece – Athens – October 2012
44,3% 27,1% 28,7% 40,9% 23,2% 19,0% 10,6% 4,3% 2,1% 12,2% 27,3% 11,4% 8,3% 21,1% 21,7% 20,2% 4,5% 13,4% 10,1% 11,7% 0,0% 10,0% 20,0% 30,0% 40,0% 50,0%
Have you lived in a country at war?
Have you ever been the victim of violence by police or army forces?
Have you been physically threatened or imprisoned for your ideas or have been
tortured?
Have you ever suffered from hunger?
Have you been a victim of psychological violence?
Have you ever been beaten up or injured as a result of domestic violence or by other
people?
Have you ever been confiscated earned money or identity?
Have you ever been sexually assaulted or molested?
Have you ever been raped?
Have you ever suffered from any other type of violence that has not been mentioned?
Male Female
31
Figure 18. Distribution of the types of violence since the arrival in the host country, by type and gender (among people declaring at least one type of violence since arrival*)
*n=97 men and 35 women
Lecture: hunger was cited by 49.5% of the men who have declared at least one type of violence since arrival in the host country.
Our results show that migrants are particularly exposed to acts of violence, even once they have arrived in Europe, especially women. Violence has inevitable physical and psychological consequences on health35. Indeed, among MdM service users, perceived health status is almost always poorer among victims of violence than among other patients. Of course, the numbers are quite small and statistical significance is missing (with the notable exception of patients who declared that they had been victim of psychological violence, who were at higher and significant risk of being in bad or very bad mental health: RR=1.5, p=0.02).
35
Carta MG, Bernal M, Hardoy MC, Haro-Abad JM. Migration and mental health in Europe. Clin Pract Epidemiol Mental
Health 2005; 1: 13. 47,0% 28,0% 21,2% 14,4% 11,4% 9,9% 5,3% 5,3% 2,3% 49,5% 34,0% 27,8% 10,3% 7,2% 10,3% 0,0% 5,2% 0,0% 40,0% 11,4% 2,9% 25,7% 22,9% 8,6% 20,0% 5,7% 8,6% 0,0% 10,0% 20,0% 30,0% 40,0% 50,0%
Have you ever suffered from hunger?
Have you ever been the victim of violence by police or army forces? Have you been physically threatened or imprisoned for your ideas or have
been tortured?
Have you ever been beaten up or injured as a result of domestic
violence or by other people? Have you been a victim of
psychological violence?
Have you ever been confiscated earned money or identity?
Have you ever been sexually assaulted or molested?
Have you ever suffered from any other type of exposure to violence that has not been mentioned in the…
Have you ever been raped?
Total Male Female
32
Access to healthcare
Coverage of healthcare costs
An assessment of each patient’s level of coverage of healthcare costs was systematically made during the first visit to each centre. This data was available for more than 90% of the population, except in Greece where 61.5% of values were missing for this question.
These assessments enabled us to detect marked differences across patient populations in centres, which can be linked to the different health systems in their respective countries36, even if the absence of any health coverage was by far the most frequent situation for the patients on the day they came to the MdM clinics (CAP=80.7%).
Table 9. Coverage of healthcare costs by country
* Crude average proportion 36
A full update on legislations in each of the countries is available on request. A chapter (containing a short version of this update) is included in “Access to healthcare in Europe in times of crisis and rising xenophobia”. See www.mdm-international.org
33
In Belgium and France, the vast majority of patients (90% and 82%, respectively) had no health insurance37 on the day they came into the MdM clinics in Antwerp, Brussels and Nice. In Nice, 15% of patients were partially (8%) or fully (7%) covered by the national healthcare insurance system. People with full health coverage came to MdM clinics in order to see the social worker, a psychologist and a dentist (no real access to dental prosthesis in the mainstream health system), but also to see a medical doctor. Even though legally and financially they could access one in the mainstream system, it sometimes takes time to convince them to leave our clinic, to trust new people, to believe they will be well received, with no discrimination due to their specific health coverage. In both countries, a small number of patients were insured in another European country.
In Spain, the vast majority of patients (97.0%) had no health coverage at all. In Spain the four cities where data was collected applied the new Royal Decree (passed in April 2012, it came into force in September 2012) stopping undocumented migrants from accessing healthcare, unless they pay a fee of
€
59.20 per month if they are under 65 years old and€
155.40 per month if they are over 6538. Only three patients had medical coverage (full coverage, partial coverage or on a case-by-case basis). For 48% of the patients, the teams declared that they could only access accident and emergency departments (which is actually the case for all of them except the three mentioned above). In London, 89.6% of the patients had access to care only with specific free healthcare providers (this is a situation which we compared with people in other EU countries who have no health coverage at all: it means that they were not registered with a GP and could not access care until they did register). 10.3% had access to a GP without being charged (as is usual in the National Health Service). 0.07% had access to secondary care and were registered at a GP practice but came for help with other issues. 3.17% had access to secondary care (usually through the accident and emergency department, since secondary care is only accessible by GP referral), even though they had not yet registered with a GP.39
In Munich, 76.7% of patients (52.26%+24.47%) had no health coverage at all. This means that they could only access care in an accident and emergency department, even though for some of them, as undocumented migrants, they have the right to care on the same basis as asylum seekers. However, in reality, it does not work because of the fact that all civil servants have a reporting obligation to the immigration authorities (and migrants consequently fear arrest). 13.5% were insured in another European country (Munich is the location with the highest proportion of EU citizens among its patients). 7.1% were insured but had private or student insurance which does not reimburse some costs (treatments that are not considered urgent or dental care), or had debts with their insurance and therefore only had access to emergency care, or could not pay the necessary co-payment for glasses or dental care. 2.6% had access to care on a case-by-case basis, mainly asylum seekers trying to get the “right” papers in order to consult a medical doctor.
In the Netherlands, 92.4% of patients could not obtain insurance as they were undocumented migrants from outside the EU, but the costs of healthcare (80% for GP consultation to 100% for midwives) can be reimbursed to the health provider if the patient cannot pay. 5.2% could not obtain this coverage because they were uninsured EU citizens or non-EU nationals with a residency permit in another EU country (but without valid health insurance in the Netherlands) and 2.3% were insured in the Netherlands or elsewhere in the EU.
37
The people who come to any of our centres, but especially in Athens, Brussels and Nice (because of the amount of people coming each day), and do have an effective health coverage are for the most part referred immediately to the mainstream healthcare system.
38
In practice, migrants who have declared that they want to pay these insurance fees have stated that it is impossible to do so because there is no clear process to pay these sums to the public administrations.
39
More than one answer was given in a significant number of cases in London and Spain only. In the other countries, this question was considered as a single-answer one.