Publisher’s version / Version de l'éditeur:
ASTM Special Technical Publication, 1320, pp. 456-470, 1997-04-01
READ THESE TERMS AND CONDITIONS CAREFULLY BEFORE USING THIS WEBSITE. https://nrc-publications.canada.ca/eng/copyright
Vous avez des questions? Nous pouvons vous aider. Pour communiquer directement avec un auteur, consultez la
première page de la revue dans laquelle son article a été publié afin de trouver ses coordonnées. Si vous n’arrivez pas à les repérer, communiquez avec nous à PublicationsArchive-ArchivesPublications@nrc-cnrc.gc.ca.
Questions? Contact the NRC Publications Archive team at
PublicationsArchive-ArchivesPublications@nrc-cnrc.gc.ca. If you wish to email the authors directly, please see the first page of the publication for their contact information.
NRC Publications Archive
Archives des publications du CNRC
This publication could be one of several versions: author’s original, accepted manuscript or the publisher’s version. / La version de cette publication peut être l’une des suivantes : la version prépublication de l’auteur, la version acceptée du manuscrit ou la version de l’éditeur.
Access and use of this website and the material on it are subject to the Terms and Conditions set forth at
A Logical extension of the ASTM standard E96 to determine the
dependence of water vapour transmission on relative humidity
Lackey, J. C.; Marchand, R. G.; Kumaran, M. K.
https://publications-cnrc.canada.ca/fra/droits
L’accès à ce site Web et l’utilisation de son contenu sont assujettis aux conditions présentées dans le site LISEZ CES CONDITIONS ATTENTIVEMENT AVANT D’UTILISER CE SITE WEB.
NRC Publications Record / Notice d'Archives des publications de CNRC:
https://nrc-publications.canada.ca/eng/view/object/?id=3c5216bb-b988-4b0e-964e-ac0537e4ccf0
https://publications-cnrc.canada.ca/fra/voir/objet/?id=3c5216bb-b988-4b0e-964e-ac0537e4ccf0
http://www.nrc-cnrc.gc.ca/irc
A Logic a l e x t e nsion of t he AST M st a nda rd E9 6 t o de t e rm ine t he
de pe nde nc e of w a t e r va pour t ra nsm ission on re la t ive hum idit y
N R C C - 4 0 1 0 5
L a c k e y , J . C . ; M a r c h a n d , R . G . ; K u m a r a n , M . K .
A p r i l 1 9 9 7
A version of this document is published in / Une version de ce document se trouve dans:
ASTM Special Technical Publication, 1320, pp. 456-470, April 01, 1997
The material in this document is covered by the provisions of the Copyright Act, by Canadian laws, policies, regulations and international agreements. Such provisions serve to identify the information source and, in specific instances, to prohibit reproduction of materials without
written permission. For more information visit http://laws.justice.gc.ca/en/showtdm/cs/C-42
Les renseignements dans ce document sont protégés par la Loi sur le droit d'auteur, par les lois, les politiques et les règlements du Canada et des accords internationaux. Ces dispositions permettent d'identifier la source de l'information et, dans certains cas, d'interdire la copie de
John C. Lackey,I Roger G. Marchand, ' and Mavinkal K. Kumaran'
A LOGICAL EXTENSION OF THE ASTM STANDARD E96 TO DETERMINE THE DEPENDENCE OF WATER VAPOUR TRANSMISSION ON RELATIVE
HUMIDITY
REFERENCE: Lackey,J.C., Marchand,R. G" and Kumaran, M. K., "A Logical Extension of the ASTM Standard E96 to Determine the Dependence of Water Vapour Transmission on Relative Humidity," Insulation Materials: Testing and Applications: Third Volume, ASTM STP 1320, R.S. Graves and R.R. Zarr, Eds., American Society for Testing and Materials, 1997.
ABSTRACT: It is well koowo that the water vapour transmission properties of
hygroscopic building materials depend on the local relative humidities(rh). Traditionally, the ASTM Standard E96 specifies only two conditions of rho The dry cup method in the standard corresponds to a mean rh of 25% and the wet cup
to
75%. This information is not enough to describe the behaviour of the material through the entire range of rho European standards have already proposed an extension of the existing standard to address this issue. ASTM standard should follow this change. A logical extension of the E96 standard to include the effect of rh on water vapour transmission properties has been proposed and is being discussed by one of the C16 Committee Task Groups.This paper presents the application of the proposed extension to several common building materials. The details include the operating principles of a constant temperature-rh chamber and the effects on the test results, of the vapour resistance offered by still air inside the cup, the surface resistances and buoyancy. The experimental data were used to critically assess the above effects. The data as well as the analyses of the data are expected to provide guidance to refine the existing ASTM Stimdard.
KEYWORDS: water vapour transmission, permeability, penneance,relative humidity, building materials, still air, surface resistance, buoyancy
INTRODUCTION
Water vapour permeability is probably the most commonly used hygrothermal property that characterizes building materials. Almost all insulation material standards in North America refer to this property as a performance parameter[1].The property stems from the water vapour transport equation:
I Technical Officer, ' Senior Technical Officer;' Senior Research Officer, Building
Performance Laboratory, Institute for Research in Construction, National Research Council of Canada, Ottawa, Ontario, Canada KIA OR6.
where.
,;, v
=
-lip
grad PvLACKEY ET AL. ON ASTM E 96 457
(I)
mv= water vapour transmission rate, kg-m-2·s·\
Bp
=
water vapour permeability of the medium, kg·m'l·sl.p..lpv
= water vapour pressure, Pa.The ahove equation is derived from the Pick's law, which states that the density of diffusion flow rate of any material at a given point in a medium is directly proportional to its concentration gradient at that point, at constant temperature.In building physics
applications, the water vapour pressure being significantly lower than the atmospheric pressure, the water vapour is assumed to follow the ideal gas equation and hence the
concentration is substituted by the vapour pressure in equation(l).
Traditionally, building physicists have used equation(l) directly to measure the water vapour permeabilities of building materials. There has been very little change in the principle of the experimental procedure during the past six decades. In 1963, Joy and Wilson[£] thus wrote: "The simplest and most widely used test of the rate of water vapor transmission is the dish or the cup method. The specimen is sealed to the mouth of an impermeable test dish containing water or a desiccant, and placed in a controlled atmosphere. Periodic weighing of the assembly determines when a steady rate of weight
loss or gain is attained, and this final rate, continued long enough to ensure its validityIis
the test result... The ASTM had standardized two dish methods, as early as 1954; E96
for thin sheets and C355 for materials, such as those used in building construction, tested
in a thickness greater than 3 mm. Currently, the ASTM Standard, Designation E96-95, Standard Test Methods for Water Vapor Transmission of Materials is followed in Canada and the US. A recently concluded round robin series ofュ・。ウオイ・ュ・ョエウ{セ} confIrmed that eight out of the nine participants strictly followed the standard.
It is well known that the water vapour transmission properties of hygroscopic building materials depend on the local relative humidities (rh)[±,Q]. However, the ASTM Standard E96 specifIes only two conditions of rho The dry cup method in the standard corresponds to a mean rh of 25
%
and the wet cup to 75%.
With the advent of very sophisticated tools for hygrothermal analysis of building materials and components[1], this information is not enough to describe the behaviour of the materials through the entire range of rho European draft standardsffi] have already proposed an extension of the existing standard to address this issue. ASTM standard should follow this change. A logical extension of the E96 standard to include the effect of rh on water vapourtransmission characteristics has been proposed to the C16 Committee and is being
discussed by one of the Task Groups[2].
This paper presents experimental results for several common building materials, using the extended E96 procedure proposed to the ASTM Cl6 Committee. Though equation( 1) is rather straight forward, several test parameters have to be considered during the data analysis. These parameters inclUde:
-
458 INSULATION MATERIALS: TESTING AND APPLICATIONS1. resistance offered by the still air layer in the cup
2. surface resistances on the bounding surfaces of the test specimen
3. buoyancy and 4. edge masking[21
The results from the present study are used to illustrate the effects of the first three parameters on the final result. The design of the cups avoided the use of edge masking.
MATERIALS AND METHOD
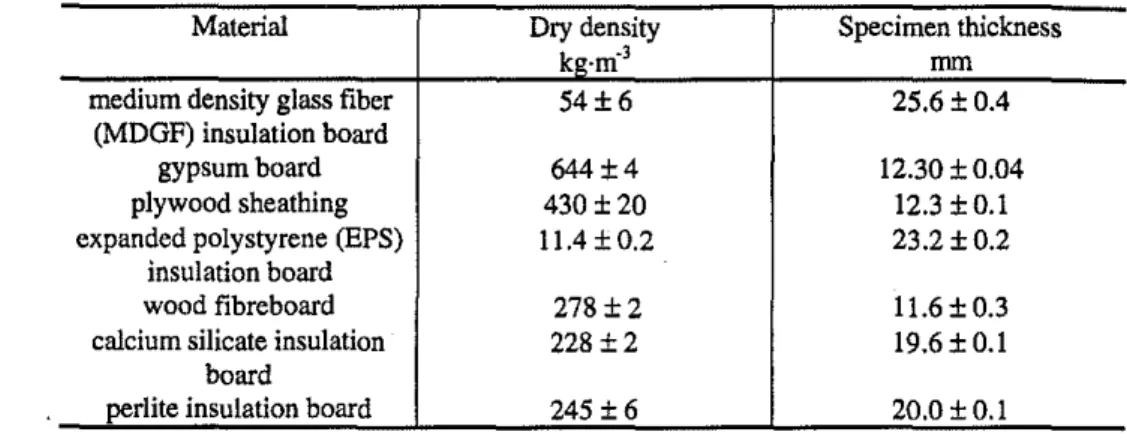
The building materials included in this investigation are listed in Table 1. In addition to those materials, to illustrate the effect of buoyancy, selected Sets of
experimental data on samples of two materials, a plastic film and an aluminum sheet, with
very high resistance towards water vapour transmission are also included. TABLE 1-- A
list
of buildingmaterials investigated in this worleMaterial Dry density Specimen thickness
kg,m" rom
medium density glass fiber 54±6 25.6 ± 0.4
(MDGF) insulation board
gypsum board 644±4 12.30±0.04
plywood sheathing 430 ±20 12.3 ±O.I
expanded pOlystyrene (EPS) 11.4 ± 0.2 23.2±0.2 insulation board
wood fibreboard 278±2 11.6 ± 0.3
calcium silicate insulation 228±2 19.6 ± 0.1
board
perlite insulation board 245 ±6 20.0 ± 0.1
The experimental procedure is identical to those prescribed in the ASTM Standard E96. However, to include the full range of rh, a variety of conditions were maintained in the constant temperature-humidity chamber as well as inside the cup. The conditions
inside the cup were maintained constant
by
using either a desiccant (anhydrous calciumchloride), or a salt solution[.lQ] or distilled water.
Two separate constant temperature-humidity chambers (1.5 m x U5 m x 1.7 m) were recently built at the Institute to undertake a series of systematic measurements of
water vapour transmission characteristics of common building materials as a function of
rho A schematic representation of the chamber is shown inFIG. I.It works on the first principles of psychrometry. Air is drawn from the chamber at a constant speed through a duct system.It is then loaded with water vapour by pushing over a reservoir of warm water (35 to 40"C). The moist air is then passed over a series of cooling coils maintained at a predetermined constant temperature, to correspond to the desired dew point (and
hence the desired moisture content) insidetnechamber. The excess moisture is condensed
--LACKEY ET AL. ON ASTM E 96
459
is pre-heated approximately to the chamber temperature. A thermally insulated part of the duct system evenly distributes the moist air inside the chamber and the cycle continues. The walls of the chamber carry aluminum panels with uniformly distributed and
controllable heating coils to maintain constant temperature. The continuous circulation of air generates an air velocity= 0.2 m·s·l
inside the chamber.
t
.... ::, HeatefCooling セi Heater
!
Temperature controlled wall
.r···-_··· ··· - .
,...···1
...-(
t···--_···..···
(
I
I
! _
, ;
1 .1•••.•••.••.••...••••.•..•••セ]エエZ]CZZZZZZe]]]]]]]]]ZZZZZj
i
,
,IflG. 1-- A schematic of the constant temperature-humidity chamber used in the measurements.
The chamber has been used to generate and maintain various levels of rh ranging between 20 % and 96 %. Four randomly chosen examples (flG. 2) illustrate the stability of the chamber during the measurements. It is believed that this level of stability of the chambers significantly adds to the reliability of the data presented here. As a guideline, the nominal values oftbe rh maintained in the chamber and the cup to include the full range of rh are listed in Table 2. Real measured values are used in all calculations.
DATA ANALYSIS
The data were analyzed as prescribed in the current ASTM Standard. A
mathematica11east squares regression analysis of the change in mass as a function of time was used to determine the rate afwater vapour transmission at the. steady state. However, in the current standard, the rate so calculated is assumed to correspond only to the
11IIII"'...
---.-.,,;-\#,
qセB
460 INSULATION MATERIALS: TESTING AND APPLICATIONS
TABLERセセ Nominal conditions in the chamber and the cup in various measurements:the
temperature is always 23°C.
Mean Relative The content of the Humidity in the Humidity in the
Humidity, % dish(cup) test dish, %
chamber,
%
IS
Desiccant
0 3025
Desiccant
0 5035 Desiccant 0 70
36.25 Saturated aqueous 22.51 50
potassium acetate solution
45
Desiccant
0 9051.58 Saturated aqueous 43.16 60
potassium carbonate
solution
59.43 Saturated aqueous 68.86 50
potassium iodide solution
65 distilled water 100 30
70.45 Saturated aqueous 80.89 60
potassium bromide solution
75 distilled water 100
SO
80 distilled water 100 60
85 distilled water 100 70
90 distilled water 100 80
95 distilled water 100 90
resistance offeredbythe test specimen. In fact, the experimental set-up imposes four
vapour resistancesllil in series between the content of the cup (the desiccant, salt solution or distilled water) and the chamber. These are:
I. the resistance offered by the layer of still air in the cup,
2. the resistance offered by the surface of the specimen inside the cup 3. the resistance offered by the test specimen
4. the resistance offered by tbe surface of the specimen outside the cup
If
the thickness of the still air layer is known, the corresponding vapour permeance and hence the resistance can be calculated using the following equationUZl for permeability.2.306xlO-5P ( T )1.81 B = 0 ___ a R vTP 273.15
(2)
where.
, B,
=
the permeability of stillair,
kg·m,l.sl.pal T=
the temperature" KP
=
the ambient pressure, PaPo= the standard atmospheric pressure, Le.101325Pa and R,
=
the ideal gas constant for water, Le.461.5J.KI·kg'l.al
LACKEY ET AL. ON ASTM E 96
461
Inthe absence of any measured data,
the
surface resistances may be approximatedusing Lewis' relation[Ul. According to Hansen and Lund[ll] for cup methods that follow the ASTM Standard, the total surface resistance should bez 4 x 10⁷ Pa·s.m'·kg·'.
2072 "'.52 52.75 23.1 28.7 "'.8 52.7 23 セ セ
C
8 .88 22.78 P セ 62.65 セ'"
22.76セ
セ ",.•
セ セ 28.88セ
52.8 セ 28.64 セ セffi
セ
"'.74 セ セ 52.55 "'.8セ セ 28.62 セ "'.72 52.' "'.7 28.8 28.58 "'.7 52.45 "'.8 0 80 100 150 ,CO 250 0 100 ZOO 300 400 800 TIME,h TIME,hI.RELATlVEHUMDJlY +TI;MPERATURE I.Aa.o.TMlHUMCITV .. TI;MPERAFURE
80.8 "'.88 92.8 "'.7 "'.88 92.7 "'.88 セ 80.6 セ セ セ セ 92.8 22.66V 22.64uI
BGXTセ
セ "'.52セ
9 セ 80.4セ
".,
セ セ セ セ 22.62セセ
"'.8 セ ; 92.4セ
l!'! 80.2"
22.8 "'.58 92.3 "'.58 80 22.58 92.2 "'.58 0 100 ZOO 300 400 800 0 100 ZOO 300 TIME,h nME,hI.RElATIVI!H\HOITY .TEMPERATURE I.AaATlllEfUo(DIT'I' .TEt,lPEAATURE
FlG.2--Four randomly chosen examples to illustrate the long-term stability of the chambers, which contributes significantly to the reliability of the results; the temperature
inside is monitored continuously using several thermocouples at various locations and the
humldity using a calibrated chilled-mlrror sensor.
Corrections are to be made for the resistances offered by the still air and the two surfaces for all cup measurements. However, for vapour tight materials (measured
transmission rate of the order of 10.8kg·mo2.s·' or less) these corrections are within the
limlts of the experimental uncertainty. For example, for a specimen of plywood sheathing, the following results were obtained:
462 INSULATION MATERIALS: TESTING AND APPLICATIONS
-water vapour transmission rate
=
2.58 x 10.8kg·m·'·s' permeance(uncorrected)=
5.52 x 10.11kg.m·'·s'·Pa" thickness of stiilair = IS rompermeance (corrected for stiil air layer)
=
5.55X10'" kg·m"·s'·P.-'total surface resistances[ll] 4 x 10' Pa,s'm"kg"
permeance = 5.56 x 10.11kg·m·'·s'·P.-'
(corrected for still air layer and surface resistances)
On the other hand. for vapour permeable materials the corrections become significant and
can not be neglected. For example, for a specimen of MDGF, the following results were obtained:
water vapour transmission rate = 2.27x 10⁻⁶kg·m-2·s·'
permeance(uncorrected)
=
3.85 x 10" kg.m"·s'·P.-' thickness of stiilair = 15 rompermeance (corrected for stiil air layer) = 5.46 x 10" kg·m".s'.p.-' total surface resistances[ll] = 4 x 10' Pa·s·m'·kg" permeance
=
6.98 x 10" kg,m"·s'·p.-'(corrected for still air layer and surface resistances)
Yet another type of correction that can not always be neglected is the buoyancy
correction. The duration of one set of measurements can be many days or weeks. The atmospheric pressure may significantly changeduring such periods.Ifthe test specimen is
a highly vapour resistant one, the changes in mass due to the vapour transport maybe overshadowed by the apparent gravimetric changes observed. In such cases at least, all
gravimetric data should be corrected to those in vacuum (the intention is to bring all the
measurements to the same base line; this may also be done by making the base line to correspond to standard atmospheric conditions). The following equation[14] can be used
for such corrections:
where.
m, =
1+ P.
(P, - p,)
m,
P,(P, -P.)
(3)m, = weight recorded by the balance, kg m,
=
mass corrected for buoyancy effect, kgp.
=
density of air, kg·m"p, = density of the material of the balance weights, kg·m·' P,
=
bulk density of the test assembly, kg·m"The density of air can be calculated using the ideal gas law for the measured atmospheric pressure and ambient temperature. The following two examples illustrate the effect of the buoyancy correction.
FIG.セ shows the results from one set of measurements on a test specimen of a
plastic film. The corrected data gave statistically a better fit to the straight line (linear correlation coefficient of 0.998 vs 0.992) and yielded a permeance value= (4.50
±
0.03) xLACKEY ET AL. ON ASTM E 96
463
10.1' kg·m'·sl·Pa·1while the raw data yielded (3.97
±
0.05) x 10.1'kg·m·'·sl.Pa· l. Thedifference between the two are much larger than the standard errors. Furthermore, when the measurements were continued for approximately 1100 h, both the corrected and raw
data gave a permeance value= 4.7 x 10.1
' kg·m·'·sl·Pa·1,closer to the value estimated
using the corrected data for the first 350 h.
AG. 4 shows the results on an aluminum sheet. The measured changes in mass are
one order of magnitude less than those in FIG. 3. The raw data initially did not make any sense. Apparently, the mass decreased first, then increased and then decreased again. But the corrected data indicated a very small but measurable (about 10 mg) increase in mass in 200 h. IdeaIly, the aluminum sheet should exhibit infinite resistance to vapour transport.
The measurements. however, indicate the presence of physical phenomena, such as
adsorption or diffusion through micro-cracks in the sheet or the assembly itself. This hasprovided the data to demonstrate the effect of ambient pressure on weighings. 0 . 1 4 , . . . - - - , 0.12 0.1
'"
uiセ
0.08"
セ 0.06 ::; 0.04 0.02 400 100 200 300 TIME, h 0 ' -_ _--'- '--_ _-'-_ _---'o
I
0 CORRECTEO DATA 0 RAW DATAFIG. 3-- The effect of buoyancy corrections on the test results on a highly vapour resistant
material. .
RESULTS
The results from several series of measurements on the materials in Table lare
listed in Table 3. For each test condition, three test specimens were used and all values are listed. The temperature was always in the vicinity of 23 'c( FIG. 2). The mean rh is calculated as the average of those in the cup and in the chamber. All four corrections listed
464 INSULATION MATERIALS: TESTING AND APPLICATIONS 0 . 0 2 . . . - - - ,
,
o o r. r 0.015 0 C> C Wセ
0.01 c (.) en 0.005 c セ 0 ::ii c 0 c c -0.005 ' - - - ' - ' - - - - ' - - - ' - - - ' - - - - 'o
50 100 150 200 250 TIME.hoRAW DATA oCORRECTED DATA
FIG. 4--Experimental results on an aluminum sheet to illustrate the effect of buoyancy
correction.
CONCLUSIONS
The extended ASTM E96 Standard test procedure has systematically generated a reliable set of data on the permeabilities of several common building materials as a function of rho It is equally applicable to highly vapour permeable and vapour resistant materials. Indeed this procedure has been used byッエィ・イウ{セェ and also proposed in the draft .of a European Standard!]].
The design of the experimental set-up makes the results susceptible to various
types of errors mentioned in the section on data analysis. However, these errors can be
corrected theoretically. No additional measurements appear to be necessary. The error introduced by the still air layer inside the cup should always be corrected. The equation(2) suggested by Schirmer[12] is quite adequate in this regard. For highly permeablematerials, such as the MDGF used in this investigation, the resistance offered by the bounding surfaces of the test specimens can not be neglected. This should be セ 4 x
10'
Pa.s·m2·kg·l. As these corrections are made, the measured permeability for MDGF in the vicinity of 100 % rh approaches that of still air (Table 3), as indicated by an earlier series of investigations[l5-17j.
The permeability of still air under the test conditions is セ 2 x IO·lOkg·m·l·s'·pa'. This is the expected upper limit of water vapour permeability. As many parameters influence the final result, measurements done on highly permeable test specimens often can give unacceptable results that exceed the upper limit. It is gratifying to see that none of the
LACKEY ET AL. ON ASTM E 96 465
51 measurements on MDGF in this investigations resulted in a permeability value that is not acceptable. This adds to the reliability of the experimental procedure and results
reported here.
TABLE 3-- Water vapour permeabilities of several common builging materials: threevalues
that correspond to three separate test specimens are listed at each test condition.
Material Mean Water vapour Meanrh
Water vapour
rh permeability % permeability % kg·m-l·sl.p,1 kg·m-l·sl.p,1 16.1 (1.15;1.14;1.10) x 10-10 66.0 (1.22;1.20;1.19) x 10-10 17.5 (0.83;0.78;0.82) x 10-10 70.9 (1.41;1.24;1.24) x 10.10 25.6 (1.14;1.06;1.09) x 10,10 71.0 (1.51;1.60;1.45) x 10,10 MDGF 26.1 (0.95;0.97;0.96) x 10,10 80.6 (1.35;1.18;1.15) x 10,10 36.9 (1.14;1.18;1.26) x 10,10 81.2 (1.40;1.52;1.57) x 10-10 37.8 (0.99;1.00;0.97) x 10,10 90.1 (1.76;1.91;1.66) x 10,10 44.6 (1.20;1.19;1.19) x 10-10 90.4 (1.30;1.23;1.42) x 10-10 51.7 (0.55;0.57;0.57) x 10,10 94.6 (1.74;1.93;1.77) x 10,10 61.0 (1.89;1.91;1.66) x 10,10 14.4 (3.73;3.70;3.80) x 10,11 71.4 (4.71;5.14;4.82) x 1O,l1 gypsum 25.5 (3.06;3.45;3.38) x 10,11 80.7 (4.65;4.66;4.75) x 1O,l1 board 36.7 (2.78;2.87;2.87) x 10,11 90.2 (6.25;5.84;6.70) x 10,11 52.4 (2.68;2.61;2.73) x 10'11 96.2 (8.84;7.34;8.76) x 10'11 60.0 (4.22;4.03;4.50)X 10,11 16.1 (3.68;3.74;4.29) x 10'13 71.0 (1.35; 1.22;0.88) x 10'12 plywood 25.6 (4.02;4.61;4.80) x 10'13 81.2 (7.50;9.38;9.18) x 10,12 sheathing 37.8 (6.84;6.62;7.06) x 10-13 90,1 (1.39;1.51;1.19) x 10'11 51.7 (9.24;9.74;9.50) x 10,13 94.6 (2.36;2.56;2.13) x 10,11 61.0 (6.80;7,97;7.76) x 10''' 14.4 (8.80;10.9;11.9) x 10'12 71.4 (9.38;11.7;12.6) x 10'12 25.5 (7.24;8.97;9.79) x 10-12 80.7 (9.14;12.0;12.2) x 10-12
BPS
36.7 (8.29;9.79;8.02) x 10,12 90.2 (1.02;1.19;1.19) x 10,11 52.4 (6.66;8.23;7.01) x 10'12 96.2 (1.23;1.34;1.13) x 10'11 60.0 (8.93;10.8;8,75)X10-12The effect of buoyancy becomes significant in tests on highly vapour resistant
materials.
Inthose cases the measured masses should be corrected for the fluctuations in
atmospheric pressure. These measurements may take many weeks to yield analyzable results, Corrections made for the effect of buoyancy can considerably reduce the duration of the test.
466 INSULATION MATERIALS: TESTING AND APPLICATIONS
TABLE 3(continued)-- Water vapour permeabilities of several common building materials: three values that correspond to three separate test specimens are listed at each test
condition.
Material Mean Water vapour Mean rh Water vapour
rh penneability % penneability % kg·m·l·sl·Pa l kg·m-l·sl·Pa l 16.4 (3.23;2.81;2.75) x 10-11 77.9 (3.79;3.58;3.75) x 10.11 wood 24.0 (3.04;3.07;3.07) x 10-11 87_0 (4.55;3.91;3.97) x 10-11 fibreboard 36.8 (2.75;2.70;2.83) x 10-11 91.1 (4.36;4.10;4.59) x 10-11 46.5 (2.86;2.98;3.18) x 10-11 96.9 (4.27;4.87;6.13) x 10-11 66.3 i3.42;3.28;3.1I) x 10-11 16.4 (3.09;3.06;3.07) x 10-11 77.9 (4.86;4.79;4.90) x 10-11 calcium 23.5 (3.79;3.62;3.65) x 10-11 87.3 (5.31 ;5.47;6.36) x 10-11 silicate 36.8 (3.36;3.24;3.31) x 10-11 91.1 (6.51;6.45;6.97) x 10-11 47.0 (3.74;3.61;3.71) x 10-11 96.8 (8.53;7.98;9.44) x 10-11 66.3 (4.18;4.17;4.36) x 10-11 16.4 (3.03;3.00;3.00) x 10-11 77.9 (3.83;3.58;3.68) x 10-11 23.5 (3.69;3.55;3.42) x 10-11 87.3 (3.37;3.12;3.76) x 10-11 perlite 36.8 (2.98;2.89;3.04) x 10-11 91.1 (3.72;3.33;3.30) x 10-11 47.0 (3.17;3.13;3.07) x 10-11 96.8 (4.01;2.00;2.56) x 10-11 66.3 (3.26;3.27;3.47) x 10-11
For the measurements on the MDGF all the 14 conditions listed in Table 2_ were applied. Some of the results showed rather large deviations (FlG. 5).It was noticed that these corresponded to the use of the salt solutions in the cup. The same effect was seen in the measurements on the gypsum board, EPS and the plywood. Hence salt solutions were avoided in the measurements on the wood fibreboard, calcium silicate and perlite
specimens. The results on these specimens exhibit much less deviations, as shown by the
data on the wood fibreboard specimens (FlG_ 5). Probably it is more practical to use only the desiccant and distilled water to generate the necessary rh conditions inside the cup. Salt solutions provide the rh based on the principle oflowering of vapour pressure of thesolvent. Material purity and maintenance of the saturation conditions are very crucial in
attaining the prescribed rho
In cup methods, the mean rh is traditionally calculated as the average of the rh in the cup and in the chamber. This same procedure is followed in this work. Alternate methods have been suggested by other workersW!J..2]. One such method is used to analyze the data on wood fibreboard in the Appendix. At a later stage ASTM task groups should consider these approaches.
a
LACKEY ET AL. ON ASTM E 96
467
MDGF WOOD FIBREBOARD 2.5E·l0 7.0E-11
i
2.0E·1O,
,
,
;f's.oe-11•
, 8•
E 0 0,
oS
セ 1.SE·l0 §e
セUNPeᄋQQ 8 0 セ 0 0 • 0 セ 00 セ § B 8 セ o 0 セ 1.0E·1O,
•
セ 4.0E·11 80e
,
0i
5.OE·11,
セ
3.OE·11 0 80•
i O.OE+OO 2.0E·f1•
2.,.
60••
100•
20,.
60 60 100RELATIVE H..J,'.1IDtTY,% RELATIVE HJMIDITY, %
FIG. 5-- Experimental data on MDGF and wood fibreboard test specimens. The data in FIG. 5 show that the property called water vapour permeability is not
deterministic.If enough measurements are done, the stochastic nature of the property
emerges. Admittedly, the uncertainties introduced by the equipment used in the
measurements arepartly responsible for this. The major reason for this is, however, the
material inhomogenity. This is true with all hygrothermal properties of building materials. More advanced tools[mJ used for hygrothermal analysis of building materials and components have already started using the stochastic concept[l]. This is the begioning of the probabilistic approach to predict the long-term performance of building materials and
components.
REFERENCES
ill
Genge, G.R.,"Study of Thermal Insulation Standards for ResidentialApplications, " Report Submitted to the Canadian Coordinating Committee for Thermal Insulation Standards and Quality, March 1995.
ill
Joy, F. A. and Wilson,A. G., "Standardization of the Disb Method for MeasuringWater Vapor Transmission:' Proceedingsof theInternational Symposium on
Humidity and Moisture, Washington, D. C., Vol. 4, Chapter 3i, 1963, pp 259-270.
m
Kumaran, M. K., Report on E96 Round Robin Measurements, ASTM Cl6 Committee Meeting, Orlando, i 996.ill
Tveit, A., "Measurements of Moisture Sorption and MoisturePermeability of Porous Materials," Rapport 45, Norwegian Building Research Institute, UDC 532.685, i966.ill
McLean,R. C., Galbraith, G. H. and Sanders,C.
H., "Moisture Transmission Testing of Building Materials and Presentation of Vapour Permeability Values," Building Research and Practice, The Journal ofCm, No.2, 1990, pp 82-91.- - - ;
;;
•
I
I
セMMMMMMMMMMMMMMMBBBBBGqBBGB
....
468 INSULATION MATERIALS: TESTING AND APPLICATIONS
IQ] Burch, D, M., Thomas, W. C. and Fanney,A. H., "Water Vapor Permeability Measurements of Common Building Materials," ASHRAE Transactions, 1992, Vol. 98, PI. 2.
m
Hens, H., Heat, Air and Moisture Transport, Final Report, Volume I, Task I: Modelling, International Energy Agency Annex 24, Laboratorium Bouwfysica,K.
U.-Leuven, Belgium, 1996.
lID
CENtrC 89 N 336 E Draft European Standard, Determination of Water Vapour Transmission Properties, 1994.L2.l
ASTM Draft Standard, E 96-XX, Standard Test Methods for Water Vapor Transmission of Materials (Metric Version), 1996.IJ..Ql
Greenspan,L.,"Humidity Fixed Points of Binary Saturated Aqueous Solutions," Journal of Research of the National Bureau of Standards- A. Physics and Chemistrv, 1977, Vol. 81A, No. I.lill
Hansen, K. K. and Lund, H. B., "Cup Method for Determination of Water Vapour Transmission Properties of Building Materials. Sources of Uncertainty in the Method," Proceedings of Ihe 2nd Symposium, Building Physics in the Nordic Countries, Trondheim, 1990, pp 291-298.Ull Schirmer,R.ZVDI, Beiheft Verfahrenstechnik, 1938, )'<r. 6, S.170.
JJll
Pedersen C.R.,"Combined Heat and Moisture Transfer in BuildingConstructions," Ph. D. Thesis, Thermal Insulation Laboratory, The Technical University of Denmark, 1990, p 10.
IHl McGlashan, M.L.,"Physico-Chemical Quantities and Units," Royal Institute of Chemistry Monographs for Teachers, No. IS, 1971, P 8.
1J..21
Kumaran, M. K., "Moisture Transport through Glass Fibre Insulation in the Presence of a Thermal Gradient," Journal of Thermal Insulation, 1987, Vol. 10, pp 243-255.ll6J
Kumaran, M. K., "Vapor Transport Characteristics of Mineral Fiber Insulation from Heat Flow Meter Measurements," ASTM Special Technical Publication 1039,1989, pp 19-27.U1l
Kumaran, M. K., "Temperature Dependence of Water Vapour Permeability ofGlass Fiber Insulation from Heat Flow Meter Measurements," Proceedings
of the First ISHMT-ASME Heat and Mass Transfer Conference, Bombay, HMT-94-094,1994, pp 645-652.
llID
Nilsson, Lars-Olof, "Hygroscopic Moisture in Concrete- Drying, Measurements&Related Material Properties," Report TVBM-1003, Division of Building Materials, Lund Institute of Technology, Sweden, 1980, pp 44-46.
il2l
Hedenblad, G .. "Moisture Permeability of Some Porous Building Materials," Proceedings of the 4th Symposium, Building Physics in the Nordic Countries, Espoo,Volume 2,1996,747-754.[201 Karagiozis, A. N.. Salonvaara, M. and Kurnaran, M. K., "The Effect of Waterproof Coating on Hygrothermal Performance of a High-Rise Wall
Structure," Proceedings of the Thermal Performance of the Exterior Envelopes of
LACKEY ET AL.ONASTM E 96 469
APPENDIX
ALTERNATIVE ANALYSIS OF mE DATA BASED ON A METHOD SUGGESTED BY BAZANT AND NAJJAR
References 18 and 19 have used the following approach attributed to Bazant and Naijar' to detennine the dependence of the water vapour permeability of hygroscopic
materials on
rho
Ifthe cup measurements are done on a test specimen by keeping the rh on one side constant and successively increasing that on the other side in several steps, thesteady state water vapour transmission data from each such step can be used to calculate the permeability of the material as a function of the rh as follows:
I. Convert the water vapour transmission data into Kirchhoff Flow Potential by multiplying with the thickness of the test specimen.
2. Plot the Kirchhoff Flow Potential against the varying rh; if the measurements are
accurate this should result in a continuous curve.
3. The slope (L'. Kirchhoff Flow Potential / L'. rh) multiplied by(loo/ the saturation water vapour pressure) gives the water vapour permeability at any chosen rh; these
permeabilities should also be corrected for the resistance offered by the still air layer and
any surface resistances.
Though the present measurements were not intended for the above method, the
applicability of the method can be illustrated by taking all the data on the wood fibreboard
as an example. The nine sets of measurements can be divided into two subsets.Inone
subset the rh on one side of the specimen is kept constant at 0 (the desiccant) and that on the other side increased in the following sequence; 32.8 %, 47.9 %, 73.7 % and 93.0 %. in the second subset the rh on one side is held constant at 100 % (distilled water) and that on the other side increased in the following sequence; 32.6 %, 55.9 %, 73.9 %, 82.2 % and 93.6%.The water vapour transmission data when converted into the Kirchhoff Flow
Potential results in two separate curves as shown in FlG AI. The two curves demonstrate
the internal consistency of the data from nine separate sets of measurements on one
material. The fIrst subset directly gives the information on the variation of the Kirchhoff Flow Potential form 0 to 90%rho The information from the second subset can be used to extend the incomplete curve from 90%to 100%as follows. What one looks for is the Kirchhoff Flow Potential when one side of the specimen is at 0 and the other on 100 %. This can be considered as the sum of two separate Kirchhoff Flow Potentials· one for 0 to, (say) 50%and the second from 50%(0100 %. In fact any intermediate rh can be used instead of 50 % in such a calculation. All such calculations from the data give a value of(6.8 ±O.l) x 10-8kg m" s·' at 100%.
This completes the curve fromOto 100%.
Nowstep 3 listed above can be used to calculate the water vapour permeability of the wood
fibreboard at 23
0c.
Tbe results are shown in FIG A2. For comparison, the data from Table 3 and a set of results from an independent analysis of the data by one of the reviewers of this paper are also plotted in Fig A2. There is very little difference between1Sazant, Z. P. and Najjar,L.J., wNonlinear Water Diffusion In Nonsturated Concrete", Mat.&
c
470 INSULATION MATERIALS: TESTING AND APPLICATIONS
the three sets of results.Itappears then that the mean rh calculations as recommended
by
the ASTM Standard E 96 do not result in unacceptable errors.
10 B.OE-OB , - - - " - \
t
J B.OE-OBッN
セッセ
セ 4.0E-OBセ
2.0E-OBit
!f
O.OE+OO O "'::..._-'- '--_ _. J -_ _..J-_ _セ25
20 40 60 BO 100a:
!2 RELATIVE HUMIDITY,%oD1SllLLED WATER AS FIXED BOONOAAY
oDESICCANT AS FIXED BOJNDARY
FIG. AI-- The KirchboffFlow Potentials from two subsets of measurements.
7.0E-11 , - - - , l6.0E-l1 .,;
E
j
5.0E-11g
Oi 4.0E-11 セii!
w 3.0E-11 a. o boRESULTS FAOv1TABLE 3 - RESULTS FRa-tTHE ANALYSIS • RESULTS FRCM A REVIEWER
Fig A2·- Water vapour permeability of tbe wood fibreboard from tbree separate sets of data analysis.


![[DOC] Cours Merise : le MCT avec exercices d’application | Cours merise](data:image/gif;base64,R0lGODlhAQABAIAAAP///wAAACH5BAEAAAAALAAAAAABAAEAAAICRAEAOw==)