Cerebral Hemodynamics and Oxidative Metabolism
Dynamics Observed by Calibration of Functional MRI
TIMOTHY LLOYD DAVIS
B.S., Computer Science
Indiana University, 1985
S.M., Electrical Engineering
Massachusetts Institute of Technology, 1991
M.D., Harvard Medical School, 1996
Submitted to the Harvard-Massachusetts Institute of
Technology Division of Health Sciences and Technology
in partial fulfillment of the requirements for the degree of
DOCTOR OF PHILOSOPHY
at the
MASSACHUSETTS INSTITUTE OF TECHNOLOGY
FEBRUARY 1998
© Massachusetts Institute of Jhnology, 1998. All Rights Reserved.
A uthor ...
...
...
...
Division of Health Sciences and Technology
December 8, 1997
Certified by ...
Accented hv
S.... .... ... ... ...
Bruce R. Rosen, M.D., Ph.D.
Associate Professor of Nuclear Engineering
Thesis Supervisor
V
Martha . Gray, Ph.D.J.W. Kieckhefer Associate Professor of Electric 1 Engineering
Co-Director, Division of Health Sciences and Technology
MIT LIBR q R
ORy "I
A9N3
1pt
Cerebral Hemodynamics and Oxidative Metabolism
Dynamics Observed by Calibration of Functional MRI
by
Timothy Lloyd Davis
Submitted to the Harvard-Massachusetts Institute of Technology Division of Health Sciences and Technology in partial fulfillment of the requirements for the
degree of Doctor of Philosophy
Abstract
Task activation of brain cellular activity causes stimulus-dependent focal increases in perfusion out of proportion to oxidative metabolism increases, leading to the blood oxygen level dependent (BOLD) functional magnetic resonance imaging (fMRI) brain mapping signal. The physiological basis for BOLD time course and magnitude in primary visual cortex was established by comparing BOLD and perfusion-sensitive responses for matched activation paradigms. Development of a novel integrated model, incorporating susceptibility contrast biophysical and oxygen transport principles, allowed prediction of transient fMRI responses based on the underlying time-varying physiology. Coupled measurements of BOLD and perfusion during transient and extended-duration visual stimulation demonstrated rapid changes in physiological parameters which remained tightly coupled to the stimuli over time. MRI was extended to the measurement of changes in oxidative metabolism in the normal human during functionally-induced changes in cellular activity. A new method that is noninvasive and model independent calibrates the BOLD signal against perfusion-sensitive MRI, utilizing carbon dioxide breathing as a physiological reference standard. This calibration procedure provides a regional measurement of the expected sensitivity of the fMRI BOLD signal to changes in the cellular activity of the brain. Maps of the BOLD signal calibration factor showed regional heterogeneity, indicating that the magnitude of functionally-induced changes in the BOLD signal will be dependent upon both the local change in blood flow as well as the local baseline physiology of the cerebral cortex. BOLD signal is shown to be reduced by 32% from its expected level by the action of oxygen metabolism.
The calibrated fMRI technique was applied to stimulation of the human visual cortex with an alternating radial checkerboard pattern. With this stimulus oxygen consumption increased 16±1% whereas perfusion increased 45±4%. This finding indicates that oxidative metabolism is a significant component of the metabolic response of the brain to functionally-induced changes in cellular activity. Application of the model-based analysis to the human has clarified the physiological significance of transient functional MRI signals and has allowed new measurements of the metabolic changes which accompany neuronal activity.
Thesis Supervisor: Bruce R. Rosen, M.D., Ph.D.
Associate Professor of Radiology, Harvard Medical School
Director, Radiological Sciences Program, Massachusetts Institute of Technology Co-Director, Massachusetts General Hospital NMR Center
to
Dana my soul mate mother of joy, my balance I love the world because you loved me
Preface
Wildcats!!!
That was what my late grandfather John Lloyd Davis said nightly to himself as a child in the early years of this century, in order to get himself worked up enough to mount his high bed with a great running leap. It seems to help me too: here I am! Thanks, Grampa, for those stories on your knee.
As a man, I am naive enough to imagine that delivering a finished dissertation is not unlike delivering a baby. At least on the surface, all of the predictable attributes are present: desire, anticipation, testing, advice from specialists, excitement, abstinence, inklings of life, the first kick, nesting and pre-due-date hyperactivity. As is common, espe-cially with first pregnancies, the first due date passes serenely by, and everyone becomes more tense as the baby becomes heavier and harder to bear. Eventually the inevitable arrives. Family and friends gather to fondle and coddle the wrinkled and battered skin, to glimpse the opening of big round eyes, to hear the feeble newborn cry, and of course to heap congratulations and observations of beauty, strength, and intelligence on the seem-ingly perfect baby. A new life has begun.
Such is the birth of this dissertation. Fortunately, I have not been alone. I thank God daily for his presence, and for the wonderful gift of family. Without you, Dana, I may have lost faith. Without you, Elizabeth and Andrew, I would not have been grounded. Without you, Carol and LeRoy, I might not be smiling. Without you, Mom, Dad, Martha, and Brad, I would never have explored my dreams. By encouraging me to dream and teaching me to pray, you gave me the keys to fulfillment. This dissertation stands as a testament to patience, to forgiveness, to charity, to kindness, and to sacrifice, by those who continue to stand beside me and who daily enable me to live out my dreams. I hope that this rather self-centered educational exercise serves our common future, and I pray that it will inau-gurate a new epoch in my life, a time of acting for the greater good before thinking of my own ends. You all deserve my best: you have given of yourselves so deeply.
The Massachusetts General Hospital NMR Center has been a fantastic place to learn. As the size and importance of the lab continues to increase, I continue to be impressed with the spirit of open helpful communication, the vibrant enthusiasm of its members, the general esprit de corps characterizing all interactions. I believe this to be the result of active planning at the very top. Tom Brady has the magic formula for success, an impor-tant part of which seems to be encouragement of individual accomplishment for all mem-bers of the group. I thank Tom for setting the stage, and for encouraging me out onto it.
In spite of its positive attributes, the lab would have been useless to me without the shining beacon of Bruce Rosen. Bruce is equally adept on the podium, behind closed doors with a graduate student, and at home with his family. I have felt fortunate that Bruce and I share many priorities, opinions, goals, and dreams. I still do not understand why
Bruce placed my education equal with his other important goals. He must really have believed in me. I can only hope to carry on his tradition in my regard for colleagues and students. There aren't many people of whom one can see all sides and still be envious; Bruce Rosen is one of those people.
My scientific mentoring came as a powerful package: the Bruce Rosen / Robert Weis-skoff double header. I remember many meetings of the three of us, Bruce galvanizing us with the big picture, Robert revving up his analytical horsepower, and both challenging me to pitch in. Lots of gesturing, seemingly new and crazy ideas, chalk flying, keys clacking, and me, occasionally riding the wave and interjecting comments, and occasionally hope-lessly capsizing, all the while furiously taking mental notes. Through it all, it has been Robert's sense of direction, his technical acumen, his singularly interesting questions, which provided substance within the form; the centerboard in the storm, if you will. Rob-ert is the best I have ever seen at applying physics to real problems. When I was on top of my game, theory discussions with him made me believe in the future of scientific inquiry. Thinking with him makes me think better. I can only hope that some of his alacrity and wisdom have seeped through to my core, as otherwise thinking will be hard without him.
My thesis committee has been patient and dogged in its pursuit of my completion. My highest regard goes to Roger Mark, first my master's thesis supervisor and now my Ph.D. committee chair. I chose him because I knew his word was true, and because I knew he would see me through. His example has been a fitting model for my intellectual and moral development. Rox Anderson and Mike Moskowitz brought specialist knowledge, which they shared freely, along with laboratory resources and personnel. I thank each of my committee members for their seemingly boundless generosity, and for their eagerness, receptiveness, and insight. As I attempted to teach them about my work, they taught me even more. To me the mark of a true scholar is the ability to grasp a new subject with ease, to quickly understand the central issues, and to ask the most important questions. Each of my committee members has met the task graciously and effectively. For that I thank them. My many lab mates were a source of constant inspiration. I must specifically go out of my way to thank Ken Kwong and Peter Bandettini for their selfless friendship, and for teaching me both of their unique experimental approaches. Thanks to Anders Dale and Randy Buckner for late night discussions, and in advance for their promise of sushi after my defense! Thanks also to Randy for the use of his apartment during two weeks of thesis cranking. Thanks to Jack Belliveau for whispering the word in my ear that summer night. Your faith matters more than you know. Thanks to Van Wedeen for his fits of genius, and for convincing me that I am capable of similar fits, even if they are less flamboyant. Thanks to Bob McKinstry, Bernice Hoppel, Brigitte Poncelet, Alex Guimares, Jerry Box-erman, Tueng Shen, Iris Chen, Sekhar Ramanathan, and others who came before me, for showing me how to do it. There are so many names and so many moments of learning through my time at the MGH, I cannot give all their due memory.
Thanks to the support crew: Carol Barnstead, who kept Bruce dancing with me; Dee Dee Correia, who was always ready with the check book; Keiko Oh, who knows more about foreign relations than Madeline Albright; Mike Vevea, who at first just kept my bits in line but over time became a real friend; Terry Campbell, who can really make the mag-net sing. I am indebted to Professor Martha Gray, who helped me to keep my cool as I found my way through a maze of twisty passages, all alike, at MIT and MGH.
Thanks also to those who were ever ready to remind me of real world applications and the need to find solutions to clinical problems in the laboratory frame of reference: Hans Breiter, Randy Benson, Greg Sorensen, Rees Cosgrove, and now Dan Kido, Mark Bahn, Marcus Raichle, Randy Buckner, and Colin Derdeyn. I want to give you all something we can use together.
As I am now writing this as correspondent from the Mallinckrodt Institute of Radiol-ogy at Washington University in St. Louis, it would be a mistake to forget the home office. I have had tremendous support from a new mentor, Marcus Raichle. I am flattered by Marc's enthusiasm for my continued career, and trust that our friendship and his mentor-ing role will continue to grow. It is by Marc's good graces that I am able to finish this dis-sertation at all. I must also thank Drs. Evens, Balfe, and Brown for allowing me the flexibility, within the confines of one of the best radiology residencies in the country, to combine research with clinical training, and for being patient as I learn to juggle careers.
I am leaving behind in Boston a long list of too many people whose advice, friendship, and support were indispensable. Parts of me will remain moored in the Charlestown Navy Yard and in Cambridgeport because of you. I think of Jack and Lisa, who with their two children remain in Arlington pursuing the Boston dream while many of their close friends have left. We wait for Gary and Stephanie to find a post closer to us, or vice-versa, so that we can help raise our godson. If the distance is only physical, why do our hearts ache?
Research training is expensive. I have accumulated over $140,000 in Ph.D. tuition charges alone. In terms of output, that's almost $10,000 per coauthored paper, or $14,000 per formal talk, or $4300 per meeting abstract. Clearly generous agencies have been pay-ing the bills. I am indebted to the United States Air Force Laboratory Graduate Fellowship program which, through mentor Dr. Sherwood Samn at the School of Aerospace Medicine in San Antonio, supported me for three years as this project began. I am also indebted to Sterling-Winthrop Pharmaceuticals, the Isadore and Bertha Gudelsky family foundation, and the Walter Hennesey foundation, for graduate fellowships, and to the International Society for Magnetic Resonance in Medicine for travel support. The MGH NMR Center has graciously supported me as well, through its own resources and those of the National Institutes of Health and the Whitaker Foundation. I am grateful to the MIT Division of Residence and Campus Activities, who employed Dana and me for seven years as gradu-ate resident tutors. The built-in social environment, free baby-sitting, and support groups added measurably to our success, and enabled life without financial ruin.
Although it is clearly expensive, I maintain a belief in basic science and education as investments in our shared future. It is critical that we foster continued dialog with these and other funding resources in order to maintain their belief as well.
Table of Contents
Preface... ... . . 7
List of Figures ... ... 13
L ist of T ables ... ... 15
1. Functional MRI as a window on physiology ... .... 17
1.1 Opportunities and significance for functional neuroimaging ... 19
1.2 Challenges for application of MRI to functional neuroimaging...21
1.3 Dissertation Overview ... 22
R eferences ... ... 25
2. Transient functional MRI signals: physiological basis and biophysical models, with application to visual cortex ... 29
2.1 Introduction ... ... 3 1 2.2 Background: Characteristics of dynamic BOLD signals... 32
Baseline ... 33
Early dip ... 33
Rise to peak and plateau ... 34
Decay, undershoot, and recovery ... ... 35
2.3 T heory ... ... 35
Background: NMR Signal Production ... ... 36
Blood oxygenation level dependence: signal magnitude estimation ... 43
Sensitization to physiology in the pulse sequence ... 46
2.4 Dynamic Functional MRI Experiments... ... 48
Experimental Methods ... 48
Experimental Results ... ... 52
2.5 Computer Simulations of Physiology and BOLD contrast ... 56
Dynamic modeling of oxygen transport ... 56
Simulation Methods ... 60
Simulation Results ... 62
2.6 D iscussion ... ... 68
Baseline ... 68
T he early dip ... 69
Rise to peak and plateau ... ... 70
Decay, undershoot, and recovery ... 72
2.7 C onclusion ... ... 77
R eferences ... ... 79
3. Hemodynamics and metabolism during prolonged brain activation ... 83
3.1 Introduction ... ... 85
3.2 M ethods ... ... 87
Selective Physiological MRI ... ... ... 87
Neuronal and Physiologic Parameter Modulation ... 89
3.3 R esults ... ... 90
MRI Parameter Modulation ... ... 90
Physiologic Parameter Modulation ... 95
Summary of long-duration responses ... 101
3.4 D iscussion ... ... 102
3.5 C onclusions ... ... 104
R eferences ... ... 107
4. Calibration of functional MRI signals: mapping and dynamics of oxidative metabolism ... ... 109 4.1 Introduction ... 111 4 .2 T heory ... 112 4 .3 M ethods ... ... 115 4.4 R esults ... ... 118 4.5 D iscussion... 124
4.6 Appendix: Error Analysis... . 130
R eferences ... ... 133
5. Physiological implications and the future of functional MRI ... 37
5.1 The current state of functional MRI ... 139
5.2 Novel methodologies ... 142
5.3 Future work and potential applications ... ... 142
5.4 Implications for physiology and functional imaging... 144
5.5 Ethical considerations ... 145
List of Figures
Figure 2.1: Characteristic BOLD signal transient behavior... .... 32 Figure 2.2: Signal attenuation functions determined by Monte Carlo modeling for BOLD
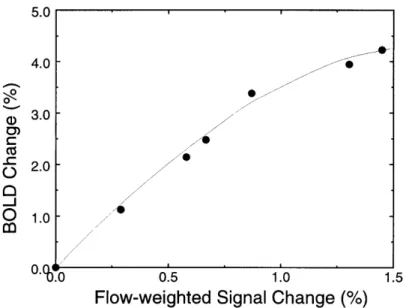
contrast... ... 46 Figure 2.3: Average BOLD and CBF responses to stimuli of varying length ... 53 Figure 2.4: Changes in BOLD accompanying changes in CBF, from peak changes in Figure 2.3, show saturation effect ... ... 54 Figure 2.5: Comparison of BOLD activation magnitude to post-stimulus undershoot.
Scat-ter plot of four subjects (circle, square, triangle, diamond) shows undershoot versus BOLD response magnitude for each activating pixel separately. ... 55 Figure 2.6: Activation, post-stimulus undershoot, and perfusion activation maps during re-sponse to a 60 s flashing checkerboard stimulus ... 56 Figure 2.7: Three compartments for oxygen: capillary, tissues, and veins within an imaging
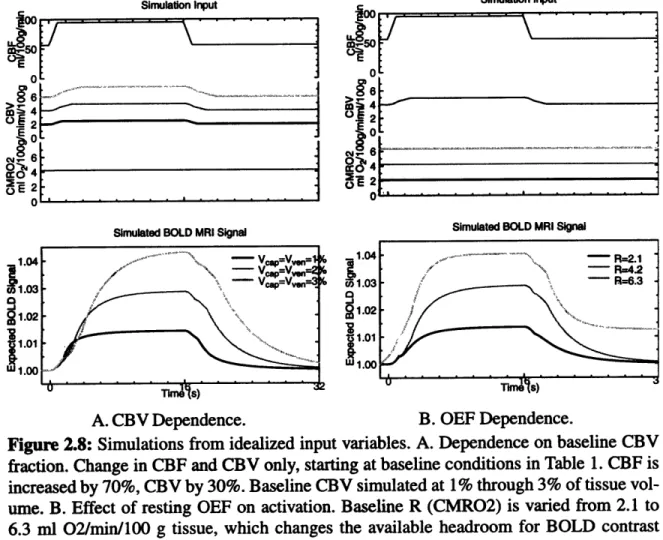
volum e ... ... ... 57 Figure 2.8: Simulations from idealized input variables. A. Dependence on baseline CBV
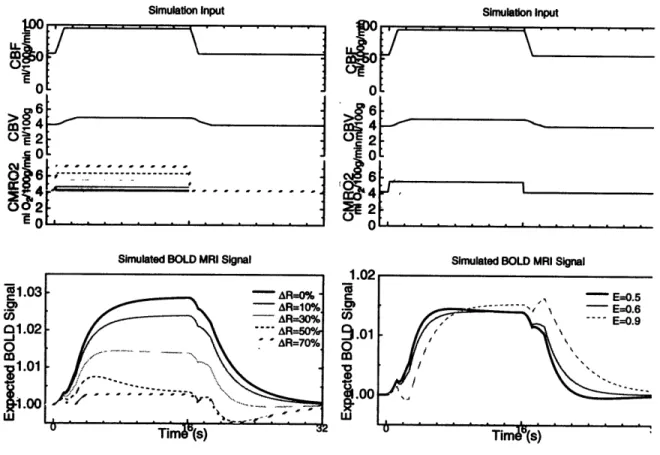
fraction. B. Effect of resting OEF on activation ... 63 Figure 2.9: Coupling activation to hemodynamics and metabolism. A. When R (CMRO2)
increases during activation, the oxygen extraction increases. B. The dynamics of oxygen delivery are affected by the extraction coefficient E ... 65 Figure 2.10: Temporal decoupling as a source of transient fMRI signal rebound. A. Volume changes are delayed with respect to flow changes. B. CMRO2 return to baseline is delayed by 5 and 10 seconds...66 Figure 2.11: Comparison with experiment: 10 s delay in R metabolic rate return to baseline
after causes a post-stimulation undershoot that matches experimental data. ... 73 Figure 3.1: Long duration stimulus paradigm... ... 88 Figure 3.2: Activation images obtained from the four subjects in the study in part one...91 Figure 3.3: Averaged (a) BOLD contrast signal and (b) flow contrast signal from the visual
cortex during extended duration stimulation ... ... 92 Figure 3.4: Time course series obtained using a similarly T2*-weighted sequence as in Part la, but with a TR of 10 sec to further reduce inflow sensitivity. ... 93
Figure 3.5: Assessment of the spatial heterogeneity of the extended duration signal chang-es. A. Anatomical image. B. Percent change image. C. Calculated percent change, relative to the first 2 minutes of activation, at the end of 20 minutes stim-ulation ... ... ... 94 Figure 3.6: Blood oxygenation sensitive signal from the visual cortex during 10 Hz
alternating checkerboard stimulation obtained using multi shot spiral
scanning ... ... ... 95 Figure 3.7: Blood oxygenation sensitive signal from the visual cortex during eight minutes
of "blob" stimulation ... ... ... ... 96 Figure 3.8: Blood oxygenation sensitive (TE = 40 ms, TR = 3 sec, q = 900) signal from the visual cortex during blob stimulation (8 Hz flashing diffuse red) and interblob stimulation (8 Hz alternating high spatial frequency black and white pin-w heel) ... ... ... 97 Figure 3.9: Flow change characteristics, measured in V1 and S1 in 16 subjects using
P E T . ... ... 9 8 Figure 3.10: Blood oxygenation sensitive signal from the visual cortex during 8 Hz flashing
diffuse red LED stimuli using GrassTM goggles ... 99 Figure 3.11: Blood oxygenation sensitive signal from the visual cortex during either 10 Hz
flashing white and during non-flashing white light stimulation ... 100 Figure 3.12: Blood oxygenation sensitive signal from the visual cortex during steady (non-flashing) white light. The time course of the signal from region a (black voxels) and region b (white voxels) are shown ... 101 Figure 4.1: Model dependency on design parameters. ... 117 Figure 4.2: BOLD and CBF time courses normalized to the hypercapnia signal change,
av-eraged across 8 paired trials... ... 121 Figure 4.3: Maps from trial (A) of each subject from Table 4.1 show regional
variations ... ... ... 122 Figure 4.4: Noise propagation simulation results, from Monte Carlo simulation with means and second order noise characteristics taken to match single voxel or nine voxel averages from the primary data. ... ... 124
List of Tables
Table 2.1 : State equations and steady state solutions for the 3-compartment model with a
distributed capillary compartment ... ... 58
Table 2.2 : Exponential constants for coupled transport equations. ... 59
Table 2.3 : Oxygen transport simulation parameters ... 61
Table 3.1 : Long-term BOLD and CBF responses from various stimuli ... 102
Chapter 1
Functional MRI
as a window on
physiology
Often, the less there is
to justify a traditional custom, the harder it is to get rid of it.
- Mark Twain
The thesis that functional activity in the brain is directly related to alterations in cerebral metabolism and blood supply was presented by Roy and Sherrington over one hundred years ago [1]. This relationship has been firmly established [2, 3, 4], and used as the basis for radionuclide maps of activation-induced changes in cerebral blood flow (CBF) and volume (CBV), and cerebral metabolic rates for glucose (CMRglc) and oxygen (CMR 2) by subtracting resting from stimulated states [5, 6]. In the last several years NMR tech-niques have been developed which are sensitive to changes in CBV, CBF, and blood oxy-genation [7, 8, 9]. By analogy to previous positron emission tomographic (PET) results, hemodynamic measurements with functional magnetic resonance imaging (fMRI) can also be used to map changes in cerebral neuronal activity.
This introductory chapter first reviews the opportunities presented by functional MRI for the study of hemodynamics, metabolism, and brain activation. A discussion of the the-oretical and methodological challenges to physiological interpretation is presented, fol-lowed by an overview of the dissertation.
1.1 Opportunities and significance for functional neuroimaging
Understanding the link between dynamic fMRI signals and their underlying physio-logical origins would provide a distinct window on physiology, with increased temporal and spatial resolution over PET measurements. Already functional MRI shows great promise for brain mapping techniques, by allowing for the first time single event detection using repeated trials in the same individual [10], enhanced spatial discrimination for map-ping fine detail within primary and secondary visual processing regions [11], and allowing discrimination between response times, all of which would have been impractical using other techniques. The combination of brain mapping techniques with high resolution
tomical imaging has also fostered a new method for brain localization based on the topog-raphy of the unfolded cortical surface [11], as opposed to three dimensional standardized coordinates referenced to a standard, abnormal, folded cortex [12].
These clear advances are hampered by the questionable interpretability of the most widely utilized functional brain mapping technique: so-called blood oxygenation level dependent (BOLD) MRI, which is sensitive to static inhomogeneities in the local mag-netic field through an effect on transverse NMR magmag-netic coherence. Despite advances in magnetic susceptibility contrast biophysics [13, 14, 15, 16], the link between neuronal activation and BOLD signal remains dependent on physiological assumptions which may vary between subjects and between brain regions, and which govern the BOLD response magnitude and time course. Hundreds to thousands of BOLD experimental paradigms have been designed over the past half decade without a clear physiological basis for inter-preting magnitude or regional specificity of signal changes.
It is the missing link of physiology between cellular activity of the brain and MRI phe-nomenology which is the topic of this dissertation. By harnessing the unprecedented spa-tio-temporal resolution of functional MRI for physiological measurements, long-standing controversies surrounding possible nonoxidative metabolic processing [17], and possible slow conversion to oxidative metabolism over time [18], may be seen in fresh light, and possibly be put to rest.
Features of the time course of BOLD signals, namely an early transient dip before the positive activation signal, and a variably present post-stimulation undershoot and recovery phase, become interpretable in the context of a dynamic metabolic model. Once explained, their purported utility for better localizing brain function can be better addressed.
The magnitude of BOLD signal differences between regions is not directly interpret-able. Although preliminary reports showed correspondence between magnitudes in a
given region and previous measures of graded neuronal activity [19], evaluation of magni-tude variations between regions presupposes consistent baseline deoxyhemoglobin con-tent and oxidative metabolism changes during activation. Uncertainty in the vailidity of this supposition limits comparability between disparate brain regions; moreover, any brain region in which changes in blood flow during activity are matched by changes in meta-bolic oxygen uptake would be rendered invisible to detection of activation. We will show how the utilization of flow-sensitive MRI would sensitize to such differences, and would clarify the interpretability of the BOLD signal.
1.2 Challenges for application of MRI to functional neuroimaging
Despite the superficial similarities between PET and fMRI, there are fundamental dif-ferences between the two modalities that provide both a challenge and significant potential for the MR-based techniques. At the heart of this challenge lies the complexity of the rela-tionship between perturbations in cerebral physiology and the measurable changes in MRI signal. Unlike radionuclide measurements, for which the signal output from a voxel (the gamma ray emission) is directly proportional to the concentration of the tracer within that voxel, the signal changes observed in functional MR images are dependent upon many physical and physiological parameters.
Inherent to most fMRI techniques, which are sensitive to changes in blood oxygen-ation, are the complexities of the magnetic susceptibility contrast phenomenon. In tissue, the diffusion of protons in the presence of the magnetic field variations in or around deox-yhemoglobin is now recognized as the dominant source of the oxygenation dependence of the measured transverse relaxation time (T2) of blood [20]. Work continues on under-standing the interaction between the full set of physiologic parameters (including capillary and macrovascular blood volume changes, water exchange between the vascular and
extravascular compartments, distribution and concentration of deoxyhemoglobin, tissue perfusion and macrovascular flow) and this common form of fMRI contrast.
Although less effectively exploited than the deoxyhemoglobin-sensitive contrast mechanism, blood flow-sensitive fMRI has a biophysical basis that is less complex. MRI sensitivity to inflowing spins was noted in the first published reports using the deoxyhe-moglobin-sensitive techniques [8], and has since been used to track blood flow changes from arteries to veins [21]. Differences between direct flow signal and deoxyhemoglobin concentration time courses might be indicative of changes in blood volume or oxygen uptake. The difference between BOLD and CBF measurements forms a basis for compar-ison with PET observations of decoupling of oxidative metabolism from blood flow during activation [2, 22].
Blood oxygen sensitization and blood flow sensitization have been shown to produce dynamic mapping MRI signals. No such noninvasive method exists for the measurement of blood volume separate from blood oxygenation. This is because oxygenated blood has similar NMR characteristics to the surrounding tissue; an intravascular NMR-sensitive tracer is required. Intravascular contrast administration may provide a method for dynamic blood volume imaging in humans, and has recently been shown effective using a novel contrast agent in animals [23]. Because of the difficulty of measuring blood volume dynamics directly, we assume a flow-volume coupling as measured previously [24] and recently confirmed in animals using a novel contrast agent technique [23].
1.3 Dissertation Overview
The synthesis of blood oxygenation sensitive and blood flow sensitive MRI methods via biophysical models of MRI signal production offers unique opportunities for new understanding of changes in oxidative metabolism in the brain. It will inform approaches
to functional neuroimaging by MRI, and promises to allow extension of functional MRI interpretations and applications.
In Chapter 2, the background for later chapters is laid with a description of MRI con-trast mechanisms. A dynamic model of oxygen delivery and cerebrovascular dynamics is described, and related to transient functional MRI signals. This model links blood flow, volume, and oxygenation, oxygen extraction to tissue, and metabolic oxygen demand. BOLD signal time course is predicted based on changes in interrelated physiological vari-ables. Novel experiments comparing magnitude and time course of perfusion and deoxy-hemoglobin sensitive signals were performed and are discussed in relation to two major outstanding questions: (1) the visibility and origin of an early blood oxygen level depen-dent (BOLD) signal dip before the positive activation signal, and (2) the origin of a vari-ably-observed post-stimulation undershoot in the BOLD signal which can take as long as one minute to return to baseline. Two prime candidates for physiological explanation of the post-stimulation undershoot are discussed: changes in metabolic rate for oxygen, and changes in blood volume separate from blood flow.
Chapter 3 describes activation signal characteristics for long-term stimulation, with the objective of identifying possible conversion from nonoxidative to oxidative metabolic processing as reported by others. Recent work has suggested that immediate brain activity increases are accompanied by nonoxidative glucose metabolism increases [17] and lactate generation [25, 26, 18], which is slowly reversed as oxidative metabolism adjusts over several minutes. This recent hypothesis is challenged by our observations of rapid and sta-ble increases in oxygen uptake during photic stimulation. Our findings are concordant with dynamic optical spectroscopy measurements of hemoglobin accomplished through cranial windows [27, 3, 28, 29, 30].
Chapter 4 describes a novel calibration method which allows direct measurement of changes in oxidative metabolism by use of a physiological reference standard: hypercap-nia. This final development in MRI methods cuts through the epiphenomenology other-wise inherent to fMRI by calibrating the blood oxygen level dependent signal, to allow mapping by MRI of true metabolic and hemodynamic variables. Several physiological implications of magnitude and variability in the BOLD calibration parameter and in the activation-induced metabolic rate for oxygen are discussed.
In order to maintain readability of the individual chapters separately, some basic intro-ductory material is repeated, with the exception that general background and explanatory material applicable to any of the chapters is more detailed in the introduction to Chapter 2.
References
[1] C. S. Roy and C. S. Sherrington. "On the regulation of the blood-supply of the brain." J Physiol (London), 11:85-108, 1890.
[2] P. T. Fox, M. A. Mintun, M. E. Raichle, F. M. Miezin, J. M. Allman, and D. C. V. Essen. "Mapping human visual cortex with positron emission tomography." Nature, 323:806-9, 1986.
[3] R. D. Frostig, E. E. Lieke, D. Y. Tso, and A. Grinvald. "Cortical functional architecture and local coupling between neuronal activity and the microcirculation revealed by in vivo high-resolution optical imaging of intrinsic signals." Proc. Natl. Acad. Sci. USA, 87:6082-6, 1990.
[4] M. E. Raichle. "The metabolic requirements of functional activity in the human brain: a positron emission tomography study." Adv Exp Med Biol, 291:1-4, 1991. [5] S. E. Petersen, P. T. Fox, M. I. Posner, M. Mintun, and M. E. Raichle. "Positron
emission tomographic studies of the cortical anatomy of single-word processing." Nature, 331:585-589, 1988.
[6] P. T. Fox, F. M. Miezin, J. M. Allman, D. C. V. Essen, and M. E. Raichle. "Retinotopic organization of human visual cortex mapped with positron-emission tomography." J. Neurosci., 7:913-22, 1987.
[7] J. W. Belliveau, B. R. Rosen, H. L. Kantor, R. R. Rzedzian, D. N. Kennedy, R. C. McKinstry, J. M. Vevea, M. S. Cohen, I. L. Pykett, and T. J. Brady. "Functional cerebral imaging by susceptibility-contrast NMR." Magn. Reson. Med., 14:538-46,
1990.
[8] K. K. Kwong, J. W. Belliveau, D. A. Chesler, I. E. Goldberg, R. M. Weisskoff, B. P. Poncelet, D. N. Kennedy, B. E. Hoppel, M. S. Cohen, and R. Turner. "Dynamic magnetic resonance imaging of human brain activity during primary sensory stimulation." Proc. Natl. Acad. Sci. USA, 89:5675-9, 1992.
[9] P. A. Bandettini, E. C. Wong, R. S. Hinks, R. S. Tikofsky, and J. S. Hyde. "Time course EPI of human brain function during task activation." Magn. Reson. Med., 25:390-7, 1992.
[10] R. L. Buckner, P. A. Bandettini, K. M. O'Craven, R. L. Savoy, S. E. Petersen, M. E. Raichle, and B. R. Rosen. "Detection of cortical activation during single trials of a cognitive task using functional magnetic resonance imaging." Proc. Natl. Acad. Sci. USA, 93:14878-14883, 1996.
[11] R. B. H. Tootell, J. D. Mendola, N. K. Hadjikhani, P. J. Ledden, A. K. Liu, J. B. Reppas, M. I. Sereno, and A. M. Dale. "Functional analysis of V3A and related areas in human visual cortex." J. Neurosci., 17(18):7060-7078, 1997.
[12] J. Talairach and P. Tournoux. Co-planar stereotaxic atlas of the human brain. Thieme Medical, New York, 1988.
[13] D. A. Yablonskiy and E. M. Haacke. "Theory of NMR signal behavior in magnetically inhomogeneous tissues: the static dephasing regime." Magn. Reson.
Med., 32:749-763, 1994.
[14] J. L. Boxerman, L. M. Hamberg, B. R. Rosen, and R. M. .Weisskoff. "MR contrast due to intravascular magnetic susceptibility perturbations." Magn. Reson. Med., 34(4):555-566, 1995.
[15] S. Ogawa, R. Menon, D. Tank, S. Kim, H. Merkle, J. Ellermann, and K. Ugurbil. "Functional brain mapping by blood oxygenation level-dependent contrast magnetic resonance imaging: A comparison of signal characteristics with a biophysical model." Biophys. J., 64:803-812, 1993.
[16] W. R. Bauer, K.-H. Hiller, F. Roder, E. Rommel, G. Ertl, and A. Haase. "Magnetization exchange in capillaries by microcirculation affects diffusion-controlled spin relaxation: a model which describes the effect of perfusion on relaxation enhancement by intravascular contrast agents." Magn. Reson. Med.,
35(1):43-55, 1996.
[17] P. T. Fox, M. E. Raichle, M. A. Mintun, and C. Dence. "Nonoxidative glucose consumption during focal physiologic neural activity." Science, 241:462-4, 1988. [18] J. Frahm, G. Krueger, K.-D. Merboldt, and A. Kleinschmidt. "Dynamic uncoupling
and recoupling of perfusion and oxidative metabolism during focal brain activation in man." Magn. Reson. Med., 35(2):143-148, 1996.
[19] K. K. Kwong, C. E. Stern, J. R. Baker, J. W. Belliveau, R. B. H. Tootell, H.-M. Cheng, and B. R. Rosen. "Localization of visual functions and vep signals with functional MRI." Invest. Ophthal. Vis. Sci., 34:813, 1993.
[20] K. R. Thulborn, J. C. Waterton, P. M. Matthews, and G. K. Radda. "Oxygenation dependence of the transverse relaxation time of water protons in whole blood at high field." Biochim Biophys Acta, 714:265-270, 1982.
[21] R. R. Edelman, B. Siewert, D. G. Darby, V. Thangaraj, A. C. Nobre, M. M. Mesulam, and S. Warach. "Qualitative mapping of cerebral blood flow and functional localization with echo-planar MR imaging and signal targeting with alternating radio frequency (STAR) sequences: applications to MR angiography." Radiology, 192:513-520, 1994.
[22] A. Gjedde, S. Ohta, K. Hiroto, and E. Meyer. "Is oxygen diffusion limiting for blood-brain transfer of oxygen?" In Brain Work and Mental Activity, Alfred Benzon Symposium 31, pages 177-184, 1991.
[23] J. B. Mandeville, J. A. Marota, B. E. Kosofsky, J. Keltner, R. Weissleder, B. R. Rosen, and R. M. Weisskoff. "Dynamic functional imaging of relative cerebral blood volume during rat forepaw stimulation." Magn. Reson. Med., 1997. (in press). [24] R. L. Grubb, M. E. Raichle, J. O. Eichling, and M. M. Ter-Pogossian. "The effects of
changes in PaCO2 on cerebral blood volume, blood flow, and vascular mean transit time." Stroke, 5:630-639, 1974.
[25] B. Jenkins, J. Belliveau, and B. Rosen. "Confirmation of lactate production during photic stimulation: improved protocols using inter- and intra-subject averaging." In Proceedings, 11th Society of Magnetic Resonance in Medicine, page 2145, 1992.
[26] D. Sappey-Marinier, G. CAlabrese, G. Fein, J. Huag, C. Biggins, and M. Weiner. "Effect of photic stimulation on human visual cortex lactate and phosphates using lh and 31P magnetic resonance spectroscopy." J. Cereb. Blood Flow Metab., 12:584-592, 1992.
[27] Y. Kinuta, H. Kikuchi, M. Ishikawa, O. Hirai, and K. I. S. Kobayashi. "Reflectance spectrophotometric measurement of in vivo local oxygen consumption in the cerebral cortex." J. Cereb. Blood Flow Metab., 7:592-8, 1987.
[28] I. J. Rampil, L. Litt, and A. Mayevsky. "Correlated, simultaneous multiple-wavelength optical monitoring in vivo of localized cerebrocortical NADH and brain microvessel hemoglobin oxygen saturation." Journal of Clinical Monitoring, 8(3):216-225, 1992.
[29] T. L. Davis, P. Dwyer, B. R. Buchbinder, R. Cosgrove, R. Anderson, R. M. Weisskoff, and B. R. Rosen. "Correspondence between presurgical fMRI and intraoperative optical assessment of human brain function." In Proceedings, 3rd Society of Magnetic Resonance, 1995. (Abstract).
[30] D. Malonek and A. Grinvald. "Interactions between electrical activity and cortical microcirculation revealed by imaging spectroscopy: implications for functional brain mapping." Science, 272:551-554, 1996.
Chapter 2
Transient functional
MRI signals:
physiological basis and
biophysical models, with
application to visual cortex
Chi troppo abbraccia nulla stringe.
He who embraces too much can squeeze nothing.
- Italian proverb
2.1 Introduction
What are the possible physiological mechanisms for task-related changes in brain MRI signals? It is the aim of this chapter to explore in detail the nature of transient blood oxy-gen level dependent (BOLD) MRI signals observed during the several seconds after changing brain state, and to identify and characterize physiological variables which may be responsible for these transient signals.
Our work is motivated partly by our observation that temporally resolved BOLD sig-nals differ from dynamic cerebral blood flow (CBF) MRI, particularly in the post-stimula-tion period, when a profound rebound "undershoot" and recovery is observed which can last up to a minute. This BOLD undershoot is strong in primary visual cortex, but is not seen using CBF contrast [9, 10], and, as an unexplained change in hemoglobin oxygen-ation, has been postulated as a possible marker for oxidative metabolism [11 ]. Except for the calibrated functional MRI method described later (Chapter 4), it remains uncertain whether changes in metabolic demand for oxygen are related to brain activity, and whether they have a measurable effect on the BOLD signal magnitude or dynamics.
After laying the foundations of BOLD signal phenomenology and theory of functional MRI signal production, we report experiments which show differences in time courses and regions responding with BOLD signal, regions generating post-stimulation BOLD under-shoot, and regions which show increased CBF signal in response to photic stimulation in primary visual cortex. To explain our primary data, and to further examine the dynamics of linkage between hemodynamics, metabolism, and functional MRI, we report a model of blood oxygen level dependent (BOLD) MRI signals in terms of cerebral blood flow (CBF) and volume (CBV), integrated with a kinetic model of oxygen transport and metabolic uptake, designed to predict the temporal evolution of MRI signals based on postulated physiological events. This dynamic modeling addresses limitations in the interpretation of
quasistatic estimates of change in metabolic rate for oxygen as described in Chapter 4. The dynamic departure from equilibrium between capillary, tissue, and venous oxygen-ation in response to changes in blood flow and oxygen demand require an approach which includes spatial and temporal distribution. This chapter also provides motivation for the calibration approach presented in Chapter 4 as a method to remove the remaining ambigu-ities.
2.2
Background: Characteristics of dynamic BOLD signals
plateau
rise decay
baseline 3s timINII
early dip recovery
undershoot
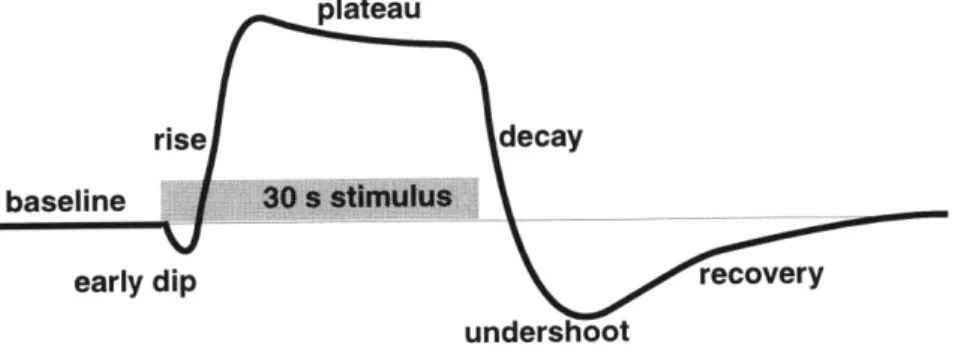
Figure 2.1: Characteristic BOLD signal transient behavior. The sequential phases of sig-nal evolution are described in detail below.
The phenomenology of BOLD signal response to sensorimotor activation has been well characterized, as illustrated in Figure 2.1. Following an initial delay of 2 seconds, during which some have detected an early dip in signal, there is a steady rise to activated level which reaches its maximum in less than 8 seconds. The signal remains at a plateau, possibly losing some of its original magnitude during continued task activation, and promptly decays away within 5 s of cessation of stimulus. In many experiments and most prominent in primary visual cortex, there is a post-stimulation undershoot which has been measured up to 50% of the magnitude of the positive signal deflection, followed by a recovery with time constant on the order of 15 s. These phases of signal evolution are elab-orated below.
2.2.1 Baseline
It may be taken for granted that the resting brain has a relatively constant blood flow and metabolism; this is seen as a necessary starting point for BOLD functional MRI acti-vation experiments for detection of changes from a "resting" state. However, a plethora of intrinsic physiological rhythms, including electroencephalographically detected alpha and beta rhythms, respiratory fluctuations in central venous pressure and intracranial pressure, and vascular pulsations at the heart rate all may contribute physiological variation to the MRI signal [12]. Moreover, bilaterally symmetric correlated noise has been detected which conforms to borders within somatosensory cortices, suggesting that neuronal rhythms may generate hemodynamic rhythms detectable by fMRI [13, 14]. Fortunately for the purposes of stimulus-locked signal analysis, averaging over these relatively shallow modulated intrinsic rhythms allows comparison of activated to non-activated brain, albeit with increased physiological noise which might be removed with appropriate modeling and experimental modifications. It remains to be seen whether entraining of intrinsic rhythms, for instance entraining of respiratory rate by stimulus presentation, may adversely impact the identification of regions which may or may not correspond with brain directly subserving the processing of stimuli. In the remainder of this work, we make tacit assumption of a stationary baseline state.
2.2.2 Early dip
Optical spectroscopic experiments have described an early oxygen desaturation within active columns of striate cortex, and within active whisker barrels in primary somatosen-sory cortex, which occur within 100 ms of sensomatosen-sory stimulation, followed 2 s later by vas-cular engorgement and increased oxygen saturation in draining veins [15, 16]. BOLD MRI search for this early desaturation phenomenon has been surprisingly difficult. Hennig was the first to report an early signal in spectroscopic measurements of water free induction
decay within visual cortex which corresponds in temporal nature to the early dip [17]; however, these experiments would predict a larger BOLD MRI effect than is observed. Working at high field, Menon was able to detect an early dip in the population of pixels which also exhibit a large stimulation undershoot, leading to the assertion that post-stimulation undershoot and early dip signals may be produced by the same mechanism, namely, increased oxygen utilization [11]. If this were true, then the early dip and post-stimulation undershoot may be more specific markers for location of neuronal activation than the apparent luxury perfusion increase observed with BOLD. Simulations described in the current chapter of BOLD during changes in oxygen demand ahead of vascular response show putative origins and expected magnitudes of this small signal perturbation. 2.2.3 Rise to peak and plateau
The increase in BOLD-weighted MRI signal reflects decrease in deoxyhemoglobin, counter to early reports of hemoglobin-based contrast, which had originally assumed that active brain would cause increased oxygen utilization, and thus increased, rather than decreased, oxygen desaturation in blood [18]. This reversal of expected contrast has been attributed to uncoupled increased blood flow to active brain out of proportion to possible increased oxygen extraction, as described by Fox and Raichle who compared PET CBF and oxygen extraction measurements [5]. Maintenance of the BOLD signal requires main-tenance of uncoupling between blood flow increase and oxidative metabolism, explored in detail in Chapter 3 and quantified in Chapter 4. We consider here the dynamics of this rise. Early functional MRI reports describe a rise to peak time from 7 to 9 seconds [10]. These are concordant with impulse-response measurements [19, 20] which show a 2 sec-ond delay followed by a near gaussian cerebrovascular impulse response with peak at 6 seconds after stimulus onset within visual cortex. It is clear that the rise to peak is a
tion both of blood flow response time and deoxyhemoglobin washout time. Analysis of the plateau period during long-duration stimuli is the subject of Chapter 3.
2.2.4 Decay, undershoot, and recovery
The return of signal following cessation of stimulus may be more or less rapid than signal onset. The post-stimulus behavior is in fact widely variable across cortex. This may in part reflect variations in neuronal activity following external stimulus. An example is given by studies of the motion aftereffect: visual area MT response following an afteref-fect-generating stimulus persists much longer than the response following a balanced-motion stimulus [21], possibly driven by latent apparent balanced-motion in the visual field rather than the external stimulus alone.
For most stimuli in primary visual cortex, however, the return to baseline is rapid. In fact, many stimuli, particularly high contrast flashing visual stimuli, produce a profound post-stimulation rebound in primary visual cortex which is up to half the magnitude of the initial plateau, and which returns to baseline over the following 30 s. Could neuronal deac-tivation be responsible? Is blood flow rebounding as well? If not, then can oxygen trans-port dynamics, dynamic changes in oxygen metabolism, or blood volume lag explain the findings? These questions form the main focus of the current chapter.
2.3 Theory
We begin by examining NMR signal production in physiological systems where perfusion, variations in perturbations by magnetic susceptibility, and compartments with different relaxation characteristics coexist in a single imaging volume. For human brain we describe the important compartments of interest and expected results of physiological maneuvers. Using a model of blood and oxygen transport, we then investigate the tempo-ral relationship between hemodynamic changes and oxidative metabolism, and the
ing BOLD signal changes which would be expected based on a kinetic model of oxygen delivery.
2.3.1 Background: NMR Signal Production
The proton NMR signal is produced when the relaxed portion of hydrogen nuclei in a strong magnetic field are perturbed such that they exhibit coherent magnetization project-ing into the plane transverse to the axis of main magnetic field. This projected coherent magnetization precesses at the Larmor frequency (42.57 MHz per Tesla for 1H), a phe-nomenon attributable in the classical mechanics model to the interaction between angular momentum and magnetic moment, just as a spinning top precesses in a gravitational field with a frequency dependent on both angular momentum and mass. Magnetization can be "tipped" from the longitudinal axis into the transverse plane or out of the transverse plane either aligned or anti-aligned in the longitudinal axis by coupling to an electromagnetic coil driven by current oscillating at or near the Larmor frequency. The oscillating magnetic field produced by the coil can be thought of as a second magnet precessing along with the spins, and with which the spins attempt to align during the duration of the oscillating pulse. Paul Lauterbur discovered that pulses can be selectively directed at anatomical regions (e.g. a slice of tissue in the transverse plane of the magnet) by applying a relatively small gradient of magnetic field (10 mT/m) during the delivery of a band-limited pulse. To
sin wt
excite a defined block of tissue uniformly, the fourier transform of a square wave (
)
is used to modulate the magnetic coil pulse around the Larmor frequency for the tissue at the center of the block. The same coil, inductively coupled to the tissue sample, can then be used to detect the small changes in magnetization from transverse oscillating spins. Demodulation of the resulting radiofrequency modulations in current within the coil forms the nuclear magnetic resonance (NMR) measurement.
Relaxation phenomena: The spins will gradually realign with the main magnetic field and thus regain the potential to deliver coherent magnetization when excited; this occurs in a manner well described in detail as an exponential recovery, with time constant T1. The relaxation mechanism responsible for longitudinal magnetization recovery is
called spin-lattice relaxation.
The magnetic spins will also gradually lose their measurable projection into the trans-verse plane. This results from several simultaneous processes: lattice relaxation, spin-spin momentum transfers which cause the material to lose coherence, and loss of spin-spin coherence due to local differences between magnetic fields as seen by the nucleus, which slightly change the effective Larmor frequency. If these local field differences are due to the local environment of the molecule to which the atom is attached, the shifts are repro-ducible and measurable, and termed chemical shift. The separation of resonance frequen-cies for spefrequen-cies with different chemical shifts is the basis of NMR spectroscopy utilized in chemical structure analysis. For NMR imaging, however, the bulk of the signal comes from two biological sources: water and fat. While the chemical shift between the water spectral peak and the fat spectral peak can indeed cause misregistration between water and fat in MRI images, especially in echo-planar imaging, with this exception chemical shift does not generally come into play for imaging purposes.
Hahn's spin echo: If the differences in observed Larmor frequencies are slowly vary-ing in space and are constant, then these differences are a part of the potentially correct-able macroscopic environment, and lead to observed shortening in the transverse relaxation which can be avoided. A method to avoid the effect of these static inhomogene-ities was found by Hahn in 1950, termed the Hahn echo or spin echo [22]. Hahn found that an ensemble of spins with some magnetization visible in the transverse plane (due to pre-vious pulse) could be inverted by application of an energy pulse twice that necessary for
maximum transverse magnetization. This is termed a 180 degree pulse, and can be described in the classical model as inverting the spins. Because of the nature of coherence in the precessions of spins, this causes spins which have a higher than average precession rate, and thus more accumulated spin phase per time, to be placed in an analogous preces-sion lag. By the same token, spins which are slow to precess are placed ahead by reflecting their orientation about the transverse plane.
After the 180 degree pulse, the spin begins to catch up to its neighbors, or fall back to its neighbors, at the same rate which caused it to become incoherent with the ensemble since the excitation period. Thus the Hahn spin echo is produced as spins come back into alignment with one another in the transverse plane, exactly 2 time periods from the begin-ning of the excitation, following an inverting pulse delivered after one time period. Trans-verse magnetization decay is measurable as an exponential fall in signal as the Hahn echo time is increased in separate experiments. This time constant is termed T2.
Sensitivity to heterogeneous magnetic susceptibility: Without application of a spin echo, magnetization from free induction decay falls off with a time constant T2*. In liquid
spectroscopy, T2* is assumed to be shorter than T2 due to spectrometer magnet
inhomoge-neity and other experimental factors, rather than intrinsic properties of the sample. In con-trast, in biological systems, the local variations in magnetic field are more often due to variations in magnetic susceptibility of tissues, and thus T2* becomes an inhomogeneous
material property just as are T1, T2, and the density of spins. Of note, T2* is only a
short-hand term for observed transverse relaxation, which occurs with a dependence on time which may not follow a precise exponential form, and must be addressed specifically for the evolution times (TE) of interest.
Sensitivity to diffusion: When spins diffuse through regions of magnetic inhomoge-neity, the effect on precession is random, and thus not removable by use of the spin echo, because the path through the inhomogeneities is not retraced precisely before and after execution of the inverting pulse. Thus magnetic inhomogeneities on a diffusion scale (less than 20 microns for typical experiment times) contribute to the observed T2 relaxation
rather than only the T2*.
The diffusion-mediated signal change also can be utilized directly to measure diffu-sion, by applying large magnetic field gradients to the spins in the direction for which dif-fusion sensitization is desired. Well-established theory relates field gradients and pulse timing to the observed diffusion coefficient of the tissue [23]. Anisotropy of macromolec-ular barriers to diffusion forms the basis of diffusion tensor brain white matter tract visual-ization [24, 25].
Oxygenation sensitivity: Deoxyhemoglobin in red blood cells, as well as capillaries containing deoxygenated red cells, cause local magnetic field inhomogeneities on the dif-fusion spatial scale; this blood oxygen level dependent (BOLD) contrast mechanism thus has both T2 and T2* effects.
Sensitivity to convective transport: A central feature of biological systems not yet accounted for is perfusion. The spins not only relax according to the above described mechanisms and diffuse around macromolecules, but they also are transported by flow in vascular structures. A major effect is noted due to perfusion after selective excitation using band-limited pulses and gradient magnetic fields. Spins which were not excited at their Larmor frequency, which were outside the targeted volume when the band-limited pulse was applied, do not receive the same excitation energy as those within the volume. As an example, suppose we invert the spins at equilibrium within a volume of interest, and then
after waiting a period -TllogO.5, we excite those spins into the transverse plane. Because
of T, regrowth, the spins which see both the inverting and excitation pulse will have no signal, as their longitudinal magnetization is passing from negative to positive at that time precisely. However, spins which were not inverted, but simply flow into the imaging vol-ume after the first pulse, will tip readily into the transverse plane with the second pulse. This forms the basis for measuring signal which is proportional to perfusion: the subtrac-tion of a nonselective from a selective excitasubtrac-tion pulse.
Time-varying perfusion estimates: We characterize apparent T1 relaxation during transient changes by solving the dynamical NMR signal equations for a time-varying blood flow input function. We write in terms of the magnetization difference m(t) from
equilibrium Mo: m(t) = (Mo - M(t))/Mo, such that m(t) = 0, 1, and 2 at spin equilibrium,
sat-uration, and inversion, respectively.
In the absence of a large tissue-blood T1 difference, the modified Bloch equation with
time-varying spin turnover at rate F(t), for which the incoming spins have a known mag-netization ma(t) and outflowing spins have well-mixed magnetization m(t), is
d m(t) = - (1 + F(t) m(t) +(2.1)F(t)( dt T, 1
where X is the blood to tissue water partition coefficient (k=0.9). For inversion recovery
with a non-slice-selective inversion pulse, inflow of magnetization ma(t) = 2e-t/T'. For the
case in which all RF pulses are slice selective (e.g. spin echo or inversion recovery),
ma(t) = 0 .
The general solution for time varying F can be written as the sum of an initial (zero-input) response and a convolution of time-varying input with the impulse response
func-tion h(t):m(t) = h(t)m(to) + to((h(t)/h(t'))(F(t')/)ma(t'))dt' where the time varying impulse
response h(t) = exp(-t (1/T1+ F(t")/X)dt") is dependent on the integrated history of the
tem parameters. For a slice-selective inversion recovery pulse sequence, it follows that m(t) = 2exp(-t(1/T 1 + (1/t)o(F(t')/1)dt')) and thus
Sapparent F(t' (2.2)
I apparent 1 0
The measured F in a time-varying system using T1-sensitive slice selective excitation is precisely the simple time-averaged F(t) over the interval between initial spin excitation and readout (e.g. the inversion-recovery TI). Variation in flow over the course of a mea-surement does not lead to incorrect results.
Echo planar magnetic resonance imaging: The technology of echo-planar imaging makes use of rapidly varying gradients of magnetic field during the readout period of the NMR spectroscopic experiment. By varying one orientation of gradient magnetic field quickly, and adding phase dispersion in a second direction between rapid gradient sweeps, an entire two dimensional representation of NMR spatial signal distribution is obtained from a single NMR excitation. The major impact on image content in terms of the relax-ation parameters above is that, for the spin echo experiment, the Hahn echo is placed only at the center of spatial-frequency space; in other words, the bulk magnitudes of large struc-tures in the image are weighted by T2 as for a spin echo experiment, whereas smaller structures with more high spatial frequency content (e.g. sharp edges) are imaged with more T2* weighting. This difference has not been problematic in experimental practice when fast oscillating gradients are used (readout window 32 ms), although the selective blurring of objects with short T2* in an EPI experiment must be kept in mind for analysis of echo-planar data, especially for slower acquisitions with longer readout windows.
Summary: Now that the physical basis of NMR signal generation has been described intuitively, let us examine it in mathematical form. For each compartment with its own T1,
T2* and spin density Mo, the NMR signal S following a previous excitation TR time units previously, and measured TE time units after the current excitation, is weighted as such, assuming that all transverse magnetization is discarded or randomized at the end of each pulse sequence, and that transverse relaxation indeed follows the assumed exponential form:
TE TR
,
Yl
S = Moe T21 - e (2.3)
Variation of TE and TR over appropriate scales (TE similar to T2*, TR similar to T1) allows the determination of TI, T2*, and M0. If in addition a Hahn echo inversion pulse is
applied, with expected echo at time TEh, then the equation becomes
TE -TEh TEh)( TR
T T21
S = Moe e J - eJ (2.4)
Perfusion changes effective TR for a portion of the spins. Because of its exponential character and dependence on repetition interval, the perfusion portion of the signal can be viewed as changing the effective TI of tissue: -1 -1 F (see Introduction) where
T effective T 1
lambda is the partition coefficient for water between blood and tissue. This effective TI change can be magnified by use of an inversion recovery pulse sequence. Inversion recov-ery is similar to a spin echo, but instead of starting with fully relaxed longitudinal magne-tization, a preparatory inversion pulse negates the sign of the longitudinal magnetization. As longitudinal magnetization then begins to recover at T1 time constant, the signal passes through zero and becomes positive. The doubling in variation of magnetization, from-Mo to Mo, doubles the sensitivity over the short-TR spin echo sequence described above. Sig-nal measured after an inversion time TI has the following characteristic:
TE - TEh TEh TI
S = Moe T 2e (2.5)
With the exception of quantifying the effect of susceptibility perturbers on MRI signal, we now have a model of MRI signal production based on the phenomena of spin excita-tion and relaxaexcita-tion in a heterogeneous medium. It remains to identify the compartments of interest and to quantify the effects of changing blood oxygenation, blood volume, and per-fusion on the MRI signal.
2.3.2 Blood oxygenation level dependence: signal magnitude estimation
The relationship between tissue deoxyhemoglobin content and signal attenuation has been established as primarily due to the effects of microscopic inhomogeneity of magnetic sus-ceptibility between deoxygenated blood cells and surrounding plasma and tissue, affecting both extravascular and intravascular spins. We model the BOLD effect as due to changes in the magnetic susceptibility difference AX between intravascular and extravascular com-partments. Details are given by Boxerman [26]; briefly, the heterogeneous magnetic sus-ceptibility of tissues is dominated by the paramagnetic effect of deoxyhemoglobin in a mildly diamagnetic milieu occupied mostly by water. Deoxyhemoglobin is compartmen-talized into erythrocytes; this compartmentalization causes large step changes in magnetic susceptibility between intracellular and extracellular spins in blood; the compartmental-ization of blood within vessels also causes step changes in effective magnetic susceptibil-ity between intravascular and extravascular spaces. In the presence of a large base magnetic field of the MRI system (1.5 T for our experiments), the variations in magnetic susceptibility lead to warping of magnetic field lines, and thus local gradients of magnetic field in the region of vessels and in the region of erythrocytes. These magnetic field pertur-bations extend for several vessel diameters into the surrounding tissues, and thus effect a much larger proportion of spins than simply the intravascular space alone.
![Figure 2.2: Signal attenuation functions determined by Monte Carlo modeling for BOLD contrast [26] with TE 50 ms, and capillary and venous volume fractions and hematocrits from Table 2.3](https://thumb-eu.123doks.com/thumbv2/123doknet/14218781.483279/46.918.266.694.125.459/attenuation-functions-determined-modeling-contrast-capillary-fractions-hematocrits.webp)