HAL Id: hal-00816940
https://hal.inria.fr/hal-00816940
Submitted on 23 Apr 2013
HAL is a multi-disciplinary open access
archive for the deposit and dissemination of
sci-entific research documents, whether they are
pub-lished or not. The documents may come from
teaching and research institutions in France or
abroad, or from public or private research centers.
L’archive ouverte pluridisciplinaire HAL, est
destinée au dépôt et à la diffusion de documents
scientifiques de niveau recherche, publiés ou non,
émanant des établissements d’enseignement et de
recherche français ou étrangers, des laboratoires
publics ou privés.
A Causal Model to predict the Effect of Business
Process Evolution on Quality of Service
Alexandre Feugas, Sébastien Mosser, Laurence Duchien
To cite this version:
Alexandre Feugas, Sébastien Mosser, Laurence Duchien. A Causal Model to predict the Effect of
Business Process Evolution on Quality of Service. Conference on the Quality of Software Architectures
(QoSA), Jun 2013, Vancouver, Canada. pp.143–152, �10.1145/2465478.2465486�. �hal-00816940�
A Causal Model to predict the Effect of
Business Process Evolution on Quality of Service
Alexandre Feugas
INRIA Lille - Nord EuropeLIFL - UMR CNRS 8022 Univ. Lille 1, France
alexandre.feugas@inria.fr
Sébastien Mosser
I3S - UMR CNRS 7271 Univ. Nice Sophia-AntipolisNice, France
mosser@i3s.unice.fr
Laurence Duchien
INRIA Lille - Nord EuropeLIFL - UMR CNRS 8022 Univ. Lille 1, France
laurence.duchien@inria.fr
ABSTRACT
Managing Quality of Service (QoS) of Service-based systems is a key challenge to produce systems that fulfill their require-ments. Verifying the respect of a QoS contract in a system becomes more and more difficult as systems are more and more complex. Moreover, systems have to evolve in order to fulfil constantly changing requirements. As QoS properties are influenced by hidden factors such as connection rate or the system execution itself, determining the cause of a per-formance degradation is not mainstream. We propose in this paper to identify the causal relations to make explicit the hidden factors of influence. We more specifically focus on the consequences of system evolution with respect to QoS properties: using causal relations, we aim at predicting the possible overhead caused by an evolution. This paper shows through an example of Business Process how our evolution analysis helps to understand the effect of evolution on QoS property such as the Response Time. We show its efficiency by comparing the prediction with measured values.
Categories and Subject Descriptors
D.2.5 [Software Engineering]: Testing and Debugging— Monitors; D.2.9 [Software Engineering]: Management— Life cycle; D.2.4 [Software Engineering]: Software/Pro-gram Verification
Keywords
Business Process; Evolution; Quality of Service; Causal Model;
1.
INTRODUCTION
Quality of Service (QoS) is one of the main concerns in building and processing software. We consider in this paper QoS as “the measurable, quantifiable properties of a software product” [7]. An example of such property is the Response Time (RT), defined as “the time spent between the reception of a request and the sending of the reply”. A QoS property characterises the system, or a part of the system. It is possible
Permission to make digital or hard copies of all or part of this work for personal or classroom use is granted without fee provided that copies are not made or distributed for profit or commercial advantage and that copies bear this notice and the full citation on the first page. To copy otherwise, to republish, to post on servers or to redistribute to lists, requires prior specific permission and/or a fee.
QoSA’13,June 17–21, 2013, Vancouver, BC, Canada. Copyright 2013 ACM 978-1-4503-2126-6/13/06 ...$15.00.
to determine the QoS of software by static analysis at design time, or by monitoring the system at runtime [2]. This analyt-ical process produces a measure, called Property Value (PV). However, even if the QoS property value is known, under-standing the meaning of a PV is complex due to the presence of hidden factors of influence. In the case of Response Time, the QoS property value of a given activity fluctuates consid-erably depending on system elements (e.g., input of a service, coding style) or on external factors such as the number of simultaneous connections, the congestion of the network or the number of exchanged messages [14]. The causal relations among elements of the system, or with external factors are not explicit, leading to a misunderstanding of the system behaviour.
Service Oriented Architectures (SOA) define maintainable systems around the concept of service. Services can be com-posed in a Business Process (BP), an ordered set of activities, to implement larger services [6]. We consider evolution of a SOA system as the process of changing the state of a system to fulfil new user requirements. Evolutions can be local (e.g., by only changing a parameter of a service call). However, independently of how small the modification is, an evolution has consequences on the QoS of the entire system. Moreover, it is difficult for the BP architect to predict the QoS of a Business Process composed by hundreds of activities.
The contribution of this paper is to explicit the hidden causal relations between BP elements w.r.t QoS properties. We define causal relations [21], helping the BP architect to control the effect of an evolution on the QoS of a Business Process. Causal relations are part of our tool named SMILE (Service Modeling for Impact of evoLution framEwork ), that analyses QoS properties at design and runtime.
The remainder of the paper is as follows: Section 2 mo-tivates our proposal with the presentation of our running example and the resulting challenges. Section 3 introduces causal modeling. In Section 4, we present a first causal model based on the execution of the system, and show its usage to perform an evolution analysis. Section 5 details a QoS-enrichment of the causal model to improve the evolution analysis. We validate the approach in Section 6 and compare it with related work on Section 7, before concluding with a summary and future work.
2.
MOTIVATION AND CHALLENGES
2.1
Running Example
PicWebis a Business Process that follows SOA
!"#$%&'()*&"+",-"./ 0,+123*()* 0,+414(5"60,+1.!"#$%&'/ &"78#.0,+1923/ !"#$%&'()*&"+",-"./ 0,+10,+41423*()* 0,+414(5"60,+1.!"#$%&'/ 0,+198,+:&23*()* 98,+:&(5"60,+1.!"#$%&'/ 0,+123*()*;"87"&(<%,=.0,+10,+41423>*0,+198,+:& 23/ ?+6,-,6# @0*?+6,-,6# ?+6,-,6# ?+6,-,6#*4''"'* 'A&,=5*6B"*"-%8A6,%= !"#"$%( 0,+19*)*C%&D46.0,+123/ &"78#.0,+1923/ 0,+19*)*C%&D46.0,+123/ !"#$%&'()*$+,
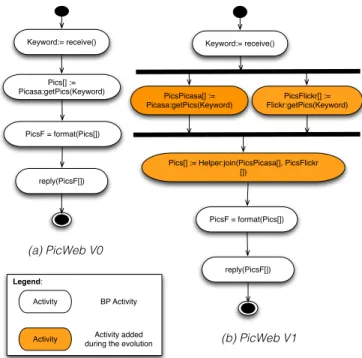
!*#$%&'()*$+-Figure 1: Evolution of PicWeb
for experimental purposes. This BP is a sub-part of a larger legacy system that is deployed and daily used in three in-stitutions (70kLoC). Its implementation relies on partners such as Flickr (Yahoo!) or Picasa (Google) to store and retrieve pictures. It allows one to retrieve a set of pictures with a given keyword from existing partner services.
Fig.1.(a) depicts the initial version of PicWeb using an
UMLactivity diagram. At the beginning, the BP fetches
pictures matching a given keyword. The BP receives the keyword, invokes the Picasa service to retrieve matches, format them to have pictures with an appropriate dimension to fit the display screen, and returns them as result. During its life-cycle which started eight years ago, PicWeb evolved several times to respond to changes in users requirements.
In the scope of this paper, we focus on the following evo-lution, depicted in Fig. 1. PicWeb evolved to support an alternative picture provider (the first one was Picasa), as shown in Fig. 1(b). Such provider is called in parallel of the Picasa one. Their results are concatenated in the reply. After making the evolution, not only PicWeb but the en-tire system slowed down, forcing to stop and re-deploy an older version of the system. If the reason of the performance degradation was obviously the evolution, it took time for the BP architect to understand why and how the modification affected the entire system.
2.2
Challenges
The goal of this paper is to present an approach insuring a QoS-safe evolution of Business Processes. In other words, the BP architect must control that an evolution will not have unplanned effects on the overall system performance. To properly maintain QoS during the evolution process and to avoid QoS degradation, the BP architect needs to be supported. This consists into the following challenges:
1. How to ensure the preservation of a given QoS property while making a BP evolve? (See Section 3)
2. How to identify the system elements that have been affected by an evolution? (See Section 4)
3. How to model a QoS property in order to identify relevant hidden causal relations? (See Section 5) To reach this goal, we propose an analysis that makes explicit the hidden causal relations inside a Business Process. The analysis helps to predict the chain reaction of an evolution on the QoS property values.
2.3
Assumptions
We assume in this paper that a QoS expert (in charge of the study of QoS properties) cooperates with a BP archi-tect (responsible of the design of the BPs). We focus here on QoS properties that are composable, quantifiable, and defined on a single dimension. Where models like Palladio [3] focus on performance analysis, we assume here that the BP architect studies the QoS of the system without assessing any performance model.
3.
A CAUSAL MODEL TO ANALYSE THE
EFFECT OF AN EVOLUTION
In this section, we motivate the need of a causal model. We first introduce the concept of evolution and explain why a causal analysis is needed. Then, we present the model of our system that is finally analysed to build the causal model.
3.1
Definition of an Evolution
Several definitions in the literature introduce the term of evolution. The first to introduce it was Lehman [13]. Calinescu et al. consider evolution as “changes in the environment or the specification causing changes in the implementation” [5]. In the context of this paper, we call BP evolution an ordered set of changes made on the BP such as the add, deletion or update of activities (and/or their inner elements). But analysing the consequences of an evolution is not as mainstream as expected. In fact, checking the QoS of activities manipulated during the evolution is not sufficient. The common way to deal with the evolution is to re-check the entire system for each QoS property. With BPs made of hundreds of activities, it takes a considerable time to do such a re-check.
We propose an alternative method to determine the effect of an evolution on QoS . This method relies on the com-putation of a Causal Model representing the causal effects of a change in a system state. The evolution analysis uses the causal model to determine which elements of the system have been affected by the evolution. With this approach, we reduce the number of re-checks to perform on the system by considering only causally related elements. A full re-check of the system is no longer necessary. We will see in the following what a causal model is and how to define it.
3.2
Definition of the Universe
Performing an evolution consists in the modification of elements of the Universe. We consider here that a Universe represents the entire ecosystem of the SOA application. It is composed of three kinds of element:
• System Elements - It includes every element composing the system, e.g., BPs, activities, variables. Activities represents the reception of a message, the invocation of a service, or any task involved in the definition of a
!"#$%&'% !"#$%&'(%&%)$ !"#$%&'()*+,-*+,-%+$"./(0% 10#2)%## *+,3%## 4%(/$2,) .//0 *%#1 2//0 "3)1 53$262$" )45%&'()*+,-./+2/7(% ,"6%&'()*+,-8)26%+#%'(%&%)$ *+,-%+$"'(%&%)$ #%7) *+-8) .//0 .//0 +,1 9$)1 .//0 !"*1 ,"6%&'()*+,-*+,-%+$" .//0 !"#$%1 2 9:,%* !%90%)3% :(,; <,,-4%3%26% =)6,>% 4%-(" 4%#,0+3%'(%&%)$
Figure 2: Extract of the Universe Meta-Model
BP. Variables are data defined locally in the BP that are used as input/output parameters in the invocation of a service.
• Property Elements - Every Property Value computed using the QoS property definition. A property value could be the measure or the application of a formula on a specific System Element (see Section 5.1). • Resource Elements - The system uses resources (e.g.,
memory, network). In this category, we represent every factor related to the system, such as the workload or the users.
Fig.2 is an excerpt of our Universe meta-model. The System
Elements are established by importing BPs into our tool. Property Elements store the value of a System Element for a given QoS property. They are positioned automatically by SMILE.
Each element of the Universe can act on other elements, causing a change in their states. It is necessary to model explicitly the actions of Universe elements on others in order to capture the entire effect of an evolution. Our evolution analysis relies on the Universe. By establishing the Universe elements directly involved in the evolution, and by following the causal relations starting from them, we isolate the Uni-verse elements that have been impacted. Thus re-checking only the QoS of these elements is sufficient to determine the effect of an evolution, without re-checking the entire system.
3.3
Causal Model
To control the effect of an evolution on the system, it is nec-essary to make explicit the influence a Universe element can have on other elements of the Universe. For example, chang-ing the content of the input message of a service influences its execution. We call such relation between elements Causal Relations. Let (a, b) ∈ Universe Element. We define a causal
relation a r
−→ b, the fact that if the state of a changes, then the state of b changes as well. Based on causal relations, we build a causal model that makes explicit causal relations of interest between elements of the Universe. A Causal Model is a digraph V(E,R) where E is the set of the Universe elements and R represents the set of causal relations applied to the BP. The evolution analysis uses the causal model to determine
!"#$#%&'()*+',# -..(+/0*+', !#$#120,34#'5# 6748 94:)+84;4,*7 !!!#$#%&'()*+',# -,0(<7+7 !!#$#%&'()*+',# =4>,+*+', !" #$%&'()%( *+)$ ,-./0('.1 #$%&'()%( &0(+? @#&0(+?
Figure 3: Overall Process to Evolve a System
the elements directly affected by a given evolution. Then, by following every causal relation starting from them (i.e., by processing their transitive closure), the evolution analysis determines which elements have been indirectly affected.
Using this method, the Evolution architect can determine the set of affected elements, in order to re-check only their QoS property value. Our method restricts the number of elements to re-check and gives insights about the reasons of a possible performance degradation thanks to the chain of consequences represented by causal relations.
The following focuses on the causal model reasoning part of the evolution analysis (depicted in Fig. 6) to determine the set of BP elements whom had their QoS property values affected by an evolution. We detail the different steps of the method and illustrate them with the evolution of PicWeb.
4.
A PROCESS TO ANALYSE THE EFFECT
OF AN EVOLUTION
In this section, we present our evolution analysis that predicts the effect of an evolution on the QoS of a Business Process. The evolution analysis is an automated process that relies on a Causal Model. We introduce the overall approach of the evolution analysis, before introducing the causal relations extractable from the system execution, and applying the evolution analysis on PicWeb.
4.1
Overall Approach of Evolution Analysis
Fig.3 depicts the overall process used to perform an
evo-lution. The process is initiated by the User, who changes the requirements of the system. The BP architect defines a modi-fication to make the system evolve. The proposed evolution is analysed: using the causal model, evolution analysis collects affected system elements and performs a QoS recheck of these elements to get the property value of the evolved Business Process. If the Evolution architect is satisfied, the evolution is accepted and the new version is deployed. Otherwise, the evolution is discarded and results of the analysis are used to design a better evolution.
4.1.1
Evolution Definition
The SMILE Evolution Engine provides a set of actions to express BP evolution. This set of actions (which has been established empirically) is extensible, making possible to con-nect any evolution engine (such as Adore [17] or Praxis [4]) with SMILE, as long as this evolution engine translates its behaviour into SMILE evolution actions. With our engine, it is possible to add or remove activity, variable, invocation pa-rameters, or partial order. The following describes the effect of each evolution operation:
• addActivity(act)/delActivity(act): this action adds/-deletes the activity act to the process.
1 addVariable ( P i c s P i c a s a ) 2 delOutParameter ( P i c a s a , P i c s , 0 ) 3 addOutParameter ( P i c a s a , P i c s P i c a s a , 0 ) 4 5 addVariable ( P i c s F l i c k r ) 6 addActivity ( F l i c k r ) 7 addInParameter ( F l i c k r , Keyword , 0 ) 8 addOutParameter ( F l i c k r , P i c s F l i c k r , 0 ) 9 10 addActivity ( H e l p e r ) 11 addInParameter ( Helper , P i c s P i c a s a , 0 ) 12 addInParameter ( Helper , P i c s F l i c k r , 1 ) 13 addOutParameter ( Helper , P i c s , 0 ) 14 15 addRelation ( r e c e i v e , F l i c k r ) 16 addRelation ( F l i c k r , H e l p e r )
17 addRelation ( Helper , Format )
18 addRelation ( P i c a s a , H e l p e r )
19 delRelation ( P i c a s a , f or m at )
Figure 4: Script of the PicWeb evolution
• addVar(var) / delVar(var): this action adds/deletes the variable var to the process.
• addInPar(var,act,pos) / delInPar(var,act,pos): this ac-tion adds/deletes the variable var as an input parameter of the activity act at position pos.
• addOutPar(var,act,pos) / delOutPar(var,act,pos): this action adds/deletes the variable var as an output pa-rameter of the activity act at position pos.
• addRelation(act1,act2) / delRelation(act1,act2): this action adds/deletes a partial order between activities act1 and act2.
Fig.4 is the script describing the evolution performed in
Fig.1. It is composed of four parts: lines 1-3 update the
Picasaactivity by changing its output by a new variable,
PicsPicasa. Lines 5-8 add the Flickr activity. Lines 10-13 are responsible of the call of the Helper activity, which concatenate PicsPicasa and PicsFlickr into Pics. Finally, lines 15-19 set up a new partial order, as depicted in Fig. 1.
4.1.2
Evolution Analysis
The evolution analysis takes as input an evolution, and uses the causal model to compute the set of affected system elements. The causal model is the key of the analysis: it is initially defined by the application of the causal rules on the initial system, and enriched for each evolution. For each operation of the evolution, the analyser determines the system elements that are directly manipulated, i.e., whose state is changed. Then, system elements that are affected by this change are collected by following causal relations present in the causal model. Performing the analysis of an evolution is an automated process composed of several tasks (described in Sect. 4.3):
1. Modification of the System: The evolution is ap-plied on the system to modify its structure. For each sys-tem element, SMILE insures the Universe consistency by creating every missing model element, like property
values. For example, adding the Flickr invocation im-plies for SMILE to create a Response Time property value for the invoke activity. Moreover, because the determination of affected elements is a computation made on the causal model, SMILE has to update it. 2. Directly Affected Elements Collection: The
evolution analysis takes as input the elements that are directly manipulated during the evolution. This step analyses the evolution operations to extract every system element manipulated by the evolution. 3. Evolution Causal Analysis: Starting from the
previ-ously collected elements, the analysis browses the causal model to collect every Indirectly Affected Element. The analyser computes the transitive closure of causal rela-tions starting from the Directly Affected Elements and collects every system element of the closure.
4. QoS Re-check of Affected Elements: The causal analysis points out the affected elements. It is necessary to re-measure or to re-check them in order to get their new property values and to quantify the effect of the evolution. SMILE uses analysers described in the QoS Property Definition (see Sect. 5) and deploys a new version of the system to monitor the new property values.
5. Evolution Architect Decision: Based on the anal-ysis results, the Evolution architect decides if the evo-lution has the desired effect and if he/she wants to effectively apply the evolution: (a) If the evolution does not produce a performance degradation, the system is deployed and can be used. (b) In case of performance degradation, the Evolution architect can choose to dis-card the evolution. The Business Process is restored to its state before the evolution, as well as the causal model. This is the only step of the process that requires the intervention of the Evolution architect.
4.2
Building the Causal Model of a System
We present in this part how the causal relations are deter-mined for a given system. One way to define causal relations is to study the system, and to manually establish each causal relation that exists in the system. This method is time-consuming and error-prone. Instead, we introduce the notion of Causal Rule. A Causal Rule describes how to select under a specific condition the couples (a, b) ∈ U niverseElement that are causally related. For example, one kind of causal relation is the influence of an input on the processing of a service. The following rule describes how to build every relations of this kind for a given system:
(Var,Act) ∈ (Variable×Activity): Var ∈ input(Act)
implies Var r
−→ Act.
Using this rule, SMILE analyses the Business Process to collect and build the different causal relations. We call these relations Execution Engine Causal Relations. This kind of rules is specific to the execution engine. We assume that they are provided with its specification, or written by an expert of the execution engine. In the same way, another rule collects variables and activities to represent the fact that an output is influenced by the execution of its activity. By applying these rules on PicWeb, SMILE generates the causal model.
Fig.5 depicts the causal model of PicWeb after evolution,
!"#$"%&'( )'*+,#-!"#$"%&'( .$/0.$/"0" !"#$"%&'( .$/01&$/2# !"#$"%&'( .$/0 !"#$"%&'( .$/01 3'/'$4' 564,2'.$/"0" 564,2'1&$/2# 564,2'7'&8'# 1,#9":564,2' 3'8&*
!"#$%&'()*+"*,(*$!(;"<0"&(3'&":$,6
Figure 5: Causal Model of PicWeb after Evolution
!"#$%&'% ()*)+#&%,-./)011%,-%2) 3.%4%"-')56..%,-#6" 72287O.%:;#,'<#,7'7= 2%.>?-<7&74%-%&:<#,7'7@;#,'@A= 722>?-<7&74%-%&:<#,7'7@;#,'<#,7'7@A= BBB 462#C%' 57?'7.) D62%. 462#C%' E)*)3$6.?-#6" 57?'7.)0"7./'#' F)*)D62#C,7-#6")61 -G%)!"#$%&'% FH)*)57?'7.)D62%. !;27-% I)*)3$6.?-#6") 0&,G#-%,-)+%,#'#6" J%-KJ/'-%43.%4%"-L ,6..%,-' !"#$%&'#( )*+,'&-+& >M I7)*)+%;.6/)"%N) 8%&'#6" "6-)>M O)*)P6J)&%*,G%,Q 61)011%,-%2)3.%4%"-' I9)*)+#',7&2) 3$6.?-#6" &%$%&-' &%$%&-' J%-K!"#$%&'% 3.%4%"-L !"#$%&'#( 3$6.?-#6") R7'Q D7"#;?.7-%2) !"#$%&'%)0&-#17,-D7"#;?.7-%2) !"#$%&'%)0&-#17,-R7'Q S";?-R7'Q >?-;?-.-/-(01 J%-K<8'L 22343!"#$%&'#(35-6('&'#( 222343!"#$%&'#(3)(7$89'9 2:343!"#$%&'#(3);;$'+7&'#( <=2.! !"#$%&'#( )*+,'&-+&
Figure 6: Overall Approach to Analyse an Evolution
The causal model defines the causal chains of the system. It is now possible, from one element, to obtain the causal chain of the changing of its state, and to collect which elements are indirectly affected by the change of state.
4.3
Application of the Evolution Analysis
We focus in this part on the evolution analysis, noted as step III in Fig. 3. The analysis reads the evolution script to collect system elements that are directly manipulated. From these elements, the evolution analysis uses the causal model to collect everything that is causally related and needs to be re-checked. It can be other system elements, but also property values or resources. Fig. 6 gives a closer look of steps II-IV of the evolution process. We explain in the following the different steps of the analysis, and apply it on PicWeb:
Collection of Directly Affected Elements: Evolution −→ Set<SystemElement>
-SMILEanalyses the evolution in order to collect the
Di-rectly Affected Elements. These elements are the starting points of the causal analysis, as these entities are the ones that have their state explicitly changed. Evolution operations can be classified into adding/removing operations. In the case of an add, a new system element is inserted, potentially having a causal effect on the system. The causal model must be checked from this system element. In the case of a deletion, a system element is removed. The effect this element had on the system is no longer established: as a consequence, if the element was in part responsible of other elements states,
Operation Description Collected Element addActivity(act) act is added to the
Uni-verse
act delActivity(act) act is removed from the
Universe
act addVar(var) var is added to the
Uni-verse
var delVar(var) var is removed from the
Universe
var addInPar(act,var,pos) var is added as a
param-eter of act
var delInPar(act,var) var is removed from act
parameters
act addOutPar(act,var,pos) var is added in the
re-turn value of act
var delOutPar(act,var) var is removed from the
return value of act
elements related to var
Table 1: Matching Between Universe and Causal Model Evo-lution Operations
removing the element cancels the action it had, thus causing a change in the state of previously affected elements. As a result, every previously causally related element must be re-checked as well. Tab. 1 regroups the rules used to collect DAEs. These rules have to be provided once by the Evolution architect if the Evolution Engine is extended.
In our example (Fig. 4), the evolution is composed of ten adding operations (lines 1, 3-13) and one deletion operation (line 2). Operations related to the order (lines 15-19) are not considered as we are not focused on the order of the execution. Considering the rules in Tab. 1, adding operations are analysed to collect PicsPicasa, PicsFlickr, Flickr, Helper, Keyword. In the case of the delOutParameter operation (line 2), analysis leads to the adding of every activity using variable Pics.
The unification of the analysis of the evolution operations produces the set <PicsPicasa,PicsFlickr, Keyword, Flickr, Helper>. The analyser can determine from them which ele-ments are potentially affected.
Evolution Causal Analysis
Set<SystemElement> −→ Set<UniverseElement> -This step collects elements indirectly affected by the evolution. This task is done by following causal relations in the causal model, starting from each element of the Directly Affected Elements set. An example of causal relation modelled in the causal model is the influence of an input on the execution of a service (called serviceCall relations). The goal of this step is to use causal relations to identify system elements that are not manipulated by the evolution itself, but are affected due to a causal effect. By performing a transitive closure of the causal relations starting from directly affected elements, the analysis collects directly related elements, but also indirectly related elements.
From the variables of the DAE set, following causal rela-tions allows the analyser to collect every activity for which a change in the input impacts the Response Time. As a result, the analysis collects several activities that are already in the DAE set (Flickr, Picasa, Helper), but also the Format activity: indeed, the Helper activity processes now a bigger number of pictures, which implies the Response Time of the Format activity to be different. Moreover, as Response Time of basic activities has changed, their aggregation is also affected. By following aggregation relations, the indirectly affected aggregation property values are Flow, Sequence and PicWeb.
QoS PV re-check of Affected Elements
Set<UniverseElement> −→ Set<Property Value> -This step determines the new QoS property values of affected elements. SMILE equips the Business Process with targeted monitoring facilities and deploys it to capture the information. In the example, SMILE needs to monitor the Response Time of activities of the Indirectly Affected Element set. The monitored values show that globally, activities directly affected by the evolution does not take more time. However, the Format activity, which was not in the set of Directly Affected Elements, had a serious increase in its Response Time. We will see in the next section that this is due to the time-consuming Computation Time necessary to process each picture. The increase of the Computation Time caused the slowing down of the entire Business Process.
In this section, we have detailed how the causal model can be used by SMILE to predict the effect of an evolution on a given property value. By computing the transitive closure of the system elements directly related to the evolution, the evolution analysis identifies a subset of the system that is affected and that need to be re-checked. This identification brings a solution to challenge 2: the BP architect knows from the analysis what is the effect of the evolution on the overall QoS of the system. Our solution is fully automated to get from an evolution and the causal model of the BP if the system’s performances have been degraded or not.
5.
QOS ENRICHMENT OF THE CAUSAL
MODEL
We presented in the previous section a causal model built upon the causal effect of the execution engine due to the assumption that executing a BP modifies the state of system elements. This approach is efficient to capture the minimal effect of the execution. However, the level of details is not enough to understand the causal effects at the level of a QoS property. We need also to represent the causal relations relating directly property values, in order to express effect of a property value. The execution engine itself represents the main causal effect, but external factors such as network, users, etc., need to be considered as well to capture effects such as workload. In this section, we improve the causal model with QoS-specific relations. The goal of this enhancement is to capture a more precise set of elements affected by introducing QoS causal relations that show the effect of property values on other elements. This reduces the number of re-check and enables a better understanding of the effect of an evolution. First, we present how a QoS expert defines a QoS property. Then, we explain how QoS-specific causal relations can be deduced from the QoS Description. Finally, we show how the enhancement is applied on PicWeb, and its benefits.
5.1
Definition of a QoS Property
We consider in this paper QoS as a quantifiable metric that can be measured, determined by analysis, or computed through a mathematical formula, based on other property values [1, 7]. The mathematical formula is applied on a system element, to compute a Property Value. In SOA, a common way to determine the QoS property value of a Business Process is to compute the property values of its basic elements (such as invoke activities), and to compose them using an aggregation formula [18]. Thus the QoS expert needs to define a way to compute basic elements property value, and a formula
1 Property RT{ 2 Unit : ms ; 3 Range : p o s i t i v e ; 4 BasicComputation : CT + TT; 5 ApplicationPoint : 6 Sequence i s Sum( c h i l d r e n ) ; 7 Flow i s Max( c h i l d r e n ) ; 8 Loop i s k × c h i l d r e n ; 9 } 10 11 Property CT{ 12 Unit : ms ; 13 Range : p o s i t i v e ; 14 BasicComputation : monitor ; 15 IsInfluencedBy : Inp ut ( a ) ; 16 } 17 18 Property TT{ 19 Unit : ms ; 20 Range : p o s i t i v e ; 21 BasicComputation : monitor ; 22 IsInfluencedBy : Network ; 23 }
Figure 7: Expression of Response Time
to aggregate them. To express a QoS property, we define a Domain Specific Language (DSL). In the following, we detail each element of the description on an example, namely the Response Time. This property is a derived property, defined as the sum of the time to transmit messages (Transmission Time) and the time to execute the service itself (Computation Time). Fig. 7 is the description of Response Time provided by the QoS expert, written using our DSL. All the information must be declared once, and are then automatically applied by
SMILEon any system to compute property values. They are
usual information to manage the QoS property of a system. A QoS property is defined as:
Declaration of the Property Unit and Range Since QoS property values are numeric values, they must be characterised by a unit and a range. Unit of Response Time is defined as an amount of milliseconds which is always positive.
Determination ofQoS Property Values for Basic
Elements
The QoS processing technique is composition-based, that is to say that property values are computed at the lowest level, and then composed for higher level Universe elements. For example, the size of a message is computed by composition of the size of its inner variables. In this case, variables are Basic Elements. There are three ways to compute a PV for Basic Elements: i) static analysis at design time. Static analysis analyses the BP at design time to compute PVs. This kind of technique is well-suited for properties like reachability or liveness [9]. ii) monitoring at runtime. In the case where information needed to compute PVs are not available at design time (e.g., the number of elements of an array), monitors are positioned to observe the values at runtime. This kind of technique is well-suited for properties like Message Size or Availability, which need information only observable at runtime [23]. iii) computation based on other property values. Some QoS properties are called Derived Properties [7]. These properties are defined as a
Response Time Sequence PRT(Sequence.children)
Flow max(RT (F low.children)) Loop k × RT(Loop.activity)
Table 2: Response Time Aggregation Formulæ
mathematical function of other sub-properties. The property values are computed based on a composition formula. For example, the Response Time of an activity A can be defined as RT (A) = T T (A) + CT (A). TT stands for Transmission Time, the time spent to send the request and to receive the reply. CT is the Computation Time of the service called.
The declaration of static analysers or monitors enables
SMILEto automatically perform the analysis, or to position
monitors in the system. In our case, RT is defined as a de-rived property, and CT and TT are measured using provided monitors.
Determination of QoS Property Values for com-posite elements
To compute a QoS PV of a composite activity, the QoS ex-pert describes an aggregation formula, that can be found in litterature [18] (reminded in Tab. 2). Such formula computes a PV for a composite activity, based on the PVs of its inner elements. For example, the QoS expert defines in Applica-tionPoint the aggregation formulae for Sequence, Flow and Loop composite activities. It is important to notice that not every QoS property fits the aggregation principle, as stated in [7].
Influence of other factors
The previously defined formula gives a way of computing a Property Value (PV ) for each element of the system. How-ever, this formula does not make explicit that a PV can be influenced by external factors. Modelling that a specific resource influences a PV enables to include this in our evo-lution analysis. Here, the QoS expert writes other factors dependencies of the PV . For example, the QoS expert defines that Transmission Time of an activity is influenced by the delay of the network.
5.2
Extraction of QoS-Specific Causal
Rela-tions
A QoS property can be computed based on the property value of the inner elements, the architecture of the software, sub-properties, the usage profile and the system environ-ment [7]. These eleenviron-ments influence the QoS PV and should be represented in the causal model. In fact, such causal re-lation is implicit in the causal model presented in section 4: collecting system elements and re-checking them means to re-compute all their PVs. In this part, we propose a finer-grained modelling approach to represent QoS-specific causal relations, in order to avoid a complete re-check of a system element’s PVs. We present this improvement in two steps: first, we present the existing causal relations among prop-erty values. Then, we explain the relations there is between system elements and property values. Finally, we apply the presented causal relations on PicWeb.
Tab.3 depicts the mapping between Property Kind [7] and
our QoS Property Description, and illustrates it. For example, a Derived Property like Response Time depends on other properties (CT and TT). This information is provided in the QoS Property Description, in the BasicComputation section.
SMILEuses it to generate causal relations such as TT(Act)
Property Kind QoS Property Description
Causal Relation Directly Composable ApplicationPoint RT(Invoke)→ RT(Sequence) Architecture-Related Execution Engine Relations Derived BasicComputation T T(Act) → RT (Act) Usage-Dependent Not supported
System Environment InfluencedBy input(Act) → CT (Act)
Table 3: Collection of Factors of Influence deduced from the QoS Property Description
!" $" #" % &' (' '' !" $" #" % &' (' '' !"#$%&'#$()*$)(% !"#$%&'+,-)%,*%'.%/0$12, 3%(14%5'6(27%($"'.%/0$12, 89%*)$12,'8,:1,%'.%/0$12, ;0)#0/'.%/0$12,' <55%5'0=$%('842/)$12, 6>#'$2'(%?*@%*A !"# !$#
Figure 8: (a) Original Causal Model - (b) QoS-Enriched Causal Model
→ RT(Act), meaning that the RT of Act is influenced by its TT. SMILE supports four cases. We do not support Usage-Dependent Properties, because the Usage Profile has to be provided manually for each activity. With our approach, we wanted a QoS Description to be as independent of the system as possible. A Usage-Dependent Property would require a consequent additional modelling effort from the BP architect. The mapping between QoS description and causal relations is done automatically by SMILE: the QoS expert describes the property, and SMILE uses it to generate the PVs and to get the QoS-specific causal relations of the system. The causal model is enriched with QoS-specific causal relations, that can be used to tune the evolution analysis and produced a more precise set of affected elements.
5.3
Enhanced Evolution Analysis
Using the previous causal relations, SMILE can build a new causal model that considers relations to PVs. With this enhanced model, we reduce the number of re-checks and improve the preciseness of the causal model. The causal model is now composed of relations between elements of the entire Universe. To illustrate the enhancement, we consider the defined RT on a simple call to a service S, taking a variable a as input, and producing a result stored in variable c. The Evolution architect decided to evolve this service call by adding another parameter as input, b. Fig. 8(a) is the causal model version 1, Fig. 8(b) is the QoS-enriched causal model. While evolution analysis of version 1 collects S and c, causing to re-check every QoS property value of S, the enhanced evolution analysis collects directly the CT and RT property values, avoiding to re-check the TT of S. This avoids to re-check unnecessary property values, and enables via the chain reaction to understand that the cause of a possible RT degradation would be the CT, and not the TT.
As a result, instead of re-checking every PV of an affected system element, the enhancement proposes to analyse only the PVs affected. In this way, the number of elements to re-check is reduced. Moreover, it enables a better understanding of the effect of an evolution, by pointing out directly which QoS property is affected. As an illustration, Fig. 9 depicts
!"#$%&' ()*+%,' ()$-'.$-/0'1,$2' 34)5& 00'1,$2'34)5& 60'1,$2' 34)5& 60'1,$2' 34)5& !"#$%&' 1*+474' /0' 1,$2'34)5& 00'1,$2' 34)5& 60'1,$2' 34)5& !"#$%&'#$()*$)(% 34,*48)& 9&:-$,; +,,(%,-$./0'1%2-$./0 3%(.4%5'6(/7%($"'1%2-$./0 34,*48)&' 1*+71*+474 89%*)$./0'80,.0%'1%2-$./0 1,$+&77' 1*+<&8 =&>5&"+&' ?4*"=&>5&"+& 6&+&*#&' !"#$%&
@&)2&,' !"#$%&($,A4B' 6&2):
/0'1,$2' 34)5& 00'1,$2'34)5& 60'1,$2' 34)5& /0'1,$2' 34)5& 00'1,$2'34)5& 60'1,$2' 34)5& 60'1,$2' 34)5& 34,*48)&' 1*+7()*+%, 34,*48)&' 1*+7 34,*48)&'1*+7( !"#$%&':0;)%0*%'1%2-$./0 Figure 9: QoS-Enhanced Causal Model of PicWeb
the application of the causal rules extracted from the QoS Property Description to PicWeb.
In this section, we presented an improvement of the previ-ous causal model to give more information about the causal relations among QoS property values and to reduce the num-ber of re-checks. However, if this method gives more details about causality in a system, it also increases the size of the model and the execution time of the evolution analysis.
6.
VALIDATION
In this section, we evaluate our approach empirically on a Crisis Management System (CMS) [11]. The goal of the experiment is to compare the different kinds of evolution analysis on a more consequent system.
6.1
Experiment
The Crisis Management System has been designed to help rescuers in the task of handling a crisis. The system is imple-mented by a set of four Business Processes and thirty-three services, positioning it as a representative example of a real-life system. Ten evolutions have been applied on the system to handle different extensions of the use cases. We took these evolutions as input of our evolution analysis. The goal of the experiment is to show the efficiency of our evolution analy-sis compared to traditional methods, based on a real case study. We performed the evolutions of the different Business Processes and analyse them.
The CMS is implemented in BPEL and executed on a
SCA platform, namely FraSCAti1 [22], using the Intent
mechanisms to dynamically monitor its activities. Intents are codes that are weaved on a service call to be executed before, in parallel or after the service call. We developed a Response Time Intent that takes the current time when a request is received (t1), and after the reply is sent (t2). The intent deduces the Response Time of the invocation by subtracting t1 to t2. Our experiment consists into the simultaneous handling of a set of three crisis, triggered by a call from three witnesses. The different version of the system are monitored to capture the response time of the activities.
1http://frascati.ow2.org
6.2
Interpretation of the Results
We compared four methods: - the re-checking of the entire system, - the checking of elements directly affected by the evolution only, - the evolution analysis based only on system rules, and - the complete evolution analysis based on the causal relations extracted from the QoS Property Description.
Tab.4 regroups the results of the experiment. We collected
the number of property values that have to be re-checked in each case. There are several lessons to learn about this experiment: Full Re-check is resource-consuming. As stated in the table, the full re-check is the method having the most PVs to re-check. Moreover, the bigger the Busi-ness Process is compared to the evolution, the bigger the difference between this method and the others will be. On the other hand, this method insures not to forget anything. QoS enhancement provides better results than sys-tem causal model. As the QoS enhancement checks only the Computation Time and re-computes the Response Time, there is 1/3 less PVs to re-check for each activity. Most of the time, the evolution analysis based on the system is as efficient as checking the evolution only. This fact is due to the configuration of our experiment. Most of the evolution performed are ”self-contained”, in the sense that they do not affect variables that are re-used in the original Business Process. However, it is important to notice that the UnavailableIntResource is not self-contained: the evolution has a causal effect out of the scope of the evolution elements. As a result, the causal analysis produces results that are bigger than the re-check of the evolution, but they do include system elements that have been affected. Checking only the evolution is not sufficient. As stated in the previous point, the re-check of the elements of the evolution can forget causal effects, leading to a mistake in the prediction. In gen-eral, our methods provide better results than a full re-check, and similar or better results than a re-check of the evolution, with a better accuracy.
6.3
Threats to Validity
The experiment2showed that our prediction tool effectively
determined activities affected by the evolution on our case study. We showed that the more the causal model is explained, the more accurate the analysis is. However, the accuracy has
BP / evolution Full Recheck Evol Recheck System Causal Model QoS Causal Model Monit. Comp. Monit. Comp. Monit. Comp. Monit. Comp. BP resolveACrisis 7 acts MustAuthenticate 20 10 6 3 6 3 3 3 BP handleACrisis 5 acts ReHandleOnChange 20 10 10 5 10 5 5 5 BP handleAMission 11 acts UnavailableIntResource 24 12 2 4 8 4 4 4 UnavailableExtResource 30 15 8 4 8 4 4 4 ReHandleOnChange 32 16 10 5 10 5 5 5 BP handleAWorker 10 acts UseHelicopter 26 13 6 3 6 3 3 3 LostContact 26 13 6 3 6 3 3 3 Timeout 34 17 14 7 14 7 7 7 MissionFailed 26 13 6 3 6 3 3 3 ReHandleOnChange 30 15 10 5 10 5 5 5
Table 4: Number of elements to re-check for each analysis method
a cost: it is necessary for the QoS expert to give extra details about the definition of the QoS property. Moreover, the level of detail of the causal model leads to an increase in its memory size, which may have to be taken into consideration in the case of systems composed of hundreds of activities. Last but not least, the accuracy of the evolution analysis relies also on the correctness of the QoS Description. If some causal relations were not taken into consideration, it may be the case that the set of affected elements may differ from reality. We recommend to prefer an analysis encompassing too much elements than an analysis that could forget a causal effect that would lead to a non-QoS-safe evolution.
7.
RELATED WORK
Causal approaches - Causal relations among elements of processes have already been studied. Luckham et al. in-troduced the notion of causality to study Software Architec-tures [15]. Mayerl et al. established metrics dependencies, with a specific focus on performance properties [16]. Their approach is very similar to ours. However, their work does not focus on the evolution of a BP. Other work focus on impact analysis of software evolution. For instance, Elbaum et al. present an empirical study on the effect of software evolution on code coverage testing [8]. They show that even a small modification of the software can impact code instructions involving to retest the code. We aim at applying the same approach on BPEL processes at runtime.
Performance prediction - Other QoS prediction tech-niques have been previously presented. The Palladio com-ponent model [3] is specialised into performance prediction. It defines a model of component behaviour and resource us-age using parametric formula to estimate the QoS level of a system by simulation. If this approach is more precise in terms of property values due to their strong system and statistical models, we aimed with SMILE at reducing as much as possible the modelling effort without the task of writing several models such as performance, resource usage, etc.. In our approach, only the QoS Description has to be written. Still, SMILE is precise enough to determines the PVs to re-check. Moreover, SMILE has been designed to
analyse evolution, which was not the intent of the Palladio Component Model. We could combine the preciseness of
SMILEwith Palladio, by importing Palladio’s resource QoS
model, and generated a causal model from it. Similarly, the
MARTEUML profile [19] can be used for performance
mod-elling. It provides the Software architect with facilities to model time, resources and causality to perform performance analysis. However, as Palladio, it requires the definition of several performance models to predict efficient property val-ues, and is not oriented on evolution analysis. Koziolek et al. present the Q-Impress methodology which partially relies on Palladio and evaluate it on an industrial case [12]. They study code legacy to have a model of the system. Using it, they annotate components with their resources usage. These additional information help them to evaluate different archi-tectural evolution strategies considering quality attributes. If their approach is more accurate in terms of QoS prediction than ours, we are more time efficient since we reduce the num-ber of elements of the system to recheck while they recheck the entire system. Ivanovic et al. determine both at design time and runtime if Service Level Agreements (SLA) of an orchestration can be violated [10]. As us, they focus on QoS metrics that are measurable and can be aggregated. They express the different constraints as a Constraint Satisfaction Problem that they solve with constraint logic programming. This approach detects possible violations and determines the possible cause of such violation. However, it does not consider the evolution part of the development cycle.
8.
CONCLUSION AND FUTURE WORK
We presented in this paper an approach to study the evo-lution of a Business Process with a specific focus on QoS. Our approach relies on the definition of the causal model of a BP, as a key to determine the effect of an evolution by identifying affected system elements. We defined an analysis of the evolution to predict its effect on the overall QoS prop-erty value, validated empirically by comparing the prediction with effective values and with other methods. Our approach allows a reduction of the re-checking of QoS property values
after evolution, and give clues about the origin of a QoS contract violation by depicting the chain of consequences of the evolution. We enable the possibility to qualify the effect of an evolution and to determine the cause of a potential overhead.
However, our approach is profitable as long as the time spent on computing the set of affected elements is lower than the time to verify the entire system. We need to determine the threshold under which our method creates an overhead compared to a complete re-check of the system. This chal-lenge remains in our perspective. Moreover, we took the decision in this paper to study QoS property independently, without considering relationships between properties. Mod-elling these relationships would enable to build a hierarchy of properties and to detect if two properties are antagonist. Using this hierarchy of property would also help to prop-agate the effect of evolution among properties to avoid a systematic rechecking of every property. In the future, we will continue the development of SMILE to support QoS properties that are represented on several dimensions or that need a performance model to be studied. We will improve our tool to automate the property values determination and the selective monitoring. We also plan to use a probabilistic causal model to represent potential causality, using Bayesian Belief Network [21].
9.
ACKNOWLEDGMENTS
This work is partially funded by the French Ministry of Higher Education and Research, Nord-Pas de Calais Regional Council and FEDER through the Contrat de Plan Etat Re-gion Campus Intelligence Ambiante (CPER-CIA) 2007-2013.
10.
REFERENCES
[1] M. Barbacci, M. H. Klein, T. A. Longstaff, and C. B. Weinstock. Quality Attributes. Tech. report, Software Engineering Institute, 1995.
[2] L. Baresi and E. D. Nitto, editors. Test and Analysis of Web Services. Springer, 2007.
[3] S. Becker, H. Koziolek, and R. Reussner. The Palladio Component Model for Model-Driven Performance Prediction. J. Syst. Softw., 82:3–22, January 2009. [4] X. Blanc, I. Mounier, A. Mougenot, and T. Mens.
Detecting Model Inconsistency through
Operation-based Model Construction. In Proceedings of the 30th international conference on Software
engineering, ICSE ’08, pages 511–520, New York, NY, USA, 2008. ACM.
[5] R. Calinescu, C. Ghezzi, M. Kwiatkowska, and R. Mirandola. Self-adaptive software needs quantitative verification at runtime. Commun. ACM, 55(9):69–77, Sept. 2012.
[6] J. Cardoso, A. Sheth, J. Miller, J. Arnold, and K. Kochut. Quality of service for workflows and web service processes. Web Semantics: Science, Services and Agents on the World Wide Web, 1(3):281 – 308, 2004. [7] I. Crnkovic, M. Larsson, and O. Preiss. Concerning
Predictability in Dependable Component-Based Systems: Classification of Quality Attributes. In Dependable Component-Based Systems, volume 3549, pages 257–278. Springer, 2005.
[8] S. Elbaum, D. Gable, and G. Rothermel. The Impact of Software Evolution on Code Coverage Information. In
In Intl. Conference on Software Maintenance, pages 170–179, 2001.
[9] C. Gerede, K. Bhattacharya, and J. Su. Static analysis of business artifact-centric operational models. In Service-Oriented Computing and Applications, 2007. SOCA ’07. IEEE International Conference on, pages 133 –140, june 2007.
[10] D. Ivanovic, M. Carro, and M. Hermenegildo. Constraint-Based Runtime Prediction of SLA Violations in Service Orchestrations. In
Service-Oriented Computing, volume 7084, pages 62–76. Springer/ Heidelberg, 2011.
[11] J. Kienzle, N. Guelfi, and S. Mustafiz. Crisis
management systems: a case study for aspect-oriented modeling. Transactions on aspect-oriented software development VII, pages 1–22, 2010.
[12] H. Koziolek, B. Schlich, C. Bilich, R. Weiss, S. Becker, K. Krogmann, M. Trifu, R. Mirandola, and A. Martens. An Industrial Case Study on Quality Impact Prediction for Evolving Service-Oriented Software. In ICSE Soft. Engin. in Practice Track, pages 776–785, 2011. [13] M. M. Lehman and L. A. Belady, editors. Program
evolution: processes of software change. Academic Press Professional, Inc., San Diego, CA, USA, 1985.
[14] F. Lelli, G. Maron, and S. Orlando. Client side estimation of a remote service execution. In Modeling, Analysis, and Simulation of Computer and
Telecommunication Systems, 2007. MASCOTS’07., pages 295–302. IEEE, 2007.
[15] D. Luckham, J. Kenney, L. Augustin, J. Vera, D. Bryan, and W. Mann. Specification and analysis of system architecture using rapide. Software Engineering, IEEE Transactions on, 21(4):336–354, 1995.
[16] C. Mayerl, K. Huner, J.-U. Gaspar, C. Momm, and S. Abeck. Definition of metric dependencies for monitoring the impact of quality of services on quality of processes. In Business-Driven IT Management, 2007. BDIM ’07. 2nd IEEE/IFIP International Workshop on, pages 1 –10, may 2007.
[17] S. Mosser and M. Blay-Fornarino. ADORE, a Logical Meta-model Supporting Business Process Evolution. Science of Computer Programming (SCP), pages 1–35, 2012.
[18] D. Mukherjee, P. Jalote, and M. Gowri Nanda. Determining QoS of WS-BPEL Compositions. In ICSOC 2008, volume 5364, pages 378–393. Springer/ Heidelberg, 2008.
[19] OMG. Uml profile for marte: Modeling and analysis of real-time embedded systems, 2009.
[20] M. P. Papazoglou and W. J. V. D. Heuvel. Service Oriented Design and Development Methodology. Int. J. Web Eng. Technol., 2(4):412–442, 2006.
[21] J. Pearl. Causality: models, reasoning and inference, volume 29. Cambridge Univ Press, 2000.
[22] L. Seinturier, P. Merle, R. Rouvoy, D. Romero, V. Schiavoni, and J.-B. Stefani. A Component-Based Middleware Platform for Reconfigurable
Service-Oriented Architectures. Software: Practice and Experience, 42(5):559–583, 2012.
[23] L. Zeng, H. Lei, and H. Chang. Monitoring the QoS for Web services. Service-Oriented Computing–ICSOC 2007, pages 132–144, 2007.


![Tab. 3 depicts the mapping between Property Kind [7] and our QoS Property Description, and illustrates it](https://thumb-eu.123doks.com/thumbv2/123doknet/13451428.410859/8.918.477.828.238.376/tab-depicts-mapping-property-kind-property-description-illustrates.webp)


