HAL Id: hal-01491238
https://hal.archives-ouvertes.fr/hal-01491238
Preprint submitted on 24 Mar 2017HAL is a multi-disciplinary open access
archive for the deposit and dissemination of sci-entific research documents, whether they are pub-lished or not. The documents may come from teaching and research institutions in France or
L’archive ouverte pluridisciplinaire HAL, est destinée au dépôt et à la diffusion de documents scientifiques de niveau recherche, publiés ou non, émanant des établissements d’enseignement et de recherche français ou étrangers, des laboratoires
Women’s empowerment across the life cycle and
generations: Evidence from Sub-Saharan Africa
Florence Arestoff, Elodie Djemaï
To cite this version:
Florence Arestoff, Elodie Djemaï. Women’s empowerment across the life cycle and generations: Evi-dence from Sub-Saharan Africa. 2017. �hal-01491238�
UMR 225 IRD - Paris-Dauphine
UMR DIAL 225
Place du Maréchal de Lattre de Tassigny 75775 • Paris Cedex 16 •Tél. (33) 01 44 05 45 42 • Fax (33) 01 44 05 45 45 • 4, rue d’Enghien • 75010 Paris • Tél. (33) 01 53 24 14 50 • Fax (33) 01 53 24 14 51
E-mail : dial@dial.prd.fr • Site : www.dial.prd.fr
D
OCUMENT DE
T
RAVAIL
DT/2013-16
Women's empowerment across the
life cycle and generations:
Evidence from Sub-Saharan Africa
Florence ARESTOFF
Elodie DJEMAI
WOMEN'S EMPOWERMENT ACROSS THE LIFE CYCLE AND GENERATIONS:
EVIDENCE FROM SUB-SAHARAN AFRICA1
Florence Arestoff
PSL, Université Paris Dauphine, LEDa, IRD, UMR DIAL
florence.arestoff@dauphine.fr
Elodie Djemai
PSL, Université Paris Dauphine, LEDa, IRD, UMR DIAL
elodie.djemai@dauphine.fr
Document de travail UMR DIAL
Décembre 2013
Abstract
Does female empowerment evolve over the life cycle, and has it changed across generations? We use data from the Demographic and Health Surveys covering a sample of about 191,000 adult women to evaluate the age, period and cohort effect regarding individual attitudes to marital violence. Pseudo-panel data are constructed from repeated cross-sections from five African countries in the 2000s. The estimates show that, over the life cycle, women tend to think that marital violence is less and less justifiable, and that younger cohorts are less likely than older cohorts to view marital violence as justifiable, even controlling for education. In the full age-period-cohort decomposition, the age and period effects are the most important. Age effects are driven by changes in labor-force status, household composition and parenthood.
Key words: Empowerment, marital violence, age-period-cohort, pseudo-panel, Sub-Saharan
Africa.
Résumé
L'autonomisation des femmes, leur "empowerment", évolue-t-elle tout au long de leur cycle de vie ? S'est-elle renforcée au fil des générations ? A partir de données issues des Enquêtes Démographiques et de Santé portant sur un échantillon de 191 000 femmes adultes, nous estimons les effets d'âge, de période et de cohorte sur le refus de la violence conjugale, pris comme mesure de l'empowerment. Nous construisons un pseudo-panel en mobilisant des données de plusieurs vagues d'enquêtes consécutives menées dans cinq pays d'Afrique Sub-Saharienne au cours des années 2000. Les estimations montrent qu'en terme de cycle de vie, plus les femmes vieillissent, moins elles considèrent la violence conjugale comme justifiable. Parallèlement, en terme de générations, les femmes des plus jeunes cohortes ont une moindre probabilité d'accepter la violence conjugale, à niveau d'éducation donné. Dans la décomposition Age-Période-Cohorte, les effets de l'âge et de la période d'enquête se révèlent être les plus importants. On montre également que les effets de l'âge sont en partie expliqués par les changements de la situation des femmes sur le marché du travail, la composition de leur ménage et leur rôle de parent.
Mots Clés : Empowerment, violence conjugale, âge-période-cohorte, pseudo-panel, Afrique
Sub-Saharienne.
JEL Code: J12, J16, O10, I31.
1
1
Introduction
In recent years, female empowerment in developing countries has attracted growing interest from policy-makers and researchers. This empowerment has become a policy goal per se and in acknowl-edgment of the long-run benefits it confers on women and their families. Empowerment can be viewed as a dynamic process that increases women’s ability to make choices about their lives and environment (Malhotra and Schuler, 2005), or as the ability to access health, education, earning op-portunities, rights and political participation (Duflo, 2011). It is a multidimensional concept which is not directly observable. A recent body of empirical literature has however made some attempts at measurement. Various approaches have been considered, such as participation in household decision-making, gender-relative status or control over money use (Beegle et al. 2001, Anderson and Eswaran 2008, Garikipati 2008, Ashraf et al. 2010, Allendorf 2012). The empowerment of women and reduced gender inequality has been shown to increase the use of prenatal and deliv-ery care services (Beegle et al. 2001), influence investment in children and other family members (Reggio 2011), increase female labor-force participation (Hendy and Sofer 2009), and improve both productivity and efficiency (Alkire et al. 2013).
What are the main driving forces behind empowerment? Does female empowerment evolve over the life cycle and has it changed across generations? It is commonly-believed that young women now are more emancipated than their older counterparts. Does the fact that younger women are now more empowered mean that empowerment falls over the life cycle (i.e. the aging effect is negative)? This is probably not the case, especially if we view empowerment as a stock that is likely accumulated over time. An alternative reading is that young women being more empowered means that women from recent generations are more empowered than their counterparts from older generations (i.e. a cohort effect), with one explanation being changes in educational attainment. Are women empowering as they age or are women from recent generations starting with a greater empowerment stock than their older counterparts? The use of panel or pseudo panel data is required to disentangle the life-cycle and cohort effects (Deaton, 1985). We here propose the use of pseudo-panel data to estimate the respective roles of age, period and cohort on female empowerment.
(Mahmud et al., 2012). Domestic violence against women has received growing attention worldwide, and is considered not only as a violation of fundamental rights but also as a burden leading to considerable health and demographic damage (e.g. Sobkoviak et al. 2012). Considerable political effort has been mobilized against this form of violence. Violence against women can be analyzed by focusing on whether a woman has been a victim of violence, or alternatively whether women consider marital violence to be acceptable within their households, or against women in society in general.
The knowledge of women’s attitudes to wife-beating is fundamental for seeing how women perceive the status of their gender in society. Hindin (2003) notes that women’s attitudes can serve as a marker for the social acceptability of wife-beating. Using a perception measure of whether marital violence can be justified provides insights into women’s views of their place in society. The use of this perception as a proxy for empowerment has a number of advantages. Views about wife-beating may be easier to elicit via surveys than women’s own experiences of household violence, which may be subject to misreporting for social-judgment reasons (see Amoakohene, 2004). Views regarding marital violence will provide an indication of its extent, given the high correlation between the two. Using DHS data, WHO (2005) finds that the proportion of women agreeing that a man can have a good reason to beat his wife is significantly higher among women who have experienced partner violence than among those who have not. Uthman et al. (2009) explore the reverse causality of this relationship, showing that women who tolerate wife-beating are more likely to have experienced marital violence. This may show that either women learn to rationalize violence when they are themselves victims, or that women are at a greater risk of violence in communities where more people accept this form of violence. The potential reverse-causality bias is less of an issue when analyzing the impact of socio-demographic characteristics on perceptions than on the actual experience of violence.
This paper contributes to the literatures on the determinants of women’s empowerment and views on marital violence by providing new information about changes over the life cycle and differences across generations using data from a sample of Sub-Saharan African countries. Previous work on the determinants of female empowerment has considered the role of credit access (Ashraf
et al. 2010; Garikipati 2008), labor-force status and, in particular, working outside the husband’s farm (Anderson and Eswaran 2008), education (Mahmud et al. 2012), and television watching (Mahmud et al. 2012). Cross-cultural research on women’s views regarding domestic violence against women is still limited, however. The Demographic and Health Surveys collected in most developing countries, which include a wide range of information about health outcomes, have since the very late 1990s contained additional questions on marital violence, allowing for cross-country comparisons, and have been analyzed in a number of existing pieces of research (Hindin 2003; Lawoko 2006, 2008; Li and Yount 2009; Oyediran and Isiugo-Abanihe 2005; Rani et al. 2004; Yount 2005; Yount and Carrera 2006). We depart from this existing literature by using a pseudo-panel data model to analyse the respective roles of aging and cohort.
Most of the work on the effect of age on female empowerment or views on marital violence has relied on cross-section data, and has produced contrasting results. In terms of female empowerment, Anderson and Eswaran (2008) conclude to a zero or negative effect of age on indicators of female autonomy, while Mahmud et al. (2012) found a significant effect for two out of five empowerment indicators, but with effects in opposite directions. In terms of the acceptance of domestic violence, Hindin (2003) revealed a strong positive association between acceptance and age in data from the 1999 Zimbabwe Demographic and Health Survey. However, it is difficult to identify age effects cleanly in cross-section data. In cross-sections, any estimated age differences may reflect actual age, or equally the effect of the characteristics of different birth cohorts (see e.g. Glenn 2005).
We here use pseudo-panel data to analyze attitudes to marital violence over cohorts based on a representative sample of about 191,000 women aged between 15 and 49. We use three succes-sive cross-sections of data from the Demographic and Health Surveys in five Sub-Saharan African countries (Ethiopia, Malawi, Rwanda, Uganda and Zimbabwe). In each survey wave, the sample is random and representative. In repeated cross-section data, households and individuals are not tracked over time, but a pseudo-panel data can be constructed so as to follow groups of people who belong to the same birth cohorts, defined at the country-level.
We consider a number of approaches to the measurement of the relative roles of age, period and cohort (APC) on marital-violence attitudes. We first look at these pairwise, before setting
out a full APC decomposition. Our age-period-cohort analysis aims to isolate the effects of each component on some outcome of interest net of the influence of the other two (Yang and Land 2008). The period or wave effects in our analysis show the evolution in attitudes over the 2000s, as we use survey data collected at three points in time: the early 2000s, the mid-2000s and the late 2000s. The results suggest that, when taken pairwise, all three components help explain the percentage of women considering marital violence as not justified under any circumstances. We have three main findings. First, in a given cohort, women are more empowered as they age. Second, women in the early 2000s are more likely to think marital violence justified than those in the mid-2000s, and especially those in the late 2000s, suggesting strong period effects. Third, women in more recent cohorts are less likely to accept violence than women born in the 1950s. In addition, the full age-period-cohort decomposition suggests that some of these findings were due to confounding factors, as cohort effects are no longer statistically significant, while the age and period effects continue to play an important role in explaining female empowerment.
We explore the mechanisms behind the age effects. First, these could reflect female labor-force participation rising with age (as compared to a young woman of 15). Labor-force participation may empower women in their households and communities, and enable them to communicate more with their peers, including with respect to gender roles and status. When we control for labor-force status, we find that working women are far more likely than others to refuse marital violence, and that the age effects become insignificant. A second pathway could work via household composition, whereby younger women are more likely to still live with their parents. As such, they are more influenced by older generations who are less critical of violence, and in addition they may not perceive what wife-beating means, as they are not in a couple. We thus control for whether the woman is living in a nuclear-type family in which she is the household head or the spouse of the household head. Our finding suggests that living in a nuclear family increases female empowerment, and somewhat attenuates the age effect. Last, age effects can reflect parenthood: older women are more likely to have had children, including sons, which might empower them in a patrilocal context. Controlling for the number of sons in the estimation as well as the number of children does not change the strong effect of aging on empowerment.
The remainder of the paper is organized as follows. Section 2 presents the pseudo-panel approach and Section 3 the data and variables. Section 4 provides and comments on the estimation results, and some robustness checks are explored in Section 5. Last, Section 6 concludes.
2
A pseudo-panel approach
For each woman i surveyed at time t in country c, we observe her opinion on whether marital violence is justified under some circumstances. The probability of not thinking marital violence justified under any circumstances can then be estimated via a linear probability model such that:
P (yic= 1) = α + λageic+ βXic+ γc+ εic (1)
where Xi includes a full set of explanatory variables (marital status, education and wealth), γc is a country-specific effect, and εic the error term. The age effects λ are not well-identified in this cross-section model, as they are correlated with the cohort effects. In the context of the current paper, there may well be unobserved cohort heterogeneity such as the social environment each cohort faced during childhood and adulthood, or the exposure to human rights while at school or from the media.
The use of panel data allows us to follow individuals over time and estimate the effect of changing age while controlling for both unobserved individual characteristics via individual fixed-effects (δi) and time fixed effects (θt), as in Equation 2.
P (yict = 1) = α + λageict+ βXict+ δi+ θt+ εict (2)
However, individual panel data is rarely available in developing countries. Following Deaton (1985), we appeal to the pseudo-panel method which follows groups of individuals (rather than individuals) over time. A pseudo-panel follows groups of individuals over repeated cross-section surveys, where the groups are defined by some time-invariant characteristics. Our cohorts here are defined by the birth year for each country in our sample.1 In each country and wave, the individual
1
dimen-observations on the variables of interest are averaged over cohort members to produce an equation expressed in terms of cohort means, which then become the units of observation in the pseudo-panel estimation as follows:
¯
ygct= α + λagegct+ β ¯Xgct+ δg+ θt+ γc+ ¯εgct (3) Here ¯ycgt is the proportion of women in generation (cohort) g in country c surveyed at time t who say that marital violence is not justified under any circumstances. The δg can be viewed as unobserved cohort fixed effects, and the variables in ¯Xgct are the means or proportions of the individual characteristics in each gct group (e.g. the average number of years of education).
Equation (3) has two advantages. First it allows us to correct for unobserved cohort heterogene-ity via cohort fixed effects. Second, the use of cohort means helps to ”average out” any individual measurement errors (Antman and McKenzie 2007). The flip side, however, is that our individual observations here represent averages based on a number of individuals which varies from one group to another, and even within-group from one survey wave to another. As such, the error term ¯εgct is heteroskedastic, yielding biased standard errors. As is usual in the pseudo-panel literature, this heteroskedasticity is corrected via the use of weighted least squares (WLS), with the weights being the size of the sampled cohort (see e.g. Dargay 2007; Duval-Hernandez and Orraca Romano 2009; Warunsiri and Mcnown 2010).
Dargay (2007) includes a useful discussion on how to define the cohorts or groups of individuals to be followed in pseudo-panel analysis, and the trade-off between the number of observations included in each group and the number of groups. In our case, the DHS includes data over a large sample of individuals, so that we can define groups in a fairly fine way and not pool birth cohorts over all countries. As a result the variation within cohorts is quite small compared to that between cohorts.
We carry out an age, period and cohort decomposition. In our approach the three effects can be simultaneously identified. The identification relies on the definition of the periods, which avoids sion is also feasible, as in Dargay (2002) who uses both birth year and residential location, and Duval-Hernandez and Orraca Romano (2009) who use birth year, gender and educational attainment. Our two time-invariant dimensions here are birth year and country.
the problem of strict multi-collinearity between the three components. Instead of using the exact survey year – which is equal to the sum of birth year and age – dummy variables for whether the observations refer to the women surveyed in the first, second or third rounds of the DHS are employed. As shown in Table 1, the three rounds of data were roughly collected at the same period of time over the five countries in our sample. We approximate changes over time by comparing the early 2000s to the mid-2000s and the late 2000s.
3
Data description
This paper exploits data from the Demographic and Health Surveys, which are nationally repre-sentative household surveys collected in many developing countries, and especially in Sub-Saharan Africa. These surveys are representative of the adult population (women aged from 15 to 49 years old, and men from 15 to 54 or 59). The original aim of the DHS was to evaluate and compare health indicators such as infant and maternal mortality, and the use of antenatal care. A set of questions about domestic violence and its acceptance was added to the initial questionnaire in 1999 in Zimbabwe, and subsequently appears in most of the surveys collected in Sub-Saharan Africa.
To implement the pseudo-panel methodology, countries in Sub-Saharan Africa were selected based on two criteria: the existence of at least three successive rounds of Demographic and Health Surveys data and the inclusion in the questionnaire of the questions on perceptions regarding marital violence. Our panel of countries includes five countries from East and Southern Africa (Ethiopia, Malawi, Rwanda, Uganda and Zimbabwe) which were surveyed at roughly the same time: the early 2000s, mid 2000s and early 2010s (see Table 1). Appearing in three successive DHS survey waves is actually fairly rare: in addition to the countries we analyze here, this only occurs for Peru, Armenia and Indonesia.
3.1 The cohort data
The pseudo-panel appeals to the women’s age at the time of the survey to establish her birth cohort: if a woman is x years old in year t, then she will be x + 1 years old in year t + 1, x + 2 years old in
TABLE 1. List of DHS countries
Country name Survey years
Early 2000s Mid-2000s Late 2000s
Ethiopiaa 2000 2005 2010-2011
Malawi 2000 2004-2005 2010
Rwanda 2000 2005 2010-2011
Uganda 2000-2001 2006 2011
Zimbabwe 1999 2005-2006 2010-2011
Note: a These years refer to the standard calendar, and not to the Ethiopian calendar.
year t + 2, and so on. Respondents report their age in each survey. Instead of the declared year of birth, we create a new variable equal to the difference between the survey year and declared age. This approach solves two empirical difficulties. First, respondents with the same reported age can be born in different years, depending on their date of birth and the interview date. A 20 year-old woman in Malawi in the July to November 2000 survey may have been born in either 1979 or 1980 depending her birthday. In the pseudo-panel, we want each birth year to be associated with only one age and this is what our new variable does. The second difficulty refers to survey timing. Data collection in some cases covers two calendar years: this is the case for Ethiopia 2011, Malawi 2004, Rwanda 2010, Uganda 2000 and Zimbabwe 2005 and 2010. We want to set only one year, even for surveys collected over two calendar years: the retained survey year is that in which the most data-collection months occurred.
The cohorts are defined for the birth years from 1951 to 1996, using data from surveys for 1999 through 2011. Note that the 1962-1984 cohorts are observed over three successive surveys in all five countries. The averages for each birth year are generated by country and survey year. We have the advantage here of a large sample size: only 2% of the observations are averages based on country-cohorts with fewer than 100 observations. The average number of women in each cell is between 229 and 577 (see Table 2).
3.2 Attitudes toward wife-beating
The surveys collect information on individual attitudes toward wife-beating, which we use as a proxy for empowerment. Women were asked whether a husband is justified in beating his wife
TABLE 2.
Number of women per country-cohort
Country Number of cells Mean Min Max
Ethiopia 105 435.7 121 1075
Malawi 105 577.4 124 1524
Rwanda 105 335.7 92 677
Uganda 105 231.4 49 462
Zimbabwe 104 229.0 52 473
Source: Authors’ calculations from the Demographic and Health Surveys.
under a series of circumstances. The five circumstance questions are as follows in the questionnaire: ”Sometimes a husband is annoyed or angered by things which his wife does. In your opinion, is a husband justified in hitting or beating his wife in the following situations: (i) if she goes out without telling him; (ii) if she neglects the children; (iii) if she argues with him; (iv) if she refuses to have sex with him; and (v) if she burns the food?” Using another set of Demographic and Health Surveys, Yount et al. (2011) emphasize that changes in the wording of the attitudinal questions account for a non-trivial portion of the variance in reported acceptance toward wife-beating. In our case, the attitudinal questions are worded in exactly the same way in all of the survey waves we employ, which makes the data comparable across both survey waves and countries.
For each circumstance, the woman can answer that wife-beating is justified, is not justified, or she does not know. There are only few ”does not know” replies.2 We henceforth recode these as missing values (although this assumption will later be relaxed as a robustness check). We create an individual-level dummy variable for not justifying wife-beating under any circumstances. Table 3 shows the number of women per wave and country survey and the percentage not justifying wife-beating.
Three points can be underlined in these descriptive statistics. First, despite political awareness and the on-going worldwide ratification process regarding conventions on the elimination of all forms of gender discrimination, violence refusal rates remain remarkably low in our sample of countries. In Ethiopia, for example, only one fifth of women refuse wife beating at the beginning of our analysis period. Second, the refusal of domestic violence has grown over the 2000s. Over
2
Over the full sample of individual observations, the proportion of “does not know” varies from 1.11% for circum-stance (v) to 3.45% for circumcircum-stance (iv).
TABLE 3
Proportion of women not justifying violence
Early 2000s Mid-2000s Late 2000s
Obs. % Obs. % Obs. %
Ethiopia 15,283 21.0 13,991 25.1 16,472 35.0 Malawi 26,180 62.9 11,510 70.5 22,935 87.2 Rwanda 10,342 37.8 11,249 52.7 13,659 44.5 Uganda 7,206 24.3 8,474 29.2 8,612 43.4 Zimbabwe 5,813 46.2 8,862 51.5 9,142 61.3 All 64,824 43.2 54,086 45.4 70,820 58.2
Note: See Table 1 for the exact survey years.
Source: Authors’ calculations from the Demographic and Health Surveys.
the whole sample, this rises from 43.2 to 58.2 percent. This increase is especially remarkable in Malawi, where the rise is of 24 percentage points from 2000 to 2010. The exception is Rwanda, where the refusal rate is hump-shaped between 2000 and 2010 so that women in Rwanda were on average more likely to reject marital violence in 2005 than in 2010. Third, there are considerable differences across countries. The percentage of women rejecting domestic violence for any reason ranges from 87.2% in Malawi in 2010 to 35% in Ethiopia in 2011.
3.3 Explanatory variables
The Demographic and Health Surveys include standard socio-demographic information on edu-cation, residence and marital status, which constitute our set of control variables.3 Regarding standards of living, there are no questions on consumption or income. Instead, respondents are asked about their ownership of durable assets and housing characteristics. This type of information is often used to proxy wealth via an index from a principal components analysis, as suggested in Filmer and Pritchett (2001). The data provider has applied this methodology to generate a wealth index, and ranks households according to the value of this continuous index.
Table 4 presents some descriptive statistics of the main variables we use here for the whole sample (about 190,907 women) and by country. Average age is about 28. Education differs widely from one country to another: over the whole sample, average years of education are 4.62, ranging
3
TABLE 4 Descriptive Statistics
Variables All Ethiopia Malawi Rwanda Uganda Zimbabwe
Age 27.93 27.90 27.89 28.20 27.82 27.78 Years of education 4.62 2.65 4.72 4.14 5.25 8.21 No. of children 2.85 2.82 3.09 2.55 3.36 2.20 Urban 24.79% 31.11% 17.09% 21.79% 26.29% 35.27% Marital status Single 29.21% 28.22% 21.78% 43.26% 29.39% 29.16% Married 61.58% 61.43% 69.58% 48.52% 62.95% 59.38% Previously married 9.20% 10.35% 8.64% 8.21% 7.66% 11.45% Relative wealth Poorest 19.81% 18.70% 19.30% 23.16% 18.99% 19.11% Poorer 17.28% 14.77% 19.26% 16.75% 16.94% 18.21% Intermediate 17.75% 15.59% 19.91% 17.36% 16.69% 18.01% Richer 18.45% 15.61% 20.17% 17.45% 18.15% 21.26% Richest 26.71% 35.33% 21.36% 25.29% 29.23% 23.40%
Source: Authors’ calculations from the Demographic and Health Surveys.
from 2.65 in Ethiopia to 8.21 in Zimbabwe. Over the whole sample, 25% of women live in an urban area. We have three marital-status groups: the never married, the married (married or living with their partner), and the previously married who are either separated, divorced or widowed. Married women account for about 62% of the whole sample. The proportion of single women varies from 22% in Malawi to double that (43%) in Rwanda. Relative wealth categories are calculated by the data provider at the household level, which explains why the categories are not evenly split across the sample of women. It appears that more women were interviewed in wealthier households, as these account for about 26% of the sample.
4
Results
4.1 Raw life-cycle profiles
The time profiles for the refusal of wife beating for the different birth cohorts are presented by country in Figure I. For clarity, 5-year birth-cohort bands are used. The age of the women at the time of the survey is given on the horizontal axis, and the refusal rate on the vertical axis. The lines represent the different cohorts as they are followed over the repeated cross section surveys.
The initial data point for each cohort corresponds to the first year of survey in which the birth cohort appears. Women are eligible for interview if they are aged between 15 and 49. As a result, women from the oldest cohort born in the early 1950s are only observed in the surveys collected in 1999-2000, while women from the youngest cohort born in 1991-1996 are only observed in the most recent waves collected in 2010-2011. These raw profiles provide us with some insights into both the life-cycle and generation effects.
First, the refusal of marital violence is increasing and concave over the life cycle in four of the five countries, with a hump-shape in Rwanda. For example, in Ethiopia the 1981-1985 cohort is observed in 2000, 2005 and 2011, and women in this cohort are observed from 15 to 30 years of age. In this cohort, 20.1% of women at age 15 view marital violence as not being justified, with an analogous figure of 39.5% at age 29.
Second, regarding cohort effects, the refusal rate at every age is higher for the younger compared to the older cohorts. For instance, the proportion of 22 year-old Ethiopian women who think marital violence is not justified under any circumstance is higher in the 1986-1990 than in the 1981-1985 cohort, and much higher than that in the 1976-1980 cohort. All of these graphs exhibit large movements between the segments, although this is more pronounced in Ethiopia and Malawi. These displacements suggest large cohort (or generational) effects at a given age. Such large cohort effects may reflect changes in legislation against marital abuse, or the recent rise in education.
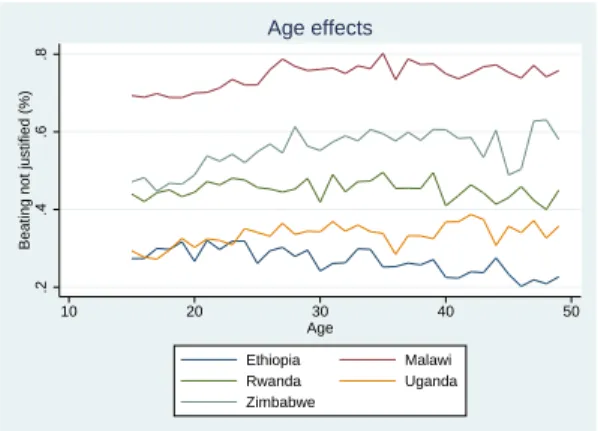
4.2 Age effects
Figure II depicts the age effects by country, showing the percentage of women not justifying marital violence under any circumstances. It can clearly be seen that non-acceptance in Malawi is much higher than that in the other countries at every age. Two sets of countries start with similar rates at lower ages, but follow different profiles as women age. In Ethiopia and Uganda, about 30% of women between 15 and 22 reject wife-beating under any circumstances; the countries then diverge, producing a difference in refusal rates at age 49 of over 10 percentage points. Equally, young women in Rwanda and Zimbabwe start with refusal rates of about 45% in their teens, after which the figure rises faster in Zimbabwe than in Rwanda.
4.3 Cohort effects
Figure III shows the cohort effects. It can be seen that the country ranking remains stable over time. The two extremes are Malawi, where the refusal rate is about 70%, and Ethiopia where it varies between 20 and 30%. In between these two we have, in increasing order of acceptance of marital violence, Zimbabwe, Rwanda and Uganda. Apart from in Zimbabwe, where the profile is flat, the time trend in women’s refusal of wife-beating is increasing over the cohorts. As such, women from younger cohorts are more likely than women from the older cohorts to think that marital violence is not justified.
4.4 Estimation results
For each survey wave, the individual observations on the variables of interest are averaged over each birth cohort, producing country-cohort-wave averages as the units of observation.
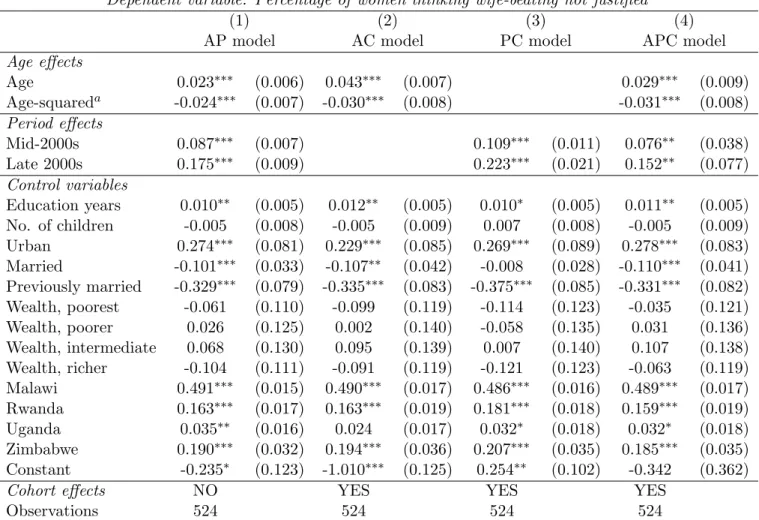
Table 5 shows the results from weighted least-squares estimation in the pseudo-panel data. Columns 1-4 display the estimates from the age-period, age-cohort, period-cohort and age-period-cohort models respectively. The results show that the percentage of women not justifying wife-beating is rising and somewhat concave in age in every specification. In the first specification, the age variable captures both the life-cycle and generation effects, while in the last specification, the effect of age is net of the cohort effects. As such, the column 4 results suggest that within-cohort, women are less accepting of violence as they age.
There are strong period effects in columns 1, 3 and 4. Saying that wife-beating is not justified under any circumstances has become more common over time, even controlling for age and cohort. The period effects thus suggest a trend towards less acceptance of marital violence, or greater female empowerment. The percentage of women not justifying violence is 8 and 15 percentage points higher among women surveyed in the mid-2000s and late 2000s respectively compared to their counterparts surveyed in the early 2000s.
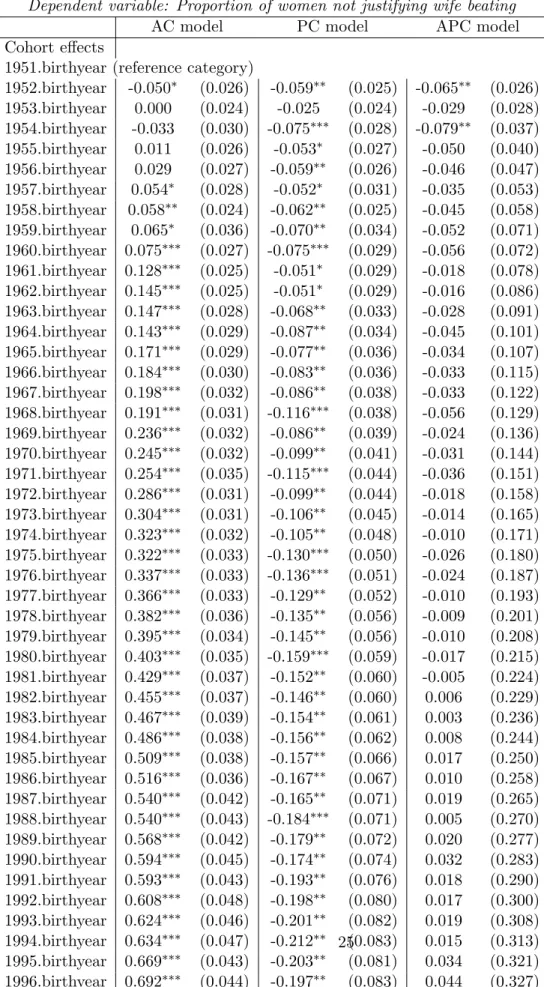
The estimated cohort effects appear in the Appendix (Table A1) and in Figure IV. The cohort effects are statistically significant when considered pairwise in addition to age or period effects, but
TABLE 5: The Refusal of Marital Violence
Dependent variable: Percentage of women thinking wife-beating not justified
(1) (2) (3) (4)
AP model AC model PC model APC model
Age effects Age 0.023∗∗∗ (0.006) 0.043∗∗∗ (0.007) 0.029∗∗∗ (0.009) Age-squareda -0.024∗∗∗ (0.007) -0.030∗∗∗ (0.008) -0.031∗∗∗ (0.008) Period effects Mid-2000s 0.087∗∗∗ (0.007) 0.109∗∗∗ (0.011) 0.076∗∗ (0.038) Late 2000s 0.175∗∗∗ (0.009) 0.223∗∗∗ (0.021) 0.152∗∗ (0.077) Control variables Education years 0.010∗∗ (0.005) 0.012∗∗ (0.005) 0.010∗ (0.005) 0.011∗∗ (0.005) No. of children -0.005 (0.008) -0.005 (0.009) 0.007 (0.008) -0.005 (0.009) Urban 0.274∗∗∗ (0.081) 0.229∗∗∗ (0.085) 0.269∗∗∗ (0.089) 0.278∗∗∗ (0.083) Married -0.101∗∗∗ (0.033) -0.107∗∗ (0.042) -0.008 (0.028) -0.110∗∗∗ (0.041) Previously married -0.329∗∗∗ (0.079) -0.335∗∗∗ (0.083) -0.375∗∗∗ (0.085) -0.331∗∗∗ (0.082) Wealth, poorest -0.061 (0.110) -0.099 (0.119) -0.114 (0.123) -0.035 (0.121) Wealth, poorer 0.026 (0.125) 0.002 (0.140) -0.058 (0.135) 0.031 (0.136) Wealth, intermediate 0.068 (0.130) 0.095 (0.139) 0.007 (0.140) 0.107 (0.138) Wealth, richer -0.104 (0.111) -0.091 (0.119) -0.121 (0.123) -0.063 (0.119) Malawi 0.491∗∗∗ (0.015) 0.490∗∗∗ (0.017) 0.486∗∗∗ (0.016) 0.489∗∗∗ (0.017) Rwanda 0.163∗∗∗ (0.017) 0.163∗∗∗ (0.019) 0.181∗∗∗ (0.018) 0.159∗∗∗ (0.019) Uganda 0.035∗∗ (0.016) 0.024 (0.017) 0.032∗ (0.018) 0.032∗ (0.018) Zimbabwe 0.190∗∗∗ (0.032) 0.194∗∗∗ (0.036) 0.207∗∗∗ (0.035) 0.185∗∗∗ (0.035) Constant -0.235∗ (0.123) -1.010∗∗∗ (0.125) 0.254∗∗ (0.102) -0.342 (0.362)
Cohort effects NO YES YES YES
Observations 524 524 524 524
Notes: aAge squared is divided by 100. ∗ p < 0.10,∗∗ p < 0.05,∗∗∗p < 0.01. Robust standard errors in parentheses.
become insignificant in the age-period-cohort model. In this latter (column 4), the three effects are combined, and the life-cycle and period effect are found to be the most powerful predictors of empowerment. Within each cohort, women are less likely to justify wife-beating as they get older and as they are interviewed more recently.
In the age-cohort and period-cohort specifications, the estimated cohort effects are of opposite sign. Women from more recent generations than 1951 (the reference category) are more empowered when controlling for age but not for period (column 2) but less empowered when we control for period but not for age (column 3). In the pairwise decomposition, the omitted effect is captured in one of the other two included effects. In the age-cohort model, the positive cohort effects mean that at a given age, women born recently are more likely to refuse wife-beating. This feature captures in a sense the period effects. In the period-cohort model, the cohort effects being negative means that in a given survey wave, women born more recently are less likely to refuse wife-beating. In other words, young women are more likely to accept wife-beating, which is the life-cycle effect found in the age-period and the age-cohort models.
For a given cohort, the age and period effects can also be mixed together. In the age-cohort model the age effects are larger than in the age-period model, suggesting that the period effect is captured in the estimated age coefficient. Women from a given cohort are getting older and at the same time the society is changing over the 2000s. In the period-cohort model, the age effects are captured by the period effects in the same way.
The estimated country effects show that women in Uganda, Rwanda, Zimbabwe and Malawi are significantly more likely than women in Ethiopia to think that marital violence cannot be justified. There is country heterogeneity in terms of empowerment. These systematic differences can result from differences in school quality or the political effort to back awareness campaigns, for example. The formal explanation of this heterogeneity is beyond the scope of this paper.
Education plays a significant role in explaining attitudes to marital violence, and violence refusal rises with education. Urbanization is also associated with greater refusal. Married women are however less likely than single women to reject wife-beating, and previously-married women are the most accepting of marital violence. Relative wealth plays no statistically significant role in our
regressions.
5
Robustness checks and underlying mechanisms
5.1 Robustness checks
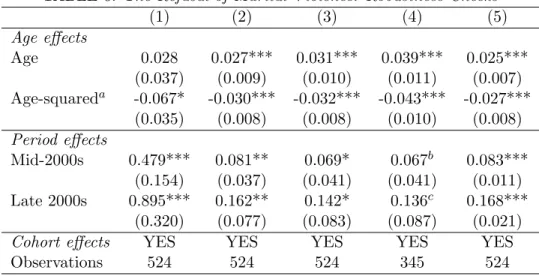
We now carry out some robustness checks to test the validity of the results from the age-period-cohort decomposition model (Table 5, column 4).
The first check consists in modifying the definition of the dependent variable. We first follow Mahmud et al. (2012) and consider a finer way of looking at refusal using the five original cir-cumstance questions that women were asked. The number of circir-cumstances under which marital violence is not accepted is then averaged over all of the women in a given country-specific birth cohort for each survey year. Age is not significant in this specification of the APC model (column 1 of Table 6).
A second check regarding the dependent variable refers to the “does not know” category. To date, these have been recoded as missing values. However, it can be argued that women who do not want to reveal their preferences may say that they have no opinion or do not know. As such, “does not know” may hide either a Yes or a No. In the Table 6, column 3 (column 2) estimates, the does not know answers are considered as (not) justifying wife-beating. The results are robust, as the age effects remain positive, significant and slightly concave, and the period effects remain statistically significant.
The second type of robustness check consists in restricting the sample used in the estimations (see column 4 of Table 6). As noted above, some cohorts are followed and observed over three successive surveys, while others are seen only twice or even only once. Restricting the sample to the cohorts appearing in three successive surveys confirms our previous findings, as the age effects remain significant, positive and slightly concave, while the cohort effects do not significantly predict attitudes to marital violence (column 4 of Table 6). The period effects are not statistically significant at conventional levels, although the p-values are only just above the 10% level.
TABLE 6: The Refusal of Marital Violence: Robustness Checks (1) (2) (3) (4) (5) Age effects Age 0.028 0.027*** 0.031*** 0.039*** 0.025*** (0.037) (0.009) (0.010) (0.011) (0.007) Age-squareda -0.067* -0.030*** -0.032*** -0.043*** -0.027*** (0.035) (0.008) (0.008) (0.010) (0.008) Period effects Mid-2000s 0.479*** 0.081** 0.069* 0.067b 0.083*** (0.154) (0.037) (0.041) (0.041) (0.011) Late 2000s 0.895*** 0.162** 0.142* 0.136c 0.168*** (0.320) (0.077) (0.083) (0.087) (0.021)
Cohort effects YES YES YES YES YES
Observations 524 524 524 345 524
Notes: See Table 5. a Age squared is divided by 100. b pvalue=0.103; c
pvalue=0.119. ∗ p < 0.10, ∗∗ p < 0.05, ∗∗∗ p < 0.01. Dependent variable in col. 1: number of circumstances for which wife beating is not justified; in col. 2: missing value recoded as not justified; in col. 3: missing value recoded as justified; col. 4 restricts the sample to the cohorts observed over all three surveys; col. 5 controls for birth-year dummies using 5-year intervals.
may be insignificant as we use single-year birth cohorts, making the analysis too fine. We could argue that women born in year n have similar characteristics to those born in n + 1, as they grew up in similar environments, were married on average in roughly the same year etc. We keep the same observation-level but now group cohorts in 5-year intervals (see Table 6, column 5). In other words, women born between 1960 and 1964 are compared to those born before 1955 whatever their exact birth year. The age and period effects are robust to this change in specification. The cohort effects remain statistically insignificant (not reported here).
5.2 Explaining the age effects
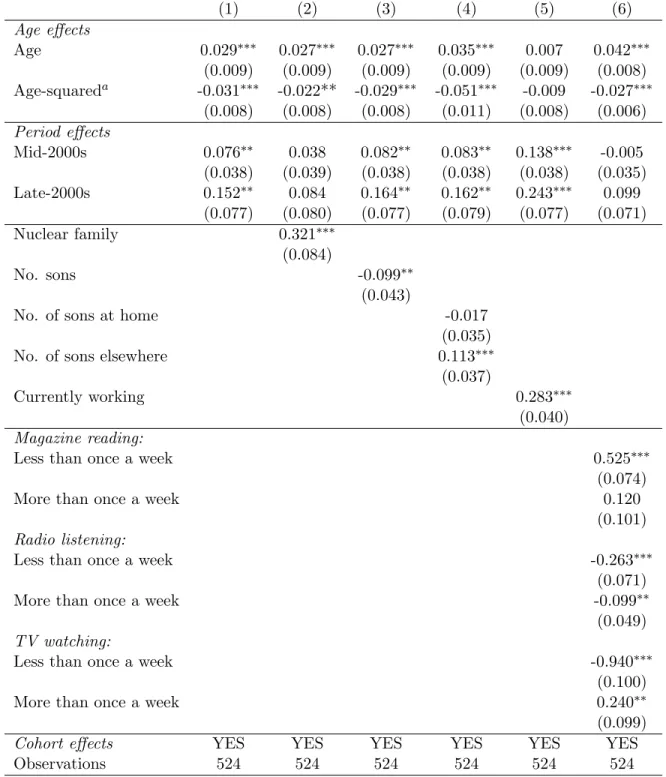
Our results suggest that women’s attitudes to marital violence change over the life cycle towards greater refusal. We explore three pathways in Table 7 to provide some insights into the mechanisms underlying these age effects.
Household composition Younger women may be more likely to accept wife beating due to their living arrangements and the people they live with. Women who are still living with their parents
TABLE 7: The Refusal of Marital Violence: explaining the age and period effects Dependent variable: Percentage of women saying wife-beating not justified
(1) (2) (3) (4) (5) (6) Age effects Age 0.029∗∗∗ 0.027∗∗∗ 0.027∗∗∗ 0.035∗∗∗ 0.007 0.042∗∗∗ (0.009) (0.009) (0.009) (0.009) (0.009) (0.008) Age-squareda -0.031∗∗∗ -0.022** -0.029∗∗∗ -0.051∗∗∗ -0.009 -0.027∗∗∗ (0.008) (0.008) (0.008) (0.011) (0.008) (0.006) Period effects Mid-2000s 0.076∗∗ 0.038 0.082∗∗ 0.083∗∗ 0.138∗∗∗ -0.005 (0.038) (0.039) (0.038) (0.038) (0.038) (0.035) Late-2000s 0.152∗∗ 0.084 0.164∗∗ 0.162∗∗ 0.243∗∗∗ 0.099 (0.077) (0.080) (0.077) (0.079) (0.077) (0.071) Nuclear family 0.321∗∗∗ (0.084) No. sons -0.099∗∗ (0.043)
No. of sons at home -0.017
(0.035)
No. of sons elsewhere 0.113∗∗∗
(0.037)
Currently working 0.283∗∗∗
(0.040) Magazine reading:
Less than once a week 0.525∗∗∗
(0.074)
More than once a week 0.120
(0.101) Radio listening:
Less than once a week -0.263∗∗∗
(0.071)
More than once a week -0.099∗∗
(0.049) TV watching:
Less than once a week -0.940∗∗∗
(0.100)
More than once a week 0.240∗∗
(0.099)
Cohort effects YES YES YES YES YES YES
Observations 524 524 524 524 524 524
Notes: a Age squared is divided by 100. ∗ p < 0.10, ∗∗ p < 0.05, ∗∗∗ p < 0.01. Robust standard errors in parentheses. Omitted categories: Ethiopia, early 2000s, being born in 1951. The estimated coefficients on the control variables are not shown. The same controls are used as in Table 5.
may not realize what marital violence means (as they are not confronted with it) and may be more influenced by their mothers, who are from the earlier cohorts that are more accepting of violence. We explore this by introducing the percentage of women by cohort and wave who live in a nuclear family where the woman is the household head or his spouse. Column 1 in Table 7 shows the benchmark estimation results (from Table 5, column 4) and column 2 then adds our new variable. The results suggest that household composition does play a role in violence refusal, as women living in a nuclear family are more likely to reject wife-beating. The age effects are stable in terms of sign and significance. The size of the coefficient is slightly reduced, suggesting that a small part of the age effect reflects household living arrangements. Note however that the period effects become insignificant here, suggesting that the prevalence of nuclear families has changed over time.
Parenthood experience and number of sons In columns 3 and 4, we test whether having had sons can help explain the age effects. Column 3 controls for the average total number of sons women have had, and column 4 for the number of sons still at home and the number of sons living elsewhere. The age effects remain positive, concave and significant in both cases, and increase in size in the last specification. The sign, significance and size of the period effects are robust in these two specifications.
Labor-Force status Teenage women are less likely to work, so that part of the age effect could reflect labor-force status. Controlling for the proportion of women currently working in column 5 reveals that work does indeed significantly predict attitudes, and moreover renders the age effects insignificant, suggesting that a large part of the age effects reflect labor-force status. Work not only helps women to obtain bargaining power as they bring money home, but also helps them to stay in touch with their peers and communicate regarding gender roles and status.
5.3 Explaining the period effects
Period effects represent changes over time that affect all age groups simultaneously. These changes can be related to shifts in the social, cultural or physical environment, and can be structural or conjunctural. They may be related to the business cycle but also to fundamental changes in society.
In our context, in addition to the household composition changes (shown above), another potential change is access to media and in particular television, where the contents of television programs may have influenced women’s views as suggested in Mahmud et al. (2012), even though their estimated effects are insignificant. In column 6 of Table 7, we include the frequency of watching TV, listening to radio and reading magazines or newspapers as additional explanatory variables. The period effects become smaller and insignificant, so that at least part of the increase in refusal over time seems to have been due to greater media access, and potentially via unobserved changes in program content.
6
Conclusion
This paper has used Demographic and Health Survey data to analyze female empowerment, as proxied by women’s beliefs about whether wife-beating is justified. We focus on five countries (Ethiopia, Malawi, Rwanda, Uganda and Zimbabwe) where at least three waves of DHS data are available and carry out pseudo-panel estimation. This reveals trends in women’s perceptions from one cohort to another, along with changes in perceptions over the life cycle. Following women over time allows us to correct for possible unobserved heterogeneity between birth cohorts.
We distinguish life-cycle from birth-cohort effects, and in an age-period-cohort decomposition it is the age effect which prevails. Over the five countries in our sample, women become increasingly less accepting of marital violence as they age. As such, empowerment is a dynamic process in women’s lives. These attitudinal changes over the life cycle are shown to be related to labor-force status and women’s family and household positions. Considering empowerment as fixed seems to be a mistake. Although background (e.g. education, relative status with respect to the husband, parents’ socio-economic characteristics compared to those of her parents-in-law, and assets at marriage) are powerful determinants of initial empowerment, this initial level evolves over the life course. This dynamic process means that current empowerment cannot be approximated by family background.
Societal changes have a considerable effect on the propensity to accept marital violence, as time dummies play an important explanatory role. Empowerment is then a dynamic process at
both the societal and the individual level. Societal modernization can take different forms affect-ing empowerment, such as media access, changes in attitudes and social norms, the awareness of other lifestyles via the internet, soap operas, etc. Given the increasing speed of adoption of new technologies, we can expect a concordant change in societal behaviors and attitudes. If individuals are now more willing to adopt societal changes than they were some decades ago, we can expect the accumulation of empowerment from one generation to another to rise at an increasing rate. Empowerment will appreciate either through societal change or intergenerational transmission. As daughters are influenced by their mothers, that mothers accept violence less over time and new mothers accept less than older mothers will both lead to rising empowerment. This paper has provided a picture of the situation in Eastern and Southern Africa during the 2000s, where we observe a sharp drop in the acceptance of marital violence, and thus rising female empowerment. We would therefore predict that future Demographic and Health Surveys will continue to reveal falling rates of justification of wife-beating over the next decades.
In addition to this dynamic process, our findings suggest that policies to curb the acceptance of wife-beating among the population should essentially target younger women.
References
[1] Alkire S, Meinzen-Dick R., Peterman A., Quisumbing A., Seymour G, and Vaz A., 2013, The Woman’s Empowerment in Agriculture Index. World Development 52, 71-91.
[2] Allendorf K., 2007, Do Women’s Land Rights Promote Empowerment and Child Health in Nepal? World Development 35 (11), 1975-1988.
[3] Amoakohene M.I., 2004, Violence against women in Ghana: a look at women’s perceptions and review of policy and social responses. Social Science and Medicine 59, 2373-2385.
[4] Anderson, S., Eswaran, M., 2009. What determines female autonomy? Evidence from Bangladesh. Journal of Development Economics 90(2), 179-191.
[5] Antman, F., McKenzie, D. 2007. Earnings Mobility and Measurement Error: A Pseudo-Panel Approach. Economic Development and Cultural Change 56(1), 125-161.
[6] Ashraf, N., Karlan, D., Yin, W., 2010. Female Empowerment: Impact of a Commitment Savings Product in the Philippines. World Development 38(3), 333-344.
[7] Beegle, K., Frankenberg, E., Thomas, D., 2001. Bargaining Power Within Couples and Use of Prenatal and Delivery Care in Indonesia. Studies in Family Planning 32(2), 130-146.
[8] Dargay, J.M., 2002. Determinants of car ownership in rural and urban areas: a pseudo-panel analysis. Transportation Research Part E 38, 351-366.
[9] Dargay, J.M., 2007. The effect of prices and income on car travel in the UK. Transportation Research Part A 41, 949-960.
[10] Deaton, A., 1985, Panel data from a time series of cross-sections, Journal of Econometrics, 30, 109-126.
[11] Duflo, 2011. Women’s empowerment and economic development. NBER Working Paper Series, 17702, December 2011.
[12] Duval-Hernandez, R., Orraca Romano, P., 2009. A Cohort Analysis of Labor Participation in Mexico, 1987-2009. IZA Discussion Paper No. 4371.
[13] Filmer, D., Pritchett, L., 2001. Estimating Wealth Effects without Expenditure Data - or Tears: An Application to Educational Enrollments in States of India, Demography 38(1), 115-132.
[14] Garikipati, S., 2008. The Impact of Lending to Women on Household Vulnerability and Women’s Empowerment: Evidence from India. World Development 36 (12), 2620-2642. [15] Glenn, N., 2005, Cohort Analysis. Thousand Oaks, CA: Sage Publications.
[16] Hendy, R., Sofer, C., 2009. Within Resource Allocation in Egyptian Couples: Do Distribution Factors Matter? Mimeo, January 2009.
[17] Hindin, M.J., 2003. Understanding women’s attitudes towards wife beating in Zimbabwe. Bul-letin of the World Health Organization 81, 501508.
[18] Lawoko, S., 2006. Factors associated with attitudes toward intimate partner violence. Violence and Victims, 21, 645-656.
[19] Lawoko, S., 2008. Predictors of attitudes toward intimate partner violence: a comparative study of men in Zambia and Kenya. Journal of Interpersonal Violence 23, 1056-1074.
[20] Li, L., Yount, K., 2009. Women’s ”Justification” of Domestic Violence in Egypt. Journal of Marriage and Family 71 (5), 1125-1140.
[21] Mahmud,S., Shah, N.M., Becker, S., 2012. Measurement of women’s empowerment in rural Bangladesh. World Development 40(3), 610-619.
[22] Malhotra A. and Schuler S.R., 2005, Women’s Empowerment as a Variable in International De-velopment. In Deepa Narayan (Ed), Measuring empowerment: cross-disciplinary perspectives (pp.71-88). Washington D.C., The World Bank.
[23] Oyediran K.A., Isiugo-Abanihe U., 2005. Perceptions of Nigerian women on domestic violence: Evidence from 2003 Nigeria Demographic and Health Survey. African Journal of Reproductive Health 9(2), 38-53.
[24] Rani M., Bonu S., Diop-Sidibe N., 2004. An empirical investigation of attitudes towards wife-beating among men and women in seven sub-Saharan African countries. African Journal of Reproductive Health 8(3), 116-136.
[25] Reggio, I., 2011. The Influence of the Mother’s Power on her Child’s Labor in Mexico. Journal of Development Economics 96(1), pages 95-105.
[26] Sobkoviak, R., Yount, K., Halim, N., 2012. Domestic Violence and Child Nutrition in Liberia. Social Science and Medicine 74, 103-111.
[27] Uthman O.A., Moradi T., Lawoko S., 2009. The independent contribution of individual-, neighborhood-, and country-level socioeconomic position on attitudes towards intimate partner violence against women in sub-Saharan Africa: a multilevel model of direct and moderating effects. Social Science and Medicine 68, 1801-1809.
[28] Warunsiri , S., Mcnown, R., 2010. The returns to Education in Thailand: A Pseudo-Panel Approach. World Development, 11, 1616-1625.
[29] World Health Organization, 2005, WHO multi-country study on women’s health and domestic violence against women: Summary report of initial results on prevalence, health outcomes and women’s responses. Geneva, Switzerland.
[30] Yang, Y., Land, K.C., 2008. Age-Period-Cohort Analysis of Repeated Cross-Section Surveys: Fixed or Random Effects? Sociological Methods and Research 36 (3), 297-326.
[31] Yount, K.M., 2005. Resources, family organization, and domestic violence against married women in Minya, Egypt. Journal of Marriage and Family 67, 579-596.
[32] Yount, K., DiGirolamo, A., Ramakrishnan, U., 2011. Impacts of Domestic Violence on Child Growth and Nutrition: A Conceptual Review of the Pathways of Influence. Social Science and Medicine 72, 1534-1554.
[33] Yount K.M., Halim N., Hynes M., Hillman E.R., 2011. Response effects to attitudinal questions about domestic violence against women: A comparative perspective. Social Science Research 40, 873-884.
TABLE A1: Estimated cohort coefficients (in models 2-4 of Table 5) Dependent variable: Proportion of women not justifying wife beating
AC model PC model APC model
Cohort effects
1951.birthyear (reference category)
1952.birthyear -0.050∗ (0.026) -0.059∗∗ (0.025) -0.065∗∗ (0.026) 1953.birthyear 0.000 (0.024) -0.025 (0.024) -0.029 (0.028) 1954.birthyear -0.033 (0.030) -0.075∗∗∗ (0.028) -0.079∗∗ (0.037) 1955.birthyear 0.011 (0.026) -0.053∗ (0.027) -0.050 (0.040) 1956.birthyear 0.029 (0.027) -0.059∗∗ (0.026) -0.046 (0.047) 1957.birthyear 0.054∗ (0.028) -0.052∗ (0.031) -0.035 (0.053) 1958.birthyear 0.058∗∗ (0.024) -0.062∗∗ (0.025) -0.045 (0.058) 1959.birthyear 0.065∗ (0.036) -0.070∗∗ (0.034) -0.052 (0.071) 1960.birthyear 0.075∗∗∗ (0.027) -0.075∗∗∗ (0.029) -0.056 (0.072) 1961.birthyear 0.128∗∗∗ (0.025) -0.051∗ (0.029) -0.018 (0.078) 1962.birthyear 0.145∗∗∗ (0.025) -0.051∗ (0.029) -0.016 (0.086) 1963.birthyear 0.147∗∗∗ (0.028) -0.068∗∗ (0.033) -0.028 (0.091) 1964.birthyear 0.143∗∗∗ (0.029) -0.087∗∗ (0.034) -0.045 (0.101) 1965.birthyear 0.171∗∗∗ (0.029) -0.077∗∗ (0.036) -0.034 (0.107) 1966.birthyear 0.184∗∗∗ (0.030) -0.083∗∗ (0.036) -0.033 (0.115) 1967.birthyear 0.198∗∗∗ (0.032) -0.086∗∗ (0.038) -0.033 (0.122) 1968.birthyear 0.191∗∗∗ (0.031) -0.116∗∗∗ (0.038) -0.056 (0.129) 1969.birthyear 0.236∗∗∗ (0.032) -0.086∗∗ (0.039) -0.024 (0.136) 1970.birthyear 0.245∗∗∗ (0.032) -0.099∗∗ (0.041) -0.031 (0.144) 1971.birthyear 0.254∗∗∗ (0.035) -0.115∗∗∗ (0.044) -0.036 (0.151) 1972.birthyear 0.286∗∗∗ (0.031) -0.099∗∗ (0.044) -0.018 (0.158) 1973.birthyear 0.304∗∗∗ (0.031) -0.106∗∗ (0.045) -0.014 (0.165) 1974.birthyear 0.323∗∗∗ (0.032) -0.105∗∗ (0.048) -0.010 (0.171) 1975.birthyear 0.322∗∗∗ (0.033) -0.130∗∗∗ (0.050) -0.026 (0.180) 1976.birthyear 0.337∗∗∗ (0.033) -0.136∗∗∗ (0.051) -0.024 (0.187) 1977.birthyear 0.366∗∗∗ (0.033) -0.129∗∗ (0.052) -0.010 (0.193) 1978.birthyear 0.382∗∗∗ (0.036) -0.135∗∗ (0.056) -0.009 (0.201) 1979.birthyear 0.395∗∗∗ (0.034) -0.145∗∗ (0.056) -0.010 (0.208) 1980.birthyear 0.403∗∗∗ (0.035) -0.159∗∗∗ (0.059) -0.017 (0.215) 1981.birthyear 0.429∗∗∗ (0.037) -0.152∗∗ (0.060) -0.005 (0.224) 1982.birthyear 0.455∗∗∗ (0.037) -0.146∗∗ (0.060) 0.006 (0.229) 1983.birthyear 0.467∗∗∗ (0.039) -0.154∗∗ (0.061) 0.003 (0.236) 1984.birthyear 0.486∗∗∗ (0.038) -0.156∗∗ (0.062) 0.008 (0.244) 1985.birthyear 0.509∗∗∗ (0.038) -0.157∗∗ (0.066) 0.017 (0.250) 1986.birthyear 0.516∗∗∗ (0.036) -0.167∗∗ (0.067) 0.010 (0.258) 1987.birthyear 0.540∗∗∗ (0.042) -0.165∗∗ (0.071) 0.019 (0.265) 1988.birthyear 0.540∗∗∗ (0.043) -0.184∗∗∗ (0.071) 0.005 (0.270) 1989.birthyear 0.568∗∗∗ (0.042) -0.179∗∗ (0.072) 0.020 (0.277) 1990.birthyear 0.594∗∗∗ (0.045) -0.174∗∗ (0.074) 0.032 (0.283) 1991.birthyear 0.593∗∗∗ (0.043) -0.193∗∗ (0.076) 0.018 (0.290) 1992.birthyear 0.608∗∗∗ (0.048) -0.198∗∗ (0.080) 0.017 (0.300) 1993.birthyear 0.624∗∗∗ (0.046) -0.201∗∗ (0.082) 0.019 (0.308) 1994.birthyear 0.634∗∗∗ (0.047) -0.212∗∗ (0.083) 0.015 (0.313) 1995.birthyear 0.669∗∗∗ (0.043) -0.203∗∗ (0.081) 0.034 (0.321) 1996.birthyear 0.692∗∗∗ (0.044) -0.197∗∗ (0.083) 0.044 (0.327)
Note: Robust standard errors in parentheses. ∗ p < 0.10, ∗∗ p < 0.05, ∗∗∗ p < 0.01.
.1
.2
.3
.4
.5
Beating not justified (%)
10 20 30 40 50 age 1941-1955 1956-1960 1961-1965 1966-1970 1971-1975 1976-1980 1981-1985 1986-1990 1991-1996
Raw life-cycle profiles: Ethiopia
.6
.7
.8
.9
Beating not justified (%)
10 20 30 40 50 age 1941-1955 1956-1960 1961-1965 1966-1970 1971-1975 1976-1980 1981-1985 1986-1990 1991-1996
Raw life-cycle profiles: Malawi
.3
.4
.5
.6
Beating not justified (%)
10 20 30 40 50 age 1941-1955 1956-1960 1961-1965 1966-1970 1971-1975 1976-1980 1981-1985 1986-1990 1991-1996
Raw life-cycle profiles: Rwanda
.2
.3
.4
.5
.6
Beating not justified (%)
10 20 30 40 50 age 1941-1955 1956-1960 1961-1965 1966-1970 1971-1975 1976-1980 1981-1985 1986-1990 1991-1996
Raw life-cycle profiles: Uganda
.3
.4
.5
.6
.7
Beating not justified (%)
10 20 30 40 50 age 1941-1955 1956-1960 1961-1965 1966-1970 1971-1975 1976-1980 1981-1985 1986-1990 1991-1996
Raw life-cycle profiles: Zimbabwe
.2
.4
.6
.8
Beating not justified (%)
10 20 30 40 50 Age Ethiopia Malawi Rwanda Uganda Zimbabwe Age effects
Figure II: Age effects
.2
.4
.6
.8
1
Beating not justified (%)
1950 1960 1970 1980 1990 2000 Birth year Ethiopia Malawi Rwanda Uganda Zimbabwe Cohort effects
Figure III:Cohort effects
-.2 0 .2 .4 .6 .8 1950 1960 1970 1980 1990 2000 birthyear ac pc apc Cohort Effects