Mammalian Genome 8, 29-36 (1997).
9 Springer-Verlag New York Inc. 1997
Cosmid-derived markers anchoring the bovine genetic map to the
physical map
L Ferretti, 1'7 B.G.D. Urquhart, z A. Eggen, a I. OIsaker, 4 B. Harlizius, s B. Castiglioni, 1 A. Mezzelani, 1 S. Solinas Toldo, 6 U. Thieven, s Y. Zhang, 1'7 A.L.G. Morgan, z V.M Teres, 2 M. Schwerin, a I. Martin-Burriel, 9
B.P. C h o w d h a r y , 1~ G. Erhardt, 11 I.J. Nijman, 13 E.P. Cribiu, a W. Barendse, 14 H. Leveziei, 3 R. Fries, 6'12 J.L. W i l l i a m s 2 IIDVGA-CNR, Milan, 20133, Italy
ZRoslin Institute (Edinburgh), Roslin, Midlothian, EH25 9PS, Scotland, UK
3Laboratoire de G6n6tique biochimique et de Cytog~n6tique, INRA-CRJ, Jouy-en-Josas, 78350, France
4Department of Morphology, Genetics and Aquatic Biology, Norwegian College of Veterinary Medicine, Oslo, 0033, Norway 5Department of Animal Breeding and Genetics, Hannover School of Veterinary Sciences, 30559 Hannover, Germany 6Swiss Federal Institute of Technology (ETH), Section Animal Breeding, Zurich, 8092, Switzerland
7Dipartimento di Genetica e Microbiologia, via Abbiategrasso 207, Universith degli Studi di Pavia, Pavia, 27100, Italy
8Department of Molecular Genetics, Research Centre of Animal Production, Rostock-Dummerstorf, Dummerstorf, 18196, Germany 9Laboratorio de Gen6tiea Bioquimica, Facultad de Veterinaria, Zaragoza, E-50013, Spain
1~ of Animal Breeding and Genetics, Swedish University of Agricultural Sciences, Uppsala, S-750 07, Sweden 11Justus-Liebig University, Department of Animal Breeding and Genetics, Giessen, 35390, Germany
aZLehrstuhl fuer Tierzucht, Technische Universitaet Muenchen-Weihenstephan, Freising, 85350, Germany
131nstitute of Infectious Diseases and Immunology, Faculty of Veterinary Medicine, Utrecht, 3508 TD, The Netherlands a4CSIRO Division of Tropical Animal Production, University of Queensland, Brisbane, 4072, Australia
Received: 1 July 1996 / Accepted: 13 September 1996
Abstract. The mapping strategy for the bovine genome described in this paper uses large insert clones as a tool for physical mapping and as a source of highly polymorphic microsatellites for genetic typing, and was one objective of the BovMap Project funded by the European Union (UE). Eight-three cosmid and phage clones were characterized and used to physically anchor the linkage groups defining all the bovine autosomes and the X Chromosome (Chr). By combining physical and genetic mapping, clones de- scribed in this paper have led to the identification of the linkage groups corresponding to Chr 9, 12, 16, and 25. In addition, an- chored loci from this study were used to orient the linkage groups corresponding to Chr 3, 7, 8, 9, 13, 16, 18, 19, and 28 as identified in previously published maps. Comparison of the estimated size of the physical and linkage maps suggests that the genetic length of the bovine genome may be around 4000 cM.
Introduction
Loci anchoring the physical and genetic maps of a species are a very important resource in the development of genome mapping strategies, both in building comprehensive maps and for the even- tual use of those maps. The benefits that are derived from inte- grated physical and linkage maps are numerous, as exemplified by the work on humans. Several aspects of the latest human map (Hudson et al. 1995) should be considered in establishing maps in other species. For example, it was developed with Sequence Tagged Sites (STSs; Olson et al. 1989) and incorporates most of the STSs and Expressed Sequence Tags (ESTs) previously placed on human linkage maps, the latter being crucial for the postitional cloning of disease genes. The amalgamation of physical and ge- netic maps allows a direct estimation of the distance between the ordered STSs, thereby providing the best coverage of the human genome so far.
Genome maps have been developed over the last few years for
Correspondence to: L. Ferretti at Pavia
several domesticated animal species (Bumstead and Palyga 1992; Fries et al. 1993; Barendse et al. 1994; Bishop et al. 1994; Levin et al. 1994; Archibald et al. 1995; Crawford et al. 1995), the bovine genome map being the most extensive, ranking fourth after the maps available for human, mouse, and rat. An 0pdated bovine linkage map currently comprises almost 800 markers, including 150 type I markers or genes (O'Brien et al. 1993), and is predomi- nantly made up of type I I S T S markers (W. Barendse, personal communication). The development of a physical map of the bovine genome has lagged behind mainly because of the difficulty in identifying individual bovine chromosomes. Initially, physical mapping data were based on conserved type I markers mapped to syntenic groups with somatic hybrid cell panels (Womack and Moll 1986; Fries et al. 1993). However, direct physical mapping approaches, like fluorescence in situ hybridization (FISH), have recently become available, so that now all the synteny groups have been assigned to chromosomes (Mezzelani et al. 1994; Masabanda et al. 1996). This has been achieved in most cases by combining the localization of large-insert clones to chromosomes by FISH, with the PCR amplification of microsatellites derived from the clones on hybrid cell lines.
Obtaining highly polymorphic markers from cosmid and phage clones is a very efficient way of placing markers on both the genetic and physical maps (Solinas Toldo et al. 1993; Ellegren et al. 1994a; Eggen and Fries 1995; Mezzelani et al. 1995; Thieven et al. 1996). This approach was adopted by the BovMap group as the tool of choice to provide physical anchorage to the developing bovine linkage map, and the results are presented in this paper. To achieve the mapping goals, it was crucial importance to use a common set of animals on which to type the markers, and the work was carried out using the International Bovine Reference Family Panel (IBRP; Barendse et al. 1996).
We report here on the physical mapping of 83 cosmid and phage-derived bovine microsatellite marker loci that were simul- taneously placed on the bovine linkage map. Thus, the correspon- dence between linkage groups, synteny groups, and chromosomes is directly confirmed. In addition, some linkage groups have been
oriented compared with previously published maps (Barendse et al. 1994; Bishop et al. 1994), so that now all the linkage groups are oriented with respect to the cytogenetic map.
Finally, the set of markers employed allows the estimation of the correspondence between the physical map and the genetic map; this helps to validate the estimates of genome size inferred from chiasmata counts. Estimating genome size has gained a special importance after the finding that the mouse and the porcine ge- nomes are about 2000 centiMorgans (cM) long, which is signifi- cantly shorter than that of human despite having the same physical size (Davisson and Roderick 1989; Ellegren et al. 1994b). Our data suggest the converse may be true in cattle, where the length of the genome may be close to that of human, and possibly larger.
Materials and methods
Isolation and physical mapping of cosmids and phages.
Cosmids and phage-containing microsatellites were identified with poly d(AC) probes. For the majority of clones (that is, IDVGA and ETH clones), QFQ-banded chromosome preparations were subjected to competitive in sitn suppression hybridization (Lichter et al. 1990) and then hybridzed with biotinylated probes. FITC signal detection was performed with a computer- controlled CCD camera device (Photometrics, Tucson, Ariz.), as described by Solinas Toldo et al. (1993) and Mezzelani et al. (1995). Chromosomal band assignments were obtained by determining the fractional length (FLcen) with respect to the proximal border of the chromosome and su- perimposing the value to the idiogram of the standard chromosomes (Popescu et al. 1996). Details of the physical localization for the other clones can be found in the references in Table 1. Sequencing and devel- opment of the microsatellite markers was performed at a later stage, when the chromosomal location of clones was known. From nearly 200 large insert clones that were physically mapped, 83 were eventually selected and the embedded microsatellite regions sequenced either by subcloning or directly from the cosmid (Ferretti et al. 1994) or phage templates (Thieven et al. 1995), for use as genetic markers.Markers andpolymorphisms.
For all but five loci, polymorphism in the length of the dinucleotide microsatellite repeat was used for genetic map- ping by analysis of the PCR products generated with the primers described in Table 1 on denaturing acrylamide gel electrophoresis. For five loci that showed low heterozygosity, mapping was by single strand conformational polymorphisms (SSCP) described by Williams and associates (1996b). Table 1 summarizes the details of all the markers that are part of the BovMap database maintained at INRA, which is accessible on the Internet at the address: http://locus.jouy.inra.fr/cgi-bin/bovmap/. A database of D numbers, identifying the anonymous DNA loci, is maintained by R. Fries.Typing and linkage analysis.
A common set of 15 full sib families (330 animals), which are part of the International Bovine Reference Family Panel (IBRP; Barendse et al. 1996), was used for the genetic mapping of the markers. The data are collated in the Cattle Genotypic Database (CGD), managed by W. Barendse. Intervals between markers were estimated by two-point linkage analysis with the CRI-MAP program (Green et al. 1990). The lod scores and recombination fraction data can be obtained from [email protected].Results
Isolation and mapping of microsatellites. The goal of the project
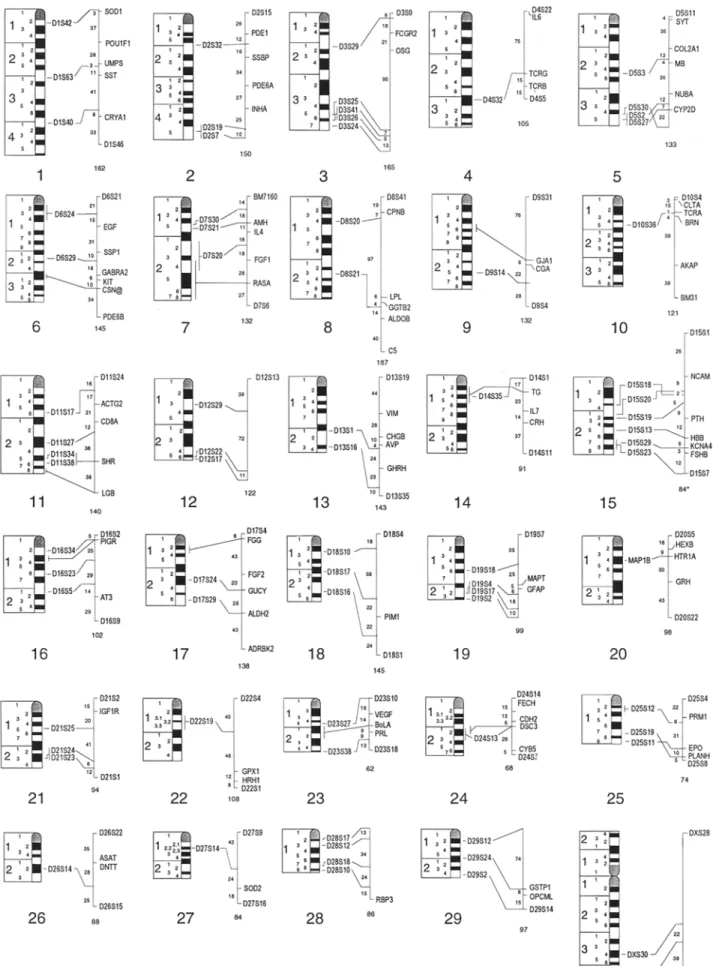
was to map large insert clones harboring microsatellite sequences by FISH and to use the microsateUite regions to locate the clones on the genetic linkage map. In the course of the project, 185 cosmid and 10 lambda phage clones were placed on chromosomes by FISH, and microsatellite markers were developed for a subset of 83 of these clones that were suitable distributed across the bovine karyotype. These markers are shown in Fig. 1 and Table 1. Fifteen chromosomes have at least three markers, six chromo- somes have two markers, and nine have a single marker. Of thechromosomes with only one marker, only Chr 22 had additional FISH-mapped clones at positions distinct from the one that was genetically mapped, but for which it was not possible to develop a polymorphic marker. On the remaining chromosomes, the addi- tional clones available mapped to the same chromosomal region as the previously genetically mapped marker.
The distribution of the clones described in Fig. 1 is not biased towards the telomeric regions of the chromosomes. However, the overall distribution of the complete set of FISH-mapped clones, that is, the 185 cosmids and 10 lambda phages, suggests a ten- dency for microsatellite sequences to be more frequent towards the telomeres (54 clones mapped to telomeric or subtelomeric bands out of 195); in addition, more microsatellite-containing clones were obtained from Chrs 15, 16, and 19 than expected compared with other chromosomes (data not shown).
Linkage.
The STS markers developed from the large insert clones (Table 1) were placed on the linkage map by typing the animals of the IBRP panel. The results are shown in Fig. 1 (N.B., some markers for Chr 15 are not shown, for clarity). Physical and link- age mapping of the clones has been essential to define the orien- tation of various linkage groups in relation to chromosomes in the continuous process of updating the bovine genetic map. Thus, the linkage groups for the following chromosomes were anchored and in some cases oriented by use of the cosmids and the embedded microsatellite markers described in this paper: Chr 3, D3S24; Chr4, D4S32; Chr 7,
D7S20;
Chr 8,D8S20; Chr 9, D9S14;
Chr 10,D10S36; Chr 12,
D12S17; Chr 13, D13S16; Chr 16,
D16S5
andD16S23; Chr 18, D18S10; Chr 19, D19S4
andD19S18; Chr 28,
D28S10.
The physical assignment of markerD27S14
to 27q23 confirmed the recent identification of the last unassigned linkage group (Masabanda et al. 1996). Additionally, cosmid MAP1B, 20q14-q15, confirmed the orientation of the linkage group for Chr 20. Finally, the following markers provided the first physical as- signments that anchored the linkage groups corresponding to Chr9, D9S14;
Chr 12, D12S17; Chr 16,D16S5; Chr 29, D29S2,
for- merly Chr 25, andD25S2
(ISCNDA 1989, 1990; Popescu et al. 1996).Comparison of the physical and genetic maps. The
markers de- fined intervals on 20 chromosomes as illustrated in Fig. 1. Each chromosome is represented with the idiogram of the corresponding G-banding pattern, in accordance to a recently agreed update of the ISCNDA standard (Popescu et al. 1996). All the idiograms are drawn to scale. The markers described in this study are indicated by the D-numbers flanking the idiograms, with the corresponding chromosomal assignments. The location of the markers on the genetic map is shown at the right of the idiograms, with the linkage group that defines each chromosome. Distances are in cM from the physically anchored microsatellite markers to the closest genes to bridge the gaps between the markers on the genetic map. Addi- tional markers defining the ends of the linkage groups are in- cluded, where necessary. Thus, the genetic distances between the markers are obtained by adding the distances that separate all the markers for each chromsome. The complete linkage map will be published elsewhere (Barendse et al., 1996).The intervals defined by the FISH-mapped anchored loci were used to evaluate the alignment of the physical and the genetic map. With respect to physical mapping, the distances between markers were evaluated by measuring the length spanning hybridization peaks, defined by cytogenetic band assignments (Lichter et al. 1990). In the case of assignments to more than one band, the central position was taken. The length of the interval was estimated as a percentage of the total karyotype. Markers separated by less than 1% of the genome were not considered. No data are presented for Chrs 13 or X, which only have two markers mapped at adjoin- ing positions. In total, intervals could be considered for 20 chro-
L. Ferretti et al.: Bovine genetic and physical maps
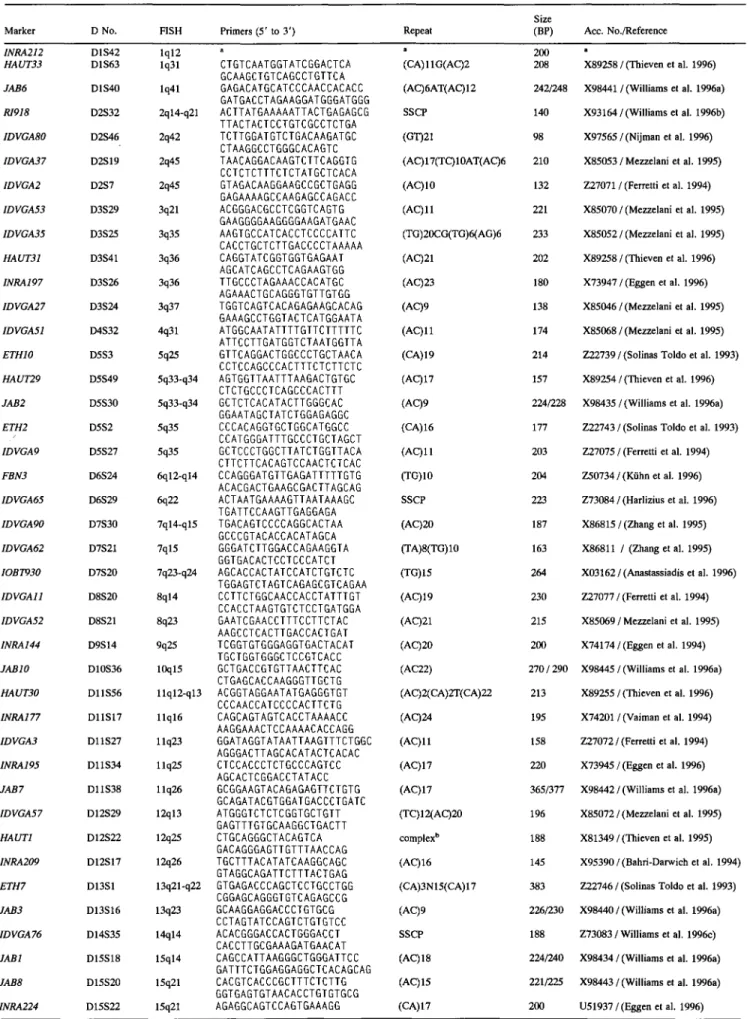
Table 1. Markers information
31
Size
Marker D No. FISH Primers (5' to 3') Repeat (BP) Acc. No./Reference
INRA212 D1S42 lq12 HAUT33 D1S63 lq31 JAB6 D1S40 lq41 RI918 D2S32 2q14-q21 IDVGA80 D2S46 2q42 IDVGA37 D2S19 2q45 IDVGA2 D2S7 2q45 IDVGA53 D3S29 3q21 1DVGA35 D3S25 3q35 HAUT31 D3S41 3q36 INRA197 D3S26 3q36 1DVGA27 D3S24 3q37 IDVGA51 D4S32 4q31 ETHIO D5S3 5q25 HAUT29 D5S49 5q33-q34 JAB2 D5S30 5q33-q34 ETH2 D5S2 5q35 IDVGA9 D5S27 5q35 FBN3 D6S24 6q12-q14 IDVGA65 D6S29 6q22 IDVGA90 D7S30 7q14-q15 IDVGA62 D7S21 7q15 IOB1930 D7S20 7q23-q24 IDVGA11 D8S20 8q14 1DVGA52 D8S21 8q23 1NRA144 D9S14 9q25 JABIO D10S36 10q15 HAUT30 D11S56 1 lq12-q13 INRA177 DllS17 llq16 IDVGA3 D l l $27 11 q23 INRA195 DllS34 11q25 JAB7 DllS38 11q26 IDVGA57 D12S29 12q13 HAUT1 D12S22 12q25 INRA209 D12S17 12q26 ETH7 D13S1 13q21-q22 JAB3 D13S16 13q23 1DVGA76 D14S35 14q14 JAB1 D15S18 15q14 JAB8 D15S20 15q21 INRA224 D15S22 15q21 " " 200
CTGTCAATGGTATC GGACTCA (CA) 11G(AC)2 208
GCAAGCTGTCAGCCTGTTCA GAGACATGCATCCCAACCACACC (AC)6AT(AC)12 242/248 GATGACCTAGAAGGATGGGATGGG ACTTATGAAAAATTACTGAGAGCG SSCP 140 TTACTACTCCTGTCGCCTCTGA TCTTGGATGTCTGACAAGATGC (GT)21 98 CTAAGGCCTGGGCACAGTC
TAACAGGACAAGTCTTCAGGTG (AC) 17(TC) IOAT(AC)6 210 CCTCTCTTTCTCTATGCTCACA GTAGACAAGGAAGCCGCTGAGG (AC) 10 132 GAGAAAAGCCAAGAGCCAGACC ACGGGACGCCTCGGTCAGTG (AC)ll 221 GAAGGGGAAGGGGAAGATGAAC AAGTGCCATCACCTCCCCATTC (TG)2OCG(TG)6(AG)6 233 CACCTGCTCTTGACCCCTAAAAA CAGGTATCGGTGGTGAGAAT (AC)21 202 AGCATCAGCCTCAGAAGTGG TTGCCCTAGAAACCACATGC (AC)23 180 AGAAACTGCAGGGTGTTGTGG TGGTCAGTCACAGAGAAGCACAG (AC)9 138 GAAAGCCTGGTACTCATGGAATA ATGGCAATATTTTGTTCTTTTTC (AC)ll 174 ATTCCTTGATGGTCTAATGGTTA
GTTCAGGACTGGC CCTGCTAACA (CA)19 214
CCTCCAGCCCACTTTCTCTTCTC AGTGGTTAATTTAAGACTGTGC (AC)17 157 CTCTGCCCTCAGCCCACTTT GCTCTCACATACTTGGGCAC (AC)9 224/228 GGAATAGCTATCTGGAGAGGC CCCACAGGTGCTGGCATGGCC (CA) 16 177 CCATGGGATTTGCCCTGCTAGCT GCTCCCTGGCTTATCTGGTTACA (AC)II 203 CTTCTTCACAGTCCAACTCTCAC CCAGGGATGTTGAGATTTTTGTG (TG)10 204 ACACGACTGAAGCGACTTAGCAG ACTAATGAAAAGTTAATAAAGC SSCP 223 TGATTCCAAGTTGAGGAGA TGACAGTCCCCAGGCACTAA (AC)20 187 GCCCGTACACCACATAGCA
GGGATCTTGGAC CAGAAGGTA (TA)8(TG)10 163
GGTGACACTCCTCCCATCT AGCACCACTATCCATCTGTCTC (TG)15 264 TGGAGTCTAGTCAGAGC GTCAGAA CCTTCTGGCAACCACCTATTTGT (AC) 19 230 CCACCTAAGTGTCTCCTGATGGA GAATCGAACCTTTCCTTCTAC (AC)21 215 AAGCCTCACTTGACCACTGAT TCGGTGTGGGAGGTGACTACAT (AC)20 200 TGCTGGTGGGCTCCGTCACC GCTGACCGTGTTAACTTCAC (AC22) 270 / 290 CTGAGCACCAAGGGTTGCTG ACGGTAGGAATATGAGGGTGT (AC)2(CA)2T(CA)22 213 CCCAACCATCCCCACTTCTG CAGCAGTAGTCACCTAAAACC (AC)24 195 AAGGAAACTCCAAAACACCAGG GGATAGGTATAATTAAGTTTCTGGC (AC)ll 158 AGGGACTTAGCACATACTCACAC CTCCACCCTCTGCCCAGTCC (AC)17 220 AGCACTCGGACCTATACC GCGGAAGTACAGAGAGTTCTGTG (AC)17 365/377 GCAGATACGTGGATGACCCTGATC ATGGGTCTCTCGGTGCTGTT (TC)12(AC)20 196 GAGTTTGTGCAAGGCTGACTT CTGCAGGGCTACAGTCA complex b 188 GACAGGGAGTTGTTTAACCAG TGCTTTACATATCAAGGCAGC (AC) 16 145 GTAGGCAGATTCTTTACTGAG GTGAGACCCAGCTCCTGCCTGG (CA)3N15(CA)17 383 CGGAGCAGGGTGTCAGAGCCG GCAAGGAGGACCCTGTGCG (AC)9 226/230 CCTAGTATCCAGTCTGTGTCC ACACGGGACCACTGGGACCT SSCP 188 CACCTTGCGAAAGATGAACAT
CAGC CATTAAGGGCTGGGATTCC (AC) I8 224/240
GATTTCTGGAGGAGGCTCACAGCAG CACGTCACCCGCTTTCTCTTG (AC) 15 221/225 GGTGAGTGTAACACCTGTGTGCG AGAGGCAGTCCAGTGAAAGG (CA) 17 200 a X89258 / (Thieven et al. 1996) X98441 / (Williams et al. 1996a) X93164/(Williams et al. 1996b) X97565 / (Nijman et al. 1996) X85053 / Mezzelani et al. 1995) Z27071 / (Ferretti et al. 1994) X85070 / (Mezzelani et al. 1995) X85052 / (Mezzelani et al. 1995) X89258 / (Thieven et al. 1996) X73947 / (Eggen et al, 1996) X85046 / (Mezzelani et al. 1995) X85068 / (Mezzelani et al. 1995) 7-,22739 / (Solinas Toldo et al. 1993) X89254 / (Thieven et al. 1996) X98435 / (Williams et al. 1996a) Z22743 / (Solinas Toldo et al. 1993) Z27075 / (Ferretti et al. 1994) Z50734/(Kfihn et al. 1996) Z73084 / (Harlizius et al. 1996) X86815 / (Zhang et al, 1995) X86811 / (Zhang et al. 1995) X03162 / (Anastassiadis et al. 1996) Z27077 / (Ferretti et al. 1994) X85069/Mezzelani et al. 1995) X74174/(Eggen et al. 1994) X98445 / (Williams et al. 1996a) X89255 /(Thieven et al. 1996) X74201 /(Vaiman et al. 1994) Z27072 / (Ferretti et al. 1994) X73945 / (Eggen et al. 1996) X98442 / (Williams et al. 1996a) X85072 / (Mezzelani et al. 1995) X81349 / (Thieven et al. 1995) X95390 / (Bahri-Darwich et al. 1994) Z22746 / (Solinas Toldo et al. 1993) X98440 / (Williams et al. 1996a) Z73083 / Williams et al. 1996c) X98434/(Williams et al. 1996a) X98443 / (Williams et al. 1996a) U51937 / (Eggen et al. 1996)
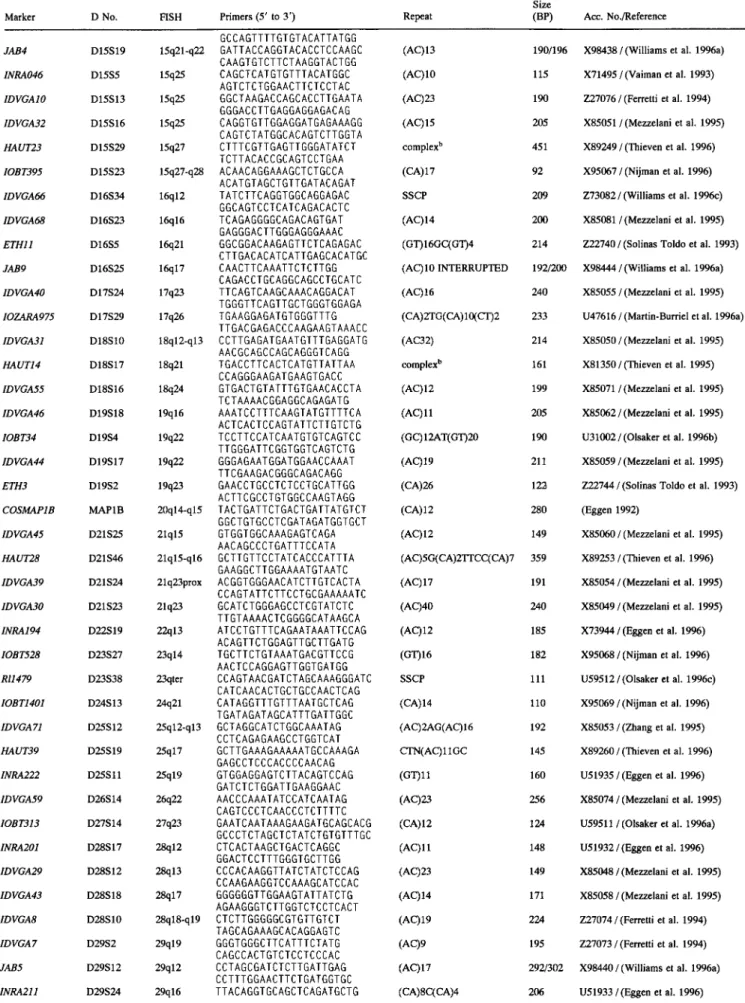
Table 1. Continued.
Size
Marker D No. FISH Primers (5' to 3') Repeat (BP) Ace. No./Referenee
JAB4 D15S19 15q21-q22 INRA046 D15S5 15q25 IDVGAIO D15S13 15q25 IDVGA32 D15S16 15q25 HAUT23 D15S29 15q27 10BT395 D15S23 15q27-q28 IDVGA66 D16S34 16q12 IDVGA68 D16S23 16q16 ETHll D16S5 16q21 JAB9 D16S25 16q17 1DVGA40 D17S24 17q23 IOZARA975 D17S29 17q26 IDVGA31 D18S10 18q12-q13 HAUT14 D18S17 18q21 IDVGA55 D18S16 18q24 IDVGA46 D19S18 19q16 IOBT34 D19S4 19q22 IDVGA44 D19S17 19q22 ETH3 D19S2 19q23 COSMAP1B MAPIB 20q14-q15 1DVGA45 D21S25 21q15 HAUT28 D21S46 21q15-q16 IDVGA39 D21S24 21q23prox IDVGA30 D21S23 21q23 INRA194 D22S19 22q13 IOBT528 D23S27 23q14 R11479 D23S38 23qter 10BT1401 D24S 13 24q21 IDVGA71 D25S12 25q12-q13 HAUT39 D25S19 25q17 INRA222 D25S11 25q19 IDVGA59 D26S14 26q22 10BT313 D27S14 27q23 INRA201 D28S17 28q12 IDVGA29 D28S12 28q13 IDVGA43 D28S18 28q17 IDVGA8 D28S10 28q18-q19 IDVGA7 D29S2 29q19 JAB5 D29S12 29q12 INRA211 D29S24 29q16 GCCAGTTTTGTGTACATTATGG GATTACCAGGTACACCTCCAAGC (AC)13 19~196 CAAGTGTCTTCTAAGGTACTGG CAGCTCATGTGTTTACATGGC (AC)IO 115 AGTCTCTGGAACTTCTCCTAC GGCTAAGACCAGCACCTTGAATA (AC)23 190 GGGACCTTGAGGAGGAGACAG CAGGTGTTGGAGGATGAGAAAGG (AC)15 205 CAGTCTATGGCACAGTCTTGGTA CTTTCGTTGAGTTGGGATATCT complex b 451 TCTTACACCGCAGTCCTGAA ACAACAGGAAAGCTCTGCCA (CA)17 92 ACATGTAGCTGTTGATACAGAT TATCTTCAGGTGGCAGGAGAC SSC~' 209 GGCAGTCCTCATCAGACACTC TCAGAGGGGCAGACAGTGAT (AC)I4 200 GAGGGACTTGGGAGGGAAAC GGCGGACAAGAGTTCTCAGAGAC (GT)I6GC(GT)4 214 CTTGACACATCATTGAGCACATGC CAACTTCAAATTCTCTTGG (AC)IOINTERRUPTED 192/200 CAGACCTGCAGGCAGCCTGCATC TTCAGTCAAGCAAACAGGACAT (AC)16 240 TGGGTTCAGTTGCTGGGTGGAGA TGAAGGAGATGTGGGTTTG (CA)2TG(CA)I~CT)2 233 TTGACGAGACCCAAGAAGTAAACC CCTTGAGATGAATGTTTGAGGATG (AC32) 214 AACGCAGCCAGCAGGGTCAGG TGACCTTCACTCATGTTATTAA complex b 161 CCAGGGAAGATGAAGTGACC GTGACTGTATTTGTGAACACCTA (AC)12 199 TCTAAAACGGAGGCAGAGATG AAATCCTTTCAAGTATGTTTTCA (AC)ll 205 ACTCACTCCAGTATTCTTGTCTG TCCTTCCATCAATGTGTCAGTCC (GC)12AT(GT)20 190 TTGGGATTCGGTGGTCAGTCTG GGGAGAATGGATGGAACCAAAT (AC)19 211 TTCGAAGACGGGCAGACAGG GAACCTGCCTCTCCTGCATTGG (CA)26 122 ACTTCGCCTGTGGCCAAGTAGG TACTGATTCTGACTGATTATGTCT (CA)12 280 GGCTGTGCCTCGATAGATGGTGCT GTGGTGGCAAAGAGTCAGA (AC)12 149 AACAGCCCTGATTTCCATA GCTTGTTCCTATCACCCATTTA (AC)5G(CA)2TrCC(CA)7 359 GAAGGCTTGGAAAATGTAATC ACGGTGGGAACATCTTGTCACTA (AC)17 191 CCAGTATTCTTCCTGCGAAAAATC GCATCTGGGAGCCTCGTATCTC (AC)40 240 TTGTAAAACTCGGGGCATAAGCA ATCCTGTTTCAGAATAAATTCCAG (AC)12 185 ACAGTTCTGGAGTTGCTTGATG TGCTTCTGTAAATGACGTTCCG (GT)16 182 AACTCCAGGAGTTGGTGATGG CCAGTAACGATCTAGCAAAGGGATC SSCP 111 CATCAACACTGCTGCCAACTCAG CATAGGTTTGTTTAATGCTCAG (CA)14 110 TGATAGATAGCATTTGATTGGC GCTAGGCATCTGGCAAATAG (AC)2AG(AC)16 192 CCTCAGAGAAGCCTGGTCAT GCTTGAAAGAAAAATGCCAAAGA CTN(AC)11GC 145 GAGCCTCCCACCCCAACAG GTGGAGGAGTCTTACAGTCCAG (GT)ll 160 GATCTCTGGATTGAAGGAAC AACCCAAATATCCATCAATAG (AC)23 256 CAGTCCCTCAACCCTCTTTTC GAATCAATAAAGAAGATGCAGCACG (CA)12 124 GCCCTCTAGCTCTATCTGTGTTTGC CTCACTAAGCTGACTCAGGC (AC)II 148 GGACTCCTTTGGGTGCTTGG CCCACAAGGTTATCTATCTCCAG (AC)23 149 CCAAGAAGGTCCAAAGCATCCAC GGGGGGTTGGAAGTATTATCTG (AC)14 171 AGAAGGGTCTTGGTCTCCTCACT CTCTTGGGGGCGTGTTGTCT (AC)19 224 TAGCAGAAAGCACAGGAGTC GGGTGGGCTTCATTTCTATG (AC)9 195 CAGCCACTGTCTCCTCCCAC CCTAGCGATCTCTTGATTGAG (AC)17 292/302 CCTTTGGAACTTCTGATGGTGC TTACAGGTGCAGCTCAGATGCTG (CA)8C(CA)4 206
X98438 / (Williams et al. 1996a) X71495 / (Vaiman et al. 1993) Z27076 / (Ferretti et al. 1994) X85051 / (Mezzelani et al. 1995) X89249 / (Thieven et al. 1996) X95067 / (Nijman et al. 1996) Z73082 / (Williams et al. 1996e) X85081 / (Mezzelani et al. 1995) Z22740 / (Solinas Toldo et al. 1993) X98444/(Williams et al. 1996a) X85055/(Mezzelani et al. 1995) U47616 / (Martin-Burriel et al. 1996a) X85050 / (Mezzelani et al. 1995) X81350 / (Thieven et al. 1995) X85071/(Mezzelani et al. 1995) X85062 / (Mezzelani et al. 1995) U31002 / (Olsaker et al. 1996b) X85059 / (Mezzelani et al. 1995) Z22744 / (Solinas Toldo et al. 1993) (Eggen 1992) X85060 / (Mezzelani et al. 1995) X89253 / (Thieven et al. 1996) X85054 / (Mezzelani et al. 1995) X85049/(Mezzelani et al. 1995) X73944 / (Eggen et al. 1996) X95068 / (Nijman et al. 1996) U59512 / (Olsaker et al. 1996c) X95069 / (Nijman et al. 1996) X85053 / (Zhang et al. 1995) X89260 / (Thieven et al. 1996) U51935 / (Eggen et al. 1996) X85074 / (Mezzelani et al. 1995) U59511 /(Olsaker et al. 1996a) U51932 / (Eggen et al. 1996) X85048 / (Mezzelani et al. 1995) X85058 / (Mezzelani et al. 1995) Z27074 / (Ferretti et al. 1994) Z27073 / (Ferretti et al. 1994) X98440 / (Williams et al. 1996a) U51933/(Eggen et al. 1996)
L. Ferretti et al.: Bovine genetic and physical maps
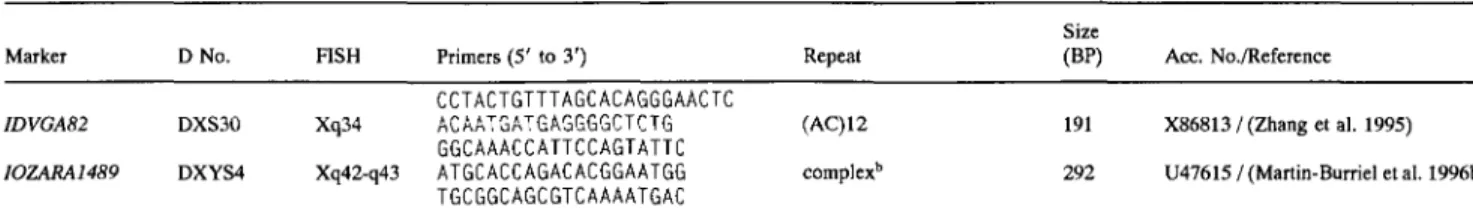
Table 1. Continued.
33
Marker D No. FISH Primers (5' to 3')
Size
Repeat (BP) Acc. No./Reference
IDVGA82 DXS30 Xq34 IOZARA1489 DXYS4 Xq42-q43 CCTACTGTTTAGCACAGGGAACTC ACAATGATGAGGGGCTCTG GGCAAACCATTCCAGTATTC ATGCACCAGACACGGAATGG TGCGGCAGCGTCAAAATGAC (AC)12 191 complex b 292 X86813/(Zhang et al. 1995) U47615 / (Martin-Burriel et al. 1996b)
Symbols for anonymous DNA loci: 1DVGA, Istituto per la Difesa e la Valorizzazione del Germoplasma Animale, CNR, Italy; JAB and RI, Roslin Institute (Edinburgh), Roslin, Scotland; INRA, Institute National pour la Recherche Agronomique, Jouy en Josas, France; HAUT, Department of Animal Breeding and Genetics, Hannover School of Veterinary Sciences, Hannover, Germany; ETH, Swiss Federal Institute of Technology, Zurich, Switzerland; IOZARA, Norwegian College of Veterinary Medi- cine, Oslo, and Facultad de Veterinaria, Zaragoza, Spain; IOBT, Norwegian College of Veterinary Medicine, Oslo, Norway.
aThe marker is available upon request. Contact A. Eggen.
t'The complete repeats are as follows: HAUT1, (TG)3A(GT)5A(TG)5A(GT)5A(TG) 10(CG)2; HAUT23, (AC)6CAGT(AC)6CAGTrCAGGA(AC)9CCCAGTr(CA)17C GNGTTCAGG(AC) 13CCCAGTT(CA) 17CGN GTTCAGG(AC) 18CCCAGTTCT ( C A ) 14CGN G T T C A G G ( A C ) 18GN G T T C A G G ( A C ) 17; HAUT14, (AT)2(GT)15G(GT)9G(GT)13C(TG)2; IOZARA1489, (CT)5GA(GT) 2(CF)5(CA) 12CT(CA)4.
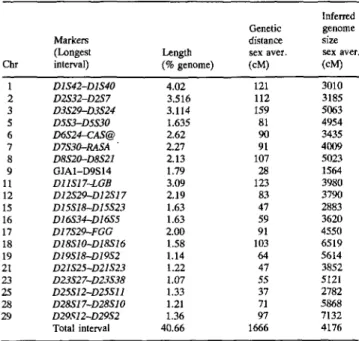
mosomes, covering 40.6% of the whole genome (Table 2). In some cases, the size of the interval used was increased by including genes for which physical and linkage mapping data were available. Thus, on Chr 6 the interval was between D6S24 and CAS@ (GaP lagher et al. 1994), on Chr 7 between D7S30 and RASA (Eggen et al. 1992), on Chr 11 between D l l S 5 6 and LGB (Hayes and Petit 1993), and on Chr 17 between D17S29 and FGG (Johnson et al. 1993). An interval could be defined on Chr 9 despite the presence of only one cosmid-derived, physically anchored locus: connexin 43 (GJA1) was used as a second marker, which was recently mapped by FISH to 9q15-q16 (Castiglioni et al. 1996).
The total genetic distance covered by the intervals between markers in 1666 cM, giving an estimate for the whole genome of 4176 cM, which is much larger than the size of 2800 cM predi- cated on the basis of chiasmata counts (Jagiello et al. 1974; Logue and Harvey 1978) and larger still than 3540 cM suggested in the current version of the CGD linkage map from the distribution of markers (Barendse et al. 1996). Table 2 presents estimates of ge- nome size obtained from the evaluation of individual intervals. There is great variation in the estimated values, which is reflected in a mean of 4176 cM with a standard error of 1360 cM. However, it is interesting to inspect the data for some of the intervals. D3S29 and D3S24 span 3.10% of the genome, or more significantly about 66% of Chr 3, which, when extrapolated, gives an estimate of 5063 cM for the total genome. From other chromosomes that are well covered by the anchored markers, generally high values are ob- tained for the inferred genome size: Chr 18 (61.5%) 6519 cM; Chr 28 and Chr 29 (both 70%), 5868 cM and 7132 cM respectively. On the other hand, the intervals for Chr 1 (68.5% coverage) and for Chr 25 (67.5%) suggest a size for the genome that is much below the average and close to the estimate based on chiasmata counts.
Discussion
In this study cosmid and phage clones have been used as a tool to add to the developing linkage map of the bovine genome by pro- viding cytogenetically mapped anchored loci. Microsatellite mark- ers were derived from 74 cosmid and 9 phage clones and have been placed on the genetic map, while the parent clones have been localized on the bovine chromosomes by FISH. All 30 bovine chromosomes have at least one microsatellite marker mapped by FISH.
The use of microsatellite markers derived from cosmid and phage clones as anchor loci for the genetic map has highlighted the usefulness of combining genetic and physical mapping. Compared with the first published linkage map (Barendse et al. 1994), the set of markers described here allowed the anchoring and orientation of the linkage groups corresponding to Chrs 3, 4, 7, 8, 9, 10, 12, 13, 16, 18, 19, and Chr 28 and led to the identification of four unas- signed linkage groups, corresponding to Chrs 9, 12, 16, and
29, formerly Chr 25 (ISCNDA 1989, 1990; Popescu et al. 1996). The linkage group for Chr 27 with marker D27S14, 27q23, was assigned and orientated by a single appropriately placed marker, confirming the recent identification of the last unassigned linkage group (Masabanda et al., 1996). Similarly, cosmid MAP1B, 20q14-q15, confirmed the orientation of the linkage group for Chr 20.
Another interesting feature of cytogenetically mapped loci, an- chored to the linkage map by means of highly polymorphic STS markers, is that they allow an evaluation of the alignment between the physical map and genetic maps (Bray-Ward et al. 1996). This, in turn, gives an estimate of the rate of genetic recombination and, ultimately, of genome size.
In this study, 83 markers defined intervals on 20 chromosomes, representing 40.6% of the total karyotype, and a genetic distance of 1666 cM. An estimate of 4176 cM was thus obtained for the whole genome, which is greatly in excess of the 2800 cM predicted by chiasmata counts (Jagiello et al. 1974; Logue and Harvey 1978). Our data would also suggest a larger size than the 3540 cM proposed from data in the present bovine linkage map, based on the Cattle Genotype Database (CGD; Barendse et al. 1996). How- ever, care must be taken when considering these estimates as they have large errors associated with them and do overlap at the ex- tremes of the range. Typing errors inflate the estimate of genetic length, particularly considering the relatively low number of mark- ers presented in this study. Nevertheless, our finding is of special interest in light of the results published in a similar study on the porcine genome (Ellegren et al. 1994b). Ellegren and colleagues estimated a genome size of about 2000 cM with a set of markers covering 37.5% of the pig karyotype, a figure much closer to mouse, 1600 cM, than to human, 3800--4000 cM, despite a very similar length of 2.8 billion base pairs (bp). Conversely, our esti- mate for the size of bovine genome of 4176 cM suggests it might be closer to human and possibly even larger.
The data cannot be taken as conclusive. In particular, it is known from extensive and careful studies in human (Bray-Ward et al. 1996) that the relationship between physical and genetic maps is not uniform along the length of a chromosome. Genetic recom- bination is generally suppressed in the centromere-proximal re- gions. Moreover, the striking reduction of genetic recombination in the human acrocentric chromosomes (Bray-Ward et al. 1996) has a special significance here, since all the chromosomes in the bovine karyotype are acrocentric. Conversely, the telomeric re- gions of several human chromosomes cover very long distances in recombination map units, cM, if compared with the short spacing of the physically mapped markers. Special care should also be taken in evaluating FISH data for telomeric markers, since it is often difficult to interpret the ends of chromosomes by fluores- cence microscopy. However, imprecise FISH assignments of telo- meric markers cannot alone explain the large estimated genome size presented in this paper. This could be the case for two of the
Idiograms of G-banded chromosomes (Popescu et al. 1996) are flanked by the corresponding linkage groups. Linkage data are based on the CGD (W. Barendse, CSIRO). Distances are in cM and the linkage groups are drawn to scale, with the total length given at the bottom. D numbers identify anonymous DNA loci. The physically mapped loci anchored on the genetic map are shown in between the idiograms and the linkage groups with the corresponding chromosomal band assignments. For Chr 15 the linkage
Table 1 for a complete list). D numbers without a physical assignment are of markers that define the current ends of the linkage groups. For the following genes the physical mapping information was incorporated in the figure: CAS@ (Gallagher et al. 1994), RASA (Eggen et al. 1992), LGB (Hayes and Petit 1993), FGG (Johnson et al. 1993), GJA1 (Castiglioni et al. 1996).
L. Ferreni et al.: Bovine genetic and physical maps 35
Table 2. Comparison of the bovine physical and genetic maps
Inferred Genetic genome
Markers distance size
(Longest Length sex aver. sex aver.
Chr interval) (% genome) (cM) (cM) 1 D1S42-D1S40 4.02 121 3010 2 D2S32-D2S 7 3.516 112 3185 3 D3S29-D3S24 3.114 159 5063 5 DSS3-DSS30 1.635 81 4954 6 D6S24-CAS@ 2.62 90 3435 7 D7S30-RASA " 2.27 91 4009 8 D8S20-DSS21 2.13 107 5023 9 GJAI-D9S14 1.79 28 1564 11 D11S17-LGB 3.09 123 3980 12 D12S29--D12S17 2.19 83 3790 15 D15S18-D15S23 1.63 47 2883 16 D16S34-D16S5 1.63 59 3620 17 D17S29-FGG 2.00 91 4550 18 D18S10~D18S16 1.58 103 6519 19 DI9S18-D19S2 1.14 64 5614 21 D21S25-D21S23 1.22 47 3852 23 D23S27-D23S38 1.07 55 5121 25 D25S12-D25S11 1.33 37 2782 28 D28S17-D28S10 1.21 71 5868 29 D29S12-D29S2 1.36 97 7132 Total interval 40.66 1666 4176
small chromosomes, namely Chr 28 and Chr 29, and for Chr 5, which has several markers mapped to the telomere, but not for other chromosomes, such as Chrs 17, 18, 7, and 3. As an example, the interval spanning markers D7S30 and RASA on Chr 7 does not include the telomeric region, yet predicts a genome size above 4000 cM. On Chr 3, one could argue that the large estimate of 5063 cM is due to the inclusion of four telorneric markers in the interval; however, a large estimate is still obtained (4980 cM) when considering the interval between markers D3S29 and D3S25, which do not include the telomere region of the chromosome. A chromosome size-dependent control of recombination has been hypothesized in organisms as distant as yeast and human (Kaback 1996). Thus, small human chromosomes recombine at 1.5- to 3-fold higher rates than large chromosomes.
Curiously, there seems to be a better correlation between the genetic size of a genome and the number of chromosomes, rather than size in base pairs. At least, this is what emerges from the analysis of the few mammalian species where substantial linkage data are available: thus, for the mouse (19 autosomes, X and Y) and pig (18, X and Y), the genome size is small (1600 and 2000 cM respectively), compared with human (23, X and Y) with 3800-- 4000 cM and now for the cattle genome (29, X and Y), which is apparently above 4100 cM (Davisson and Roderick 1989; Weis- senbach et al. 1992; Dietrich et al. 1994; Archibald et al. 1995; Hudson et al. 1995). It will be interesting to see the result for sheep, when the linkage map is more complete (Crawford et al. 1995). In chicken the available maps are incomplete (Bumstead and Palyga 1992; Levin et al. 1994); however, the 33 known linkage groups in the chicken seem to cover as much as 3200 cM, and possibly more, despite the genome being 1 x 10⁹ bp, about one-third the size of the mammalian species mentioned above. Indeed, there is evidence that the rate of genetic recombination might be three times higher in chicken than in human.
A better coverage of physically mapped markers is required to assess the alignment of the physical and genetic maps of cattle. However, based on a 40.6% physical coverage of the genome, the data presented in this paper suggest that the current linkage map of the bovine genome may cover less than the hypothesized 95% (Barendse et al. 1996).
The availability of physical resources, such as YAC and BAC libraries (Cai et al. 1995), as well as the development of tools like radiation hybrid somatic cell lines (Gyapay et al. 1996), will be crucial to a better integration of the physical and genetic maps of
cattle, and ultimately for the accurate localization of trait loci as a prelude to finding the genes themselves.
Acknowledgments. This work is part of the European BovMap Project and
was supported by grants from the European Union (DGXII, Biotechnology C'I~2-0359). Funding from the following national agencies is acknowl- edged: The Ministry of Agriculture, Fisheries and Food, UK (OCS9024, 9414); the National Research Council (CNR), Italy; the GREG (Groupe- ment de Recherche et d'Etude sur les Genome), France; the German Na- tional Science Foundation (DFG); the Norwegian Research Council; and the Meat Research Corporation of Australia for continuing support to W. Barendse.References
Anastassiadis, C., Leyhe, B., Olsaker, I., Friedl, R., Rottmann, O., Hiend- leder, S., Erhardt, G. (1996). Three polymorphic microsatellites for bo- vine chromosomes 7, 12, and 19. Anim. Genet. 27, 125-126. Archibald, A.L., Haley, C.S., Brown, J.F., Couperwhite, S., McQueen,
H.A., Nicholson, D., Coppieters, W., Van de Weghe, A., Stratil, A., Winterr A.K. Freedholm, M., Larsen, N.J., Nielsen, V.H., Milan, D., Woloszyn, N., Robic, A., Dalens, M., Riquet, J., Gellin, J., Caritez, J.-C., Burgaud, G., Ollivier, L., Bidanel, J.-P., Vaiman, M., Renard, C., Gel- dermann, H., Davoli, R., Ruyter, D., Verstege, E.J.M., Groenen, M.A.M., Davies, W., Hcyheim, B., Keiserud, A., Andersson, L., EI- legren, H., Johansson, M., Marklund, L., Miller, J.R., Anderson Dear, D.V., Signer, E., Jeffreys, A.J., Moran, C., Le Tissier, P., Muladno, Rothschild, M.F., Tnggle, C.K., Vaske, D., Helm, J., Liu, H.-C., Rah- man, A., Yu, T.-P., Larson, R.G., Sehmitz, C.B. (1995). The PiGMaP consortium linkage map of the pig
(Sus scrofa). Mamm. Genome 6,
157-175.Bahri-Darwich, I., Vaiman, D., Olsaker, IL., Oustry, A., Cribiu, E.P. (1994). Assignment of bovine synteny groups U27 and U8 to R-banded Chromosomes 12 and 27, respectively. Hereditas 120, 261-265. Barendse, W., Vaiman, D., Kemp, S.J., Sugimoto, Y., Armitage, S., Willi-
ams, J.L., Sun, H.S., Eggen, A., Agaba, M., Aleyasin, S.A., Band, M., Bishop, M.D., Buitkamp, J., Byrne, K., Collins, F., Cooper, L., Cop- pettiers, W., Denys, B., Drinkwater, R.D., Easterday, K., Elduque, C., Ennis, S., Erhardt, G., Ferretti, L., Flavin, N., Gao, Q., Georges, M., Gurung, R., Harlizius, B., Hawkins, G., Hetzel, D.J:S., Hirano, T., Hulme, D., Joergensen, C.,, Kessler, M., Kirkpatrick, B.W., Konfortov, B., Kostia, S., Kuhn, C., Lenstra, J., Leveziel, H., Lewin, H.A., Leyhe, B., Li, L., Martin Buriel, I., McGraw, R.A., Miller, J.R., Moody, D.E., Moore, S.S., Nakane, S., Nijman, I., Olsaker, I., Pomp, D., Rando, A., Ron, M., Shalom, A., Soller, M., Teale, A.J., Thieven, I., Urquhart, B., Vage, D-I., Van de Weghe, A., Varvio, S., Velmala, R., Vilkki, J., Weikard, R., Woodside, C., Womack, J.E., Zanotti, M., and Zaragoza, P. (1996). A medium density genetic linkage map of the bovine genome. Mamm. Genome, 8, 21-28.
Barendse, W., Armitage, S.M., Kossarek, L.M., Shalom, AL., Kirkpatrick, B.W., Ryan, A.M., Clayton, D., Li, L., Neiberg, H.L., Zhang, N., Grosse, W.M., Weiss, J., Creighton, P., McCarthy, F., Ron, M., Teale, A.J., Fries, R., McGraw, R.A., Moore, S.S., Georges, M., Soller, M., Wo- mack, J.E., Hetzel, D.J.S. (1994a). A genetic linkage map of the bovine genome. Nature Genet. 6, 227-235.
Bishop, M.D., Kappes, S.M., Keele, J.W., Stone, R.T., Sunden, S.LF., Hawkins, G.A., Solinas-Toldo, S., Fries, R., Grosz, M.D., Yoo, J., Be- attic, C.W. (1994). A genetic linkage map for cattle. Genetics 136, 619-639.
Bray-Ward, P., Menninger, J., Lieman, J., Desai, T., Mokady, N., Banks, A., Ward, D.C. (1996). Integration of the cytogenetie, genetic, and physical maps of the human genome by FISH mapping of the CEPH YAC clones. Genomics 32, 1-14.
Bumstead, N., Palyga, Y. (1992). A preliminary linkage map of the chicken genome. Genomics 13, 690-697.
Cai, L., Taylor, J.F., Wing, R.A., Gallagher, D.S., Woo, S.-S., Davis, S.K. (1995). Construction and characterization of a bovine bacterial artificial chromosome library. Genomies 29, 413--425.
Castiglioni, B., Ferretti, L., Tenchini, M.L., Mezzelani, A., Simonic, T., Duga, S. (1996). Physical mapping of connexin 32 (GJB1) and 43 (GJA1) genes to bovine chromosomes Xq22 and 9q15-16 by fluores- cence in situ hybridization. Mamm. Genome 7, 634-635.
Crawford, A.M., Dodds, K.G., Ede, A.J., Pearson, C.A., Montgomery, G.W., Garmonsway, H.G., Beanie, A.E., Davies, K., Maddox, J.F., Kappes, S.W., Stone, R.T., Nguyen, T.C., Penty, J.M., Lord, E.A., Broom, J.E., Buitkamp, J., Schwaiger, W., Epplen, J.T., Matthew, P.,
Matthews, M.E., Hulme, D.J., Beh, K.E., McGraw, R.A., Beattie, C.W. (1995). An autosomal genetic linkage map of the sheep genome. Ge- netics 140, 703-724.
Davisson, M.T., Rodedck, T.H. (1989). Linkage Map. In Genetic Variants and Strains of the Laboratory Mouse, ed. 2, M.F. Lyon, A.G. Searles, eds. (Stuttgart: Gustay Fischer Verlag), pp. 416--427.
Dietrich, W.F., Miller, J.C., Steen, R.G., Merchant, M., Damron, D., Nahf, R., Gross, A., Joyce, D.C., Wessel, M., Dredge, R.D., Marquis, A., Stein, L.D., Goodman, N., Page, D.C., Lander, E.S. (1994). A genetic map of the mouse with 4006 simple sequence length polymorphisms. Nature Genet. 7, 220-245.
Eggen, A. (1992). Recherche de marqueurs polymorphes dans la r6gion putative de l'Amyotrophie spinale bovine a l'aide de la cartographic compar6e. Ph.D. Thesis ETHZ Nr. 9835.
Eggen, A., Fries, R. (1995). An integrated cytogenetic and meiotic map of the bovine genome. Anim. Genet. 26, 215-236.
Eggen, A., Solinas-Toldo, S., Dietz, A.B., Womack, J., Stranzinger, G., Fries, R, (1992). RASA contains a polymorphie microsatellite and maps to bovine syntenic group U22 on chromosome 7q24-qter. Mamm. Ge- home 3, 559-563.
Eggen, A., Bahri-Darwich, I., Mercier, D., Vaiman, D., Cribiu, E.P. (1994). Assignment of bovine synteny group U2 to chromosome 9. Anim. Genet. 25, 183--185.
Eggen, A., Bahri-Darwich, I., Elduque, C., Petit, E., Oustry, A., Cribiu, E.P., Leveziel, H. (1996). New cosmids containing microsatellites for mapping the bovine genome. Mamm. Genome, in preparation. Ellegren, H., Chowdhary, B., Johansson, M., Andersson, L. (1994a). Inte-
grating the porcine physical and linkage map using cosmid-derived markers. Anim. Genet. 25, 155-164.
Ellegren, H., Chowdhary, B.P., Johansson, M., Marklund, L., Fredholm, M., Gustavsson, I., Andersson, L. (1994b). A primary linkage map of the porcine genome reveals a low rate of genetic recombination. Genetics 137, 1089-1100.
Ferretti, L., Leone, P., Filla, F., Zhang, Y., Nocart, M., Gu6rin, G. (1994). Direct characterization of bovine microsatellites from cosmids" poly- morphism and synteny mapping. Anim. Genet. 25, 209-214.
Fries, R., Eggen, A., Womack, J.E. (1993). A bovine genome map. Mamm. Genome 4, 405..-428.
Gallagher, D.S., Schelling, C., Groenen, M.A.M., Womack, J. (1994). Confirmation that the casein gene cluster resides on cattle chromosome 6. Mamm. Genome 5, 524.
Green, P., Falls, K., Crooks, S. (1990). Documentation for CRI-MAP, version 2.4 (ST Louis: Washington University School of Medicien). Gyapay, G., Schmitt, K., Fizames, C., Jones, H., Vega-Czarny, N., Spiller,
D., Muselet, D., Prud'Homme, J.-F., Dib, C., Auffray, C., Morissette, J., Weissenbach, J., Goodfellow, P.N. (1996). A radiation hybrid map of the human genome. Hum. Mol. Genet. 5, 339-346.
Harlizius, B., Gu6dn, G., Ferretti, L. (1996). IDVGA65 (D6S29), an SSCP marker assigned to BTA6 by means of FISH, genetic and synteny map- ping. Anim. Genet., in press.
Hayes, H., Petit, E.J. (1993). Mapping of the 13-1actoglobulin gene and of an immunoglobulin M heavy chain-like sequence to homoeologous cattle, sheep and goat chromosomes. Mamm. Genome 4, 207-210. Hudson, T.J., Stein, L.D., Gerety, S.S., Ma, J., Castle, A.B., Silva, J.,
Slonim, D.K., Baptista, R., Kruglyak, L., Xu, S.H., et al. (1995). An STS-based map of the human genome. Science 270, 1945-1954. ISCNDA 1989 (1990). International system for cytogenetic nomenclature
of domestic animals (Di Berardino D, Hayes H, Fries R, Long S, eds.). Cytogenet. Cell Genet. 53, 65-79.
Jagiello, G.M., Miller, W.A., Ducayen, M.B., Lin, J.S. (1974). Chiasma frequency and disjunctional behaviour of ewe and cow oocytes matured in vitro. Biol. Reprod. 10, 354-363.
Johnson, S.E., Barendse, W., Hetzel, D.J. (1993). The gamma fibrinogen gene (FGG) maps to chromosome 17 in both cattle and sheep. Cyto- genet. Cell Genet. 62, 176-180.
Kaback, D.B. (1996). Chromosome-size dependent control of meiotic re- combination in humans. Nature Genet. 13, 20-21.
Kiihn, C., Weikard, R., Goldammer, T., Olsaker, I. (1996). FBN3 (D6S24)--a bovine microsatellite derived from cosmid c1OBT475 at chromosome 6q12-14. Anim. Genet. 27, 61.
Levin, I., Santangelo, L., Cheng, H., Crittenden, L.B., Dodgson, J.B. (1994). An autosomal genetic linkage map of the chicken. J. Hered. 85, 79-85. Lichter, P., Tang, C.-J., Call, K., Hermanson, G., Evans, G.A., Housman,
D., Ward, D.C. (1990). High resolution mapping of human chromosome 11 by in situ hybridization with cosmid clones. Science 247, 64--69.
Logue, D.N., Harvey, M.J.A. (1978). Meiosis and spermatogenesis in bulls heterozygous for a presumptive 1/29 Robertsonian translocation. J. Re- prod. Fertil. 54, 159-165.
Martin-Burriel, I., Chowdhary, B.P., Prakash, B., Zaragoza, P., Olsaker, I. (1996a). A polymorphic bovine dinucleotide repeat D17S29 (IOZARA975) at chromosome 17q26. Anim. Genet. 27, 287. Martin-Burriel, I., Chowdhary, B.P., Prakash, B., Zaragoza, P., Olsaker, I.
(1996b). A polymorphic bovine dinucleotide repeat DXYS4 (IOZARA1489) located at Xq42-q43 and linked within the pseudo- autosomal region of the sex chromosomes. Anim. Genet. 27, 287. Masabanda, J., Kappes, S.M., Smith, T.P.L., Beattie, C.W., Fries, R.
(1996). Mapping of a linkage group to the last bovine chromosome (BTA27) without an assignment. Mamm. Genome 7, 229-230. Mezzelani, A., Solinas Toldo, A., Nocart, M., Gu6rin, G., Ferretti, L.,
Fries, R. (1994). Mapping of syntenic groups U7 and U27 to bovine chromosomes 25 and 12, respectively. Mamm. Genome 5, 574--576. Mezzelani, A., Zhang, Y., Redaelli, L., Castiglioni, B., Leone, P., Wil-
liams, J., Solinas-Toldo, S., Wigger, G,, Fries, R., Ferretti, L. (1995). Chromosomal localization and molecular characterization of 53 cosmid- derived bovine microsatellites. Mamm. Genome 6, 629-635.
Nijman, I.J., Lenstra, J.A., Schwerin, M., Olsaker, I. (1996). Polymor- phisms and physical locations of three bovine microsatellite loci: IOBT395, IOBT528 and IOBT1401. Anim. Genet. 27, 221-222. O'Brien, S.J., Womack, J.E., Lyons, L.A., Moore, K.J., Jenkins, N.A.,
Copeland, N.G. (1993). Anchored reference loci for comparative ge- nome mapping in mammals. Nature Genet. 3, 103-112.
Olsaker, I., Prakash, B., Guttersrud, O.A., Chowdhary, B.P. (1996a). D27S14 (1OBT313): a genetic and physical marker for bovine chromo- some 27, submitted.
Olsaker, I., Solinas Toldo, S., Fries, R. (1996b). A highly polymorphic bovine dinucleotide repeat D19S4 (IOBT 34) at chromosome 19q21. Anim. Genet. 27, 58--59.
Olsaker, I., Williams, J.L., Chowdhary, B.P., Karlsson, L., Urquhart, B.G.D., Prakash, B. (1996c). Physical and genetic mapping of a bovine dinucleotide repeat marker D23S38 (IOBT1479) to chromosome 23q24- 25. Anim. Genet., in press.
Olson, M., Hood, L., Cantor, C.,.Botstein, D. (1989). A common language for physical mapping of the human genome. Science 245, 1434-1435. Popescu, C.P., Long, S., Riggs, P., Womack, J.E., Schmutz, S., Fries, R.
(1996). Standardization of cattle karyotype nomenclature. Report of the committee for the standardization of the cattle karyotype. Cytogenet. Cell Genet., in press.
Solinas Toldo, S., Fries, R., Steffen, P., Neibergs, N.H., Barendse, W., Womack, J.E., Hetzel, D.J.S. (1993). Physically mapped, cosmid- derived microsatellite markers as anchor loci on bovine chromosomes. Mamm. Genome 4, 720-727.
Thieven, U., Harlizius, B., Simon, D. (1995). Dinucleotide repeat polymor- phism at the bovine HAUT1 and HAUT14 loci. Anim. Genet. 26, 123. Thieven, U., Solinas Toldo, S., Fries, R., Barendse, W., Simon, D., Har-
lizius, B. (1996). Polymorphie CA-microsatellites for the integration of the bovine genetic and physical map. Mamm. Geuome, in press. Vaiman, D., Bahri-Darwich, I., Mercier, D., Yerle, M., Eggen, A., Levez-
iel, H., Gu6rin, G., Gellin, J., Cribiu, E.P. (1993). Mapping of new bovine microsatellites on cattle chromosome 15 with somatic cell hy- brids, linkage analysis, and fluorescence in situ hybridization. Mamm. Genome 4, 676-679.
Vaiman, D., Mercier, D., A., E., Bahri-Darwich, I., Grosh, C., Cribiu, E.P., Dolf, G., Oustry, A., Gu6rin, G., Lev6ziel, H. (1994). A genetic and physical map of bovine chromosome II. Mamm. Genome 5, 553-556. Weissenbach, J., Gyapay, G., Dib, C., Vignal, A., Morissette, J., Millas- seau, P., Vaysseix, G., Lathrop, M. (1992). A second-generation linkage map of the human genome. Nature 359, 794--801.
Williams, J.L., Morgan, A.L.G., Gu6rin, G., Urquhart, B.G.D. (1996a). Ten cosmid-derived bovine microsatellite markers. Anim. Genet. 27, 380. Williams, J.L., Olsaker, I., Teres, V.M. (1996b). Using SSCP to facilitate
mapping microsatellite loci. Mamm. Genome 8, in press.
Williams, J.L., Urquhart, B.G., Castiglioni, B., Ferretti, L. (1996c). Map- ping two microsatellite loci, IDVGA66 (D16S34) and IDVGA76 (D14S35), by SSCP. Anim. Genet., in press.
Womack, J.E., Moll, Y.D. (1986). Gene map of the cow: conservation of linkage with mouse and man. J. Hered. 77, 2-7.
Zhang, Y., Redaelli, L., Castiglioni, B., Mezzelani, A., Ferretti, L. (1995). Five polymorphic bovine microsatellite loci, IDVGA-62A, IDVGA-71, IDVGA-82, IDVGA-88, IDVGA-90. Anita. Genet. 26, 365-366.