HAL Id: hal-02492607
https://hal.archives-ouvertes.fr/hal-02492607
Submitted on 27 Feb 2020
HAL is a multi-disciplinary open access
archive for the deposit and dissemination of
sci-entific research documents, whether they are
pub-lished or not. The documents may come from
teaching and research institutions in France or
abroad, or from public or private research centers.
L’archive ouverte pluridisciplinaire HAL, est
destinée au dépôt et à la diffusion de documents
scientifiques de niveau recherche, publiés ou non,
émanant des établissements d’enseignement et de
recherche français ou étrangers, des laboratoires
publics ou privés.
Enlacement and interlacement shape descriptors
Michaël Clément, Camille Kurtz, Laurent Wendling
To cite this version:
Michaël Clément, Camille Kurtz, Laurent Wendling. Enlacement and interlacement shape
descrip-tors. International Conference on Pattern Recognition and Artificial Intelligence (ICPRAI), 2020,
Zhongshan, China. �hal-02492607�
Michaël Clément1, Camille Kurtz2, and Laurent Wendling2
1
Univ. Bordeaux, CNRS, Bordeaux INP, LaBRI UMR 5800, 33400 Talence, France
2
Université de Paris, LIPADE, 75006 Paris, France
Abstract. We propose a novel approach to characterize complex 2D shapes based on enlacement and interlacement directional spatial rela-tions. This new relational concept allows to assess in a polar space how the concave parts of objects are intertwined following a set of directions. In addition, such a spatial relationship has an interesting behavior consid-ering the common properties in pattern recognition such as translation, rotation, scale and symmetry. A shape descriptor is defined by consid-ering the enlacement of its own shape and the disk area that surrounds it. An experimental study carried out on two datasets of binary shapes highlights the discriminating ability of these new shape descriptors.
Keywords: shape descriptors · spatial relations · enlacement · interlacement
1
Introduction
A 2D shape recognition system is usually roughly decomposed into several suc-cessive steps [1, 2]. First, the shapes are extracted from their surrounding back-ground. This step, called segmentation, relies heavily on a priori knowledge of the images to be processed. Then, a new representation is built from the extracted patterns. This representation aims to computationally judge the simi-larity or distance between two patterns, usually to perform classification. It may either be a set of measurements made on the patterns, forming a vector of fea-tures, or a symbolic description of how the pattern can be divided into basic shapes. The choice of one representation instead of another one generally re-lies on the application under consideration, and following underlying conditions such as robustness against noise and small distortions, invariance with regards to common geometrical transformations or tolerance to occlusions. The shape rep-resentation for object recognition has been the subject of numerous researches; and extensive surveys of shape analysis can be found in the literature, for ex-ample in [3–5]. Two main categories of shape descriptors are often encountered: those working on a shape as a whole (called region-based descriptors) and those working on the contours of the shape (called contour-based descriptors).
The usual descriptors based on the contours include the well-known Fourier descriptors [6–8] and the curvature approaches [9, 10], where a shape is described in a scale space. The shape context [11] is also a robust descriptor to small per-turbations of parts of the shape. The main drawback lies in the lack of guaran-tee with scale-invariance. Other approaches are based on the extraction of the
2 M. Clément et al.
skeleton considering [12, 13] (for instance, a graph defined from the medial axis). Shock graphs associated to both global optimization and graph matching provide a powerful tool [14] for discriminating shapes but such methods are generally highly sensitive to scale variations. Since contour descriptors are based on the boundary of a shape, they are not able to properly capture the internal struc-ture of a shape. Furthermore, such methods are not suitable for disjoint shapes or shapes with holes because boundary information is not available. Therefore, they remain limited to certain types of applications.
Region-based descriptors work on a shape as a whole taking into account all the pixels within it. Comparative studies [15, 16] have demonstrated the interest of the Zernike moments, and numerous researches have been focused on improv-ing their invariance properties [17] and speedimprov-ing up the fast computation of the Zernike moments [18]. Fourier-Mellin has been introduced to avoid the mathe-matical application problems of the standard transform but an approximation is required to process with numerical data [19]. To overcome the drawbacks of con-tour based Fourier descriptors, Zhang and Lu [8] have proposed a region-based generic Fourier descriptor based on the polar discrete transform. Experimental results show that this approach outperforms common contour-based (classical Fourier and curvature approaches) and region-based (Zernike moments) shape descriptors. These methods were often adapted to deal with the specificities of the application under consideration. On the whole, region-based methods are more suited to general applications. However, they are generally more compu-tationally intense and most approaches need to normalize (centroid position, re-sampling) the image to be processed with geometrical properties. Such a nor-malization may introduce errors, sensitivity to noise, and consequently inaccu-racy in the recognition / decision process.
Among region-based descriptors, relative position descriptors aim at assess-ing a specific measure followassess-ing a set of directions. Most of the works have been focused on the notions on force histogram [20], phi-descriptor [21], meta direc-tional histogram [22] built from fuzzy landscapes [23] and Radon transform [24]. Such methods are less sensitive to the noise and they preserve common geometri-cal properties. They are generally less relevant when the number of classes grows drastically due to the compact aspect of the descriptor but they offer important (complementary) information when they are combined with other descriptors.
In this paper, our contribution is the proposition of a novel region-based ap-proach in the context of this generic shape recognition problem. The underlying strategy of our method is to capture how the parts of one object are messed or twisted from a circular background area, enabling capture more complex pat-terns, whose shapes are, for instance, affected by complex concavities and (deep) levels of imbrication. The remainder of this article is organized as follows. Sec-tion 2 recalls the concept of direcSec-tional spatial enlacement, initially proposed in [25]. From this model, we derive novel shape descriptors, presented in Sec-tion 3 and SecSec-tion 4, which are defined by considering the enlacement / inter-lacement of the object shape and the disk area surrounding it. An experimental
study carried out on two databases of binary shapes is described in Section 5. Finally, conclusions and perspectives will be found in Section 6.
2
Directional Spatial Enlacement
The notion of directional spatial enlacement, modeled as an “enlacement” his-togram, was initially proposed to assess a new spatial relation between two binary objects [25]. Such a histogram was also embedded in pattern recognition appli-cations considering local features calculated from pairs of broad objects [26]. We show here that it can be easily used to provide a discriminate descriptor (or signature) characterizing only one shape. We recall first basic notions aiming at describing such a kind of signature that efficiently integrates both whole shape and spatial description following a set of directions. A full description of the underlying theoretical developments can be found in [27, 25].
Let (A, B) be a couple of two-dimensional objects. The goal is to measure how an object A is enlaced with an object B (and reciprocally).
Handling with points The relative positions of individual points ai∈ A and
bi ∈ B are considered as arguments to put in favor of the proposition “A is
enlaced by B”. Let us consider an oriented straight line ∆(θ,ρ). The functions
fA(θ,ρ) and fB(θ,ρ) designate longitudinal cuts along the oriented line ∆(θ,ρ). The
quantity of A located after a point x on a line ∆(θ,ρ) is given by:
Z +∞
x
fA(θ,ρ)(y) dy. (1)
Handling with segments Let us consider a binary object A. The integral determines the cumulated length of the segments on the interval [x, +∞[ of this longitudinal cut. Consequently, to capture the quantity of A located after points of B on this line, we have:
Z +∞ −∞ fB(θ,ρ)(x) Z +∞ x fA(θ,ρ)(y) dy dx. (2)
Symmetrically, the quantity of A located before parts of B is obtained with: Z +∞ −∞ fA(θ,ρ)(x) Z +∞ x fB(θ,ρ)(y) dy dx. (3)
The goal is then to combine these two quantities, in order to take into account both parts of B before and after parts of A, leading us to the following general definition of the one-dimensional enlacement. Let f and g be two bounded mea-surable functions with compact support from R to R. The enlacement of f with regards to g is defined as:
E(f, g) = Z +∞ −∞ g(x) Z +∞ x f (y) Z +∞ y g(z) dz dy dx. (4)
4 M. Clément et al.
This generic definition between two real-valued functions can be applied to longitudinal cuts fA(θ,ρ)and fB(θ,ρ). The value E(fA(θ,ρ), fB(θ,ρ)) represents the over-all enlacement of A by B along the oriented line ∆(θ,ρ).
Handling with objects Let θ∈ R be an orientation angle and let us consider the pencil of all parallel lines {∆(θ,ρ), ρ
∈ R} in this direction; they will slice any object into a pencil of longitudinal cuts. The enlacement of an object with regards to another in this direction θ, is obtained by aggregating all the one-dimensional enlacement values, as it follows. Let θ∈ R be an orientation angle, and let A and B be two objects. The enlacement of A by B in the direction θ is given by:
EAB(θ) =
Z +∞
−∞
E(fA(θ,ρ), fB(θ,ρ)) dρ. (5)
Properties Considering the definition of the enlacement from parallel longitu-dinal cuts, the following properties can be easily checked [25]:
– For any two objects A and B, the directional enlacement EAB is periodic
with period π, that is∀θ ∈ R, EAB(θ) = EAB(θ + kπ), k∈ Z;
– For any two objects A and B, the directional enlacement EAB is invariant
with regards to translations. Let Tv by a translation by a vector v∈ C '
R2, we have: ETv(A)Tv(B)(θ) = EAB(θ);
– For any two objects A and B, the directional enlacement EAB is
quasi-invariant with regards to rotations. Let α∈ R be a rotation angle and let Rαbe a rotation transformation, we have: ERα(A)Rα(B)(θ) = EAB(θ− α);
– For any two objects A and B, the directional enlacement EAB is
quasi-invariant with regards to scaling transformations. Let λ∈ R be a scaling factor and let Sλ be a scaling transformation, we have: ESλ(A)Sλ(B)(θ) =
λ4E AB(θ).
3
Enlacement Descriptor
In its initial definition, the enlacement is calculated between two generic binary objects A and B. Considering one single shape, a longitudinal cut can split it into several segments assuming the existence of holes or concavities. The goal is to assess such internal information by calculating the enlacement between a shape and a surrounding area (including the convex hull). Let us consider a shape A and its centroid cA(xa, ya). Let rAbe the maximal radius of A, calculated from
cA. The surrounding area, noted ¯A is defined from the disk D of center cA and
radius rA such that: ¯A = D\A (that is D = A ∪ ¯A).
The scalar enlacement value in a given direction should be relative to the overall area in order to compare the enlacement of different couples of shapes having the same area (but different shapes). Let us define the area kAk1 of a shape A by:
kAk1=
Z Z
R2
|fA(x, y)| dx dy. (6)
The directional enlacement descriptor of A with regards to ¯A is defined by the following function (withEA ¯A is equal to 0 if A = D):
EA ¯A: R−→ R θ7−→ EA ¯A(θ) kAk1(πr 2 A− kAk1) . (7)
The enlacement descriptorEA ¯Atakes the form of a function, which associates to each angle θ the enlacement value of A by its surrounding area ¯A normalized by the combination of the two respective areas. Note that both descriptorsEA ¯A
and EAA¯ provide complementary information (i.e. enlacement of the enclosing
circle by the shape, and enlacement of the shape by the enclosing circle respec-tively). In this sense, they can also be concatenated into a single feature vector EA ¯AEAA¯ .
An overall number of elementary occurrences of enlacement is obtained by considering each longitudinal cut of the shape in direction θ. The descriptor can be interpreted as a circular histogram, which we call the E-histogram. Using a disk area as an overlapping support instead of a rectangle area keeps consistency (in an isotropic manner), considering the pencil of longitudinal cuts following any direction, as the same amount of pairwise information is processed. Thanks to this normalization the enlacement histogram EA ¯A is invariant with regards to scaling transformations, that is: let λ∈ R be a scaling factor and let Sλ be the
associated scaling transformation; we have:ESλ(A)Sλ( ¯A)(θ) =EA ¯A(θ).
It is easy to show that the properties of periodicity (considering opposite directions), translation (as shapes are processed independently of their location in the frame) and rotation (a rotation of angle θ implies a circular shift of θ in the descriptor) are preserved from EA ¯A for the enlacement histogram EA ¯A.
ThenE-histogram of a shape is invariant with regards to translations and scaling transformations, and quasi-invariant to rotations.
4
Interlacement Descriptor
The enlacement histogram EA ¯A defines a shape descriptor that quantitatively
characterizes how a shape A is enlaced by its surrounding background ¯A. As a relative position descriptor, the descriptorEA ¯A does not completely describe
the spatial configuration of A and ¯A. So the opposite descriptorEAA¯ is
comple-mentary to EA ¯A and can also be considered to improve the description of the
shape under consideration. The combination of these two descriptors provides a description of the mutual interlacement of the shape and its surrounding area. The directional interlacement descriptor is defined by the harmonic mean as:
IA ¯A(θ) =
2 EA ¯A(θ)× EAA¯ (θ)
EA ¯A(θ) +EAA¯ (θ)
6 M. Clément et al.
q
i= x
icos
h
i+ y
isin
h
i, into a Radon matrix. That is, for
each point (x
i, y
i) of the image, i is fixed and the value
q
iis calculated using stepwise increments of
h
ifrom 0 to
p.
The increment is defined following the Shannon theory
(see
[36]
for more details) to avoid aliasing. Here, we set
Dh = Dq = 1, Dx = Dy = 1/2 and the sampled values of q
iare defined by a linear interpolation. This algorithm
requires time O (N
2M) for an image of size N
· N and M
different angles (here M = 180).
Two major optimizations are made to reduce the
com-plexity. The cosine and the sine of all the possible values
of
h
iare computed just once. The values of
q
iare also
defined recursively. That is, since the step increment
Dx is
set to 1/2, we have:
q
iþ12
¼ q
iþ
coshi
2
. Therefore, when we
move in the x-direction,
q is incremented by cos h/2.
Simi-larly, in the y-direction
q is increased by sin h/2.
Hence, the discrete Radon transform is represented by a
digital image and the discrete R-transform is defined by:
^
RðhÞ ¼
P
qmax^ q¼qmin
T
^
2
Rf
ð^q; ^hÞ. We are aware that the properties
of the continuous Radon transform carry over to the
dis-crete Radon transform only approximately, due to errors
of discretization. However, we will see in Section
6
that
experiments provide evidence that errors are small.
5. Measure of distance
We have seen from Section
3
that a rotation of the shape
implies a translation of the R-transform modulo
p.
There-fore, if we apply a one-dimensional Fourier transform on
this function, the rotation invariance is achieved by
ignor-ing the phase in the coefficients and only keepignor-ing the
mag-nitudes of the coefficients. Let R
lqand R
lm, respectively, be
the discrete R-transform of a query and a model shape for l
different levels of the Chamfer distance transform. After
the discrete one-dimensional Fourier transform F, the
query and the model feature vectors are defined as follows:
X
q¼
FR
0 qð1Þ
FR
0 qð0Þ
; . . . ;
FR
0 qðpÞ
FR
0 qð0Þ
; . . . ;
FR
l qð1Þ
FR
l qð0Þ
; . . . ;
FR
l qðpÞ
FR
l qð0Þ
!
X
m¼
FR
0mð1Þ
FR
0 mð0Þ
; . . . ;
FR
0 mðpÞ
FR
0 mð0Þ
; . . . ;
FR
l mð1Þ
FR
l mð0Þ
; . . . ;
FR
l mðpÞ
FR
l mð0Þ
!
"
.
For two shapes represented by their R-transform, the
Euclidean distance is directly calculated between the two
Fourier feature vectors X
qand X
m.
6. Experimental results
Experimental results gathered during a shape
recogni-tion process are presented to show the efficiency of the
pro-posed algorithm. The method was tested on several
databases. First, two databases of Sharvit et al.
[30]
kindly
made available to us on his website:
http://www.lems.
brown.edu/vision/researchAreas/SIID/
have been used.
The first database consists of nine categories with 11
shapes in each cluster (see
Fig.7
). Each shape is matched
against all the other shapes of the database (at all 9801
shape comparisons are made) and we count in the nth
(n from 1 to 11) nearest neighbors the number of times
the test image was correctly classified. A few of the shapes
are occluded (clusters airplanes and hands) and some
shapes are partially represented (clusters rabbits, men,
and hands). There are also distorted objects (cluster 6)
and very heterogeneous shapes in the same cluster
(ani-mals). Furthermore, to demonstrate scale invariance and
robustness to noise, the experiments were tested again with
the database of
Fig. 7
increased in scale by 400%, scaled
down by 50%, and degraded with salt-and-pepper noise
(common in binary images) with different degrees. We
can remark that the results of the matching are quite
sim-ilar to those obtained with the original database (compare
Figs. 9–11
with
Fig. 8
). More significantly, we have run the
experiments on a certain shape which has been scaled and
rotated (see
Fig. 12
). When two shapes are similar the
dis-tance is close to zero and we can see from
Fig. 12
that with
only one exception, the distance measures are small. The
exception is due to pixelation errors resulting from the
scal-ing of the smallest image which has been scaled down by a
factor of 32 from the largest. Also a shape from a different
class is included in the
Fig. 12
to have a reference of how
small the metric is for the scaled/rotated dogs. On average
the distance is 9 times greater between the dogs and the
rabbit images than between the dogs theirself.
We also compare our method with two recent approaches
which give rise interesting results for several test databases
(see
[6]
and
[37]
for comparative studies):
• The approach of Bernier and Landry
[6]
based on a
polar representation of the contour points with respect
to the centroid of the shape.
• The approach of Zhang and Lu
[37]
defined on the
generic Fourier descriptor transform from a polar-raster
sampled shape image.
Fig. 7. A database of 99 shapes made available by Sharvit on his website
[30].
46 S. Tabbone et al. / Computer Vision and Image Understanding 102 (2006) 42–51
Fig. 1. Binary 2D shapes from the Sharvit B1dataset (99 shapes, 9 classes). Similarly,
the Sharvit B2 contains 216 shapes (12 classes) with the same kind of distorsions.
The interlacement descriptor can also be interpreted as a circular histogram, called theI-histogram. The invariance properties are preserved for the interlace-ment histogram.
5
Experimental study
For this experimental study, the proposed descriptors have been employed for a 2D shape classification task on two datasets of binary shapes followed by a comparative study involving other baseline shape descriptors.
5.1 Datasets
Two shape datasets have been considered to highlight the interest of our proposed enlacement and interlacement shape descriptors.
Sharvit B1 and B2 The first shape dataset is provided by Sharvit et al. [28].
This dataset is decomposed into two independent datasets, B1 that contains 9
categories with 11 binary shapes in each category (see Figure 1) and B2 that
contains 18 categories with 12 shapes in each category. Considering B1, a few
of the shapes are occluded (airplanes and hands) and some shapes are partially represented (rabbits, men, and hands). There are also distorted objects (tools)
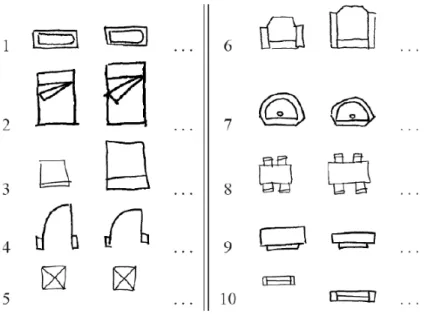
Fig. 2. Samples from the CVC dataset composed of 3000 binary 2D shapes (300 classes) representing various hand-drawn patterns.
and heterogeneous shapes in the same cluster (animals). The dataset B2 also
contains shapes with similar distortions. These two Sharvit sub-datasets are widely used in the literature to compare feature descriptors designed to classify 2D shapes in presence of noise, artifacts and distorted parts.
CVC The second dataset consists of 3000 binary shapes categorized into 10 classes, with equal number of samples in each category (see Figure 2). It is kindly provided by CVC Barcelone. This dataset is composed of complex 2D hand-drawn patterns, with shapes having holes and disconnected parts. The patterns were drawn by ten persons using the Anoto digital pen and paper.
5.2 Experimental protocol
We used the proposed enlacement and interlacement descriptors to classify the binary shapes from the Sharvit and CVC datasets into their corresponding cat-egories. For the first experiment, we studied the influence of the number of directions for our proposed descriptors (as well as there potential combinations) on the Sharvit dataset, since this baseline dataset contains more generic and het-erogeneous shapes. Then, we evaluated the impact of using different classifiers on the larger CVC dataset. For both datasets, we also perform a comparative study with other baseline shape descriptors.
8 M. Clément et al.
Parameter settings For each 2D shape of the datasets, we computed both en-lacement shape descriptorsEA ¯AandEAA¯ , as well as the interlacement descriptor
IA. All these descriptors are computed onto a set of k discrete directions (the
influence of k being studied hereinafter) equally spaced along the [0, π] interval. The resulting feature vectors are used to train different classifiers to recognize the different shape categories from the two datasets. In these experiments, we tested:
– k-nearest neighbors classifiers (k-NN) using the `2 norm on features. The
number of neighbors has been empirically set to k = 1 (for both datasets, using more neighbors did not improve the results, either for majority of weighted votes);
– SVM classifiers following a one-versus-all strategy for multiclass classifica-tion. The soft-margin hyperparameter C was optimized by performing grid search on the training set for each tested features. We report results for SVMs using linear and gaussian kernels.
To better assess the robustness of the approach, this classification process is coupled with a cross validation strategy. For both the Sharvit B1 and B2
datasets, we employed a leave-one-out strategy, as these datasets are relatively small. For the CVC dataset we used a k-fold cross validation strategy with k = 3. That is, the training set representing 2/3 of its total size, while the remaining 1/3 is used for testing, and this process is repeated 3 times so that the whole dataset is classified. For each strategy, we evaluate the classification results using the accuracy score (i.e. the rate of correctly classified shapes).
5.3 Influence of the number of directions
In this first experiment, we studied the influence of the number of discrete direc-tions k ∈ [0, π] when computing the enlacement descriptors EA ¯A and EAA¯ , the
interlacementIA, as well as their combinationsEA ¯AEAA¯ andEA ¯AEAA¯ IA. Note
that when combining descriptors, the size is increased accordingly:EA ¯AEAA¯ has
2k values and EA ¯AEAA¯ IA has 3k values. The different numbers of directions
tested were k∈ {4, 8, 16, 32, 64}. For all of these values, we apply the k-NN clas-sifier with the corresponding descriptors on both Sharvit datasets B1 and B2,
following the leave-one-out cross validation strategy.
Figure 3 presents the evolution of the accuracy scores for these different number of directions, on Sharvit (a) B1 and (b) B2. On B1, we can observe
relatively stable recognition rates for small number of directions, with a slight decrease in performance when using 64 directions. The instability is probably due to the small size of this dataset. For B2, we observe a more homogeneous increase
in accuracy for all features when increasing the number directions, reaching a plateau for 16-32 directions. Overall, experiments with 32 directions seem to be a good compromise between performance and size. This value will therefore be retained for the remainder of the experimental study.
From these results, we can also observe the relative performances of the differ-ent considered features. In particular, we can see that the combinationEA ¯AEAA¯
4 8 16 32 64 Number of directions 0.70 0.75 0.80 0.85 0.90 Accuracy EA ¯A EAA¯ EA ¯AEAA¯ IA IAEA ¯AEAA¯ (a) Sharvit B1 4 8 16 32 64 Number of directions 0.82 0.84 0.86 0.88 0.90 0.92 Accuracy EA ¯A EAA¯ EA ¯AEAA¯ IA IAEA ¯AEAA¯ (b) Sharvit B2
Fig. 3. Accuracy scores for the Sharvit B1 and B2 datasets, for varying number of
directions of the enlacement and interlacement shape descriptors. Classification is per-fomed with k-NN (k = 1) on the `2-norm and using leave-one-out cross validation.
of both enlacement descriptors seems to always improve the results compared to their individual parts. Further combining intoEA ¯AEAA¯ IA again slightly
im-proves performance. This seems to confirm our hypothesis that these descriptors represent complementary rich information, captured both from the shape itself and its background counterpart, that can be useful to better characterize com-plex visual patterns.
5.4 Comparative study and discussion
We now present a comparative study with several commonly used shape de-scriptors from the literature on both datasets. In these experiments, we used the following baseline descriptors:
– Angular Signature (AS) [29]; – Yang [30];
– 7 Moments of Zernike (Zernike7) [18]; – Angular Radial Transform (ART) [31]; – Generic Fourier Descriptors (GFD) [8]; – Force Histograms (F0AA andF2AA) [20].
All these methods result in feature vectors for each shape, and are supposed to be relatively robust to different affine transforms such as translation, rota-tion, or scaling. The five first methods are global shape descriptors, while Force Histograms are based on spatial relations concepts, similarly to our proposed approach. For each of these methods, we use the same experimental protocol de-fined earlier: leave-one-out for Sharvit (with k-NN), and 3-fold cross validation for CVC (with k-NN and SVMs).
In Table 1, we report the accuracy scores obtained on the Sharvit B1 and
B2 datasets for the five baseline methods, and we compare them to our
10 M. Clément et al.
Table 1. Accuracy scores obtained on the Sharvit datasets B1 and B2 with a 1-NN
classification (leave-one-out). On the left are the results for the baseline descriptors. On the right are the results for our proposed enlacement and interlacement descriptors, as well as their combinations. Best and second best scores are respectively depicted in bold and underlined.
Baseline descriptors B1 B2 AS 75.76 67.59 Yang 82.83 81.94 Zernike7 93.94 92.59 ART 93.94 94.44 GFD 95.96 93.06 FAA 0 77.78 74.54 FAA 2 56.57 51.85 Our descriptors B1 B2 EA ¯A 87.88 90.74 EAA¯ 71.72 91.67 IA 78.79 92.13 EA ¯AEAA¯ 89.90 92.13 IAEA ¯AEAA¯ 92.93 92.13
From this Table, we can observe that our proposed shape descriptors provide competitive and comparable results with the tested baseline descriptors. On this dataset, the best accuracy scores were achieved using global descriptors such as GFD, ART or Zernike moments, which can be considered as relevant baselines. Our descriptors that combine pairwise enlacements and also interlacement out-perform common directional based descriptors (i.e. Force HistogramsF0AA and FAA
2 ). Although some shapes present concavities, most of the them are relatively
compact, which can be crippling for our enlacement criterion.
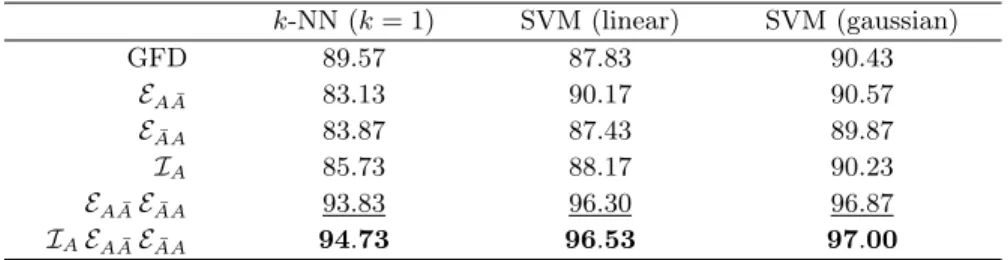
In Table 2 we report the accuracy scores obtained on the larger CVC dataset for the GFD baseline descriptors, and we compare them to our proposed en-lacement and interen-lacement descriptors. Here, we also report results for different classifiers, i.e. k-NN and SVMs with linear and gaussian kernels. On this dataset, our combined enlacement and interlacement features significantly improve upon GFD descriptors (with 36 bins as suggested by [8]. We also found that increas-ing the number of bins for the GFD descriptors to 96 values (i.e. to match the dimensionality of our combined features) results in slightly worse performance (from 0.7% to 4% lower accuracy scores depending on the classifier).
Table 2. Accuracy scores obtained on the CVC dataset with different classifiers (k-NN and SVMs with linear and gaussian kernels), following a 3-fold cross validation. Best and second best scores are respectively depicted in bold and underlined.
k-NN (k = 1) SVM (linear) SVM (gaussian) GFD 89.57 87.83 90.43 EA ¯A 83.13 90.17 90.57 EAA¯ 83.87 87.43 89.87 IA 85.73 88.17 90.23 EA ¯AEAA¯ 93.83 96.30 96.87 IAEA ¯AEAA¯ 94.73 96.53 97.00
The good performance of our method on this dataset can be explained by the fact that the shapes are more complex, usually with multiple line strokes result-ing in many concavities. The enlacement is specifically designed to capture the internal structure of this types of shapes, characterizing the alternating patterns between strokes in different directions. Therefore, our proposed features seem to be more efficient and powerful for this type of application.
6
Conclusion
A new shape descriptor based on the assessment of both enlacement and inter-lacement behavior following a set of directions has been proposed in this paper. Experimental study on three databases attests of the promising interest of such directional descriptors which can easily keep nice properties as homothety, rela-tion and translarela-tion. Further works are dedicated to extending our descriptors by considering, for instance, the skeleton and the remaining medial axis calcu-lated between the shape and the surrounding area. The goal will be to provide a suitable derivative approach to make tests on other complex specific datasets (such as symbols, texts) where the underlying structure is close to the skele-ton (following the width). We plan also to integrate the Chanfrein distance (as in [32]) to better integrate the internal structure of the shape.
References
1. A.K. Jain, R.P.W. Duin, and J. Mao. Statistical pattern recognition: A review. IEEE Transactions on Pattern Analysis and Machine Intelligence, 22(1):4–37, 2000.
2. A.W.M. Smeulders, M. Worring, S. Santini, A. Gupta, and R.C. Jain. Content-based image retrieval at the end of the early years. IEEE Transactions on Pattern Analysis and Machine Intelligence, 22(12):1349–1380, 2000.
3. S. Loncaric. A survey of shape analysis techniques. Pattern Recognition, 31(8):983– 1001, 1998.
4. D. Zhang and G. Lu. Review of shape representation and description techniques. Pattern Recognition, 37(1):1–19, 2004.
5. C.H. Chen. Handbook of Pattern Recognition and Computer Vision. World Scien-tific, 5th edition, 2016.
6. H. Kauppinen, T. Seppänen, and M. Pietikäinen. An experimental comparison of autoregressive and fourier-based descriptors in 2d shape classification. IEEE Transactions on Pattern Analysis and Machine Intelligence, 17(2):201–207, 1995. 7. E. Persoon and K.S. Fu. Shape discrimination using fourier descriptors. IEEE
Transactions on Pattern Analysis and Machine Intelligence, 8(3):388–397, 1986. 8. D. Zhang and G. Lu. Shape-based image retrieval using generic fourier descriptor.
Signal Processing: Image Communication, 17(10):825–848, 2002.
9. F. Mokhtarian and S. Abbasi. Shape similarity retrieval under affine transforms. Pattern Recognition, 35(1):31–41, 2002.
10. C. Urdiales, A. Bandera, and F.S. Hernández. Non-parametric planar shape repre-sentation based on adaptive curvature functions. Pattern Recognition, 35(1):43–53, 2002.
12 M. Clément et al.
11. S.J. Belongie, J. Malik, and J. Puzicha. Shape matching and object recognition using shape contexts. IEEE Transactions on Pattern Analysis and Machine Intel-ligence, 24(4):509–522, 2002.
12. B.B. Kimia, A.R. Tannenbaum, and S.W. Zucker. Shapes, shocks, and deforma-tions I: the components of two-dimensional shape and the reaction-diffusion space. International Journal of Computer Vision, 15(3):189–224, 1995.
13. S.H. Zhu and A.L. Yuille. FORMS: A flexible object recognition and modelling system. International Journal of Computer Vision, 20(3):187–212, 1996.
14. K. Siddiqi, A. Shokoufandeh, S.J. Dickinson, and S.W. Zucker. Shock graphs and shape matching. International Journal of Computer Vision, 35(1):13–32, 1999. 15. C.H. Teh and R.T. Chin. On image analysis by the methods of moments. IEEE
Transactions on Pattern Analysis and Machine Intelligence, 10(4):496–513, 1988. 16. R.R. Bailey and M.D. Srinath. Orthogonal moment features for use with
paramet-ric and non-parametparamet-ric classifiers. IEEE Transactions on Pattern Analysis and Machine Intelligence, 18(4):389–399, 1996.
17. Y. Bin and P. Jia-Xiong. Invariance analysis of improved zernike moments. Journal of Optics A: Pure and Applied Optics, 4(6):606–614, 2002.
18. A. Khotanzad and Y.H. Hong. Invariant image recognition by zernike moments. IEEE Transactions on Pattern Analysis and Machine Intelligence, 12(5):489–497, 1990.
19. F. Ghorbel. A complete invariant description for gray-level images by the harmonic analysis approach. Pattern Recognition Letters, 15(10):1043–1051, 1994.
20. P. Matsakis and L. Wendling. A new way to represent the relative position between areal objects. IEEE Transactions on Pattern Analysis and Machine Intelligence, 21(7):634–643, 1999.
21. P. Matsakis, M. Naeem, and F. Rahbarnia. Introducing the Φ-descriptor - A most versatile relative position descriptor. In ICPRAM, Proceedings, pages 87–98, 2015. 22. A. Delaye and E. Anquetil. Learning of fuzzy spatial relations between handwrit-ten patterns. International Journal of Data Mining, Modelling and Management, 6(2):127–147, 2014.
23. I. Bloch. Fuzzy relative position between objects in image processing: A morpholog-ical approach. IEEE Transactions on Pattern Analysis and Machine Intelligence, 21(7):657–664, 1999.
24. S. Tabbone and L. Wendling. Binary shape normalization using the radon trans-form. In DGCI, Proceedings, pages 184–193, 2003.
25. M. Clément, A. Poulenard, C. Kurtz, and L. Wendling. Directional enlacement histograms for the description of complex spatial configurations between objects. IEEE Transactions on Pattern Analysis and Machine Intelligence, 39(12):2366– 2380, 2017.
26. M. Clément, M. Coustaty, C. Kurtz, and L. Wendling. Local enlacement histograms for historical drop caps style recognition. In ICDAR, Proceedings, pages 299–304, 2017.
27. M. Clément, C. Kurtz, and L. Wendling. Fuzzy directional enlacement landscapes. In DGCI, Proceedings, pages 171–182, 2017.
28. D. Sharvit, J. Chan, H. Tek, and B.B. Kimia. Symmetry-based indexing of image databases. Journal of Visual Communication and Image Representation, 9(4):366– 380, 1998.
29. T. Bernier and J.A. Landry. A new method for representing and matching shapes of natural objects. Pattern Recognition, 36(8):1711–1723, 2003.
30. S. Yang. Symbol recognition via statistical integration of pixel-level constraint his-tograms: A new descriptor. IEEE Transactions on Pattern Analysis and Machine Intelligence, 27(2):278–281, 2005.
31. W.Y. Kim. A new region-based shape descriptor. ISO/IEC MPEG99/M5472, 1999.
32. S. Tabbone, L. Wendling, and J.P. Salmon. A new shape descriptor defined on the radon transform. Computer Vision and Image Understanding, 102(1):42–51, 2006.
![Fig. 7. A database of 99 shapes made available by Sharvit on his website [30].](https://thumb-eu.123doks.com/thumbv2/123doknet/14867048.637964/7.918.232.667.154.490/fig-database-shapes-available-sharvit-website.webp)