Prevalence of iodine inadequacy in Switzerland assessed
by the estimated average requirement cut-point method in
relation to the impact of iodized salt
Max Haldimann
1,*, Murielle Bochud
2, Michel Burnier
3, Fred Paccaud
2and Vincent
Dudler
11Federal Food Safety and Veterinary Office, Division of Risk Assessment, Laboratories, Schwarzenburgstrasse 155, 3003 Bern, Switzerland:2Institute of Social and Preventive Medicine, Lausanne University Hospital, Lausanne, Switzerland:3Service of Nephrology and Hypertension, Lausanne University Hospital, Lausanne, Switzerland Submitted 14 February 2014: Final revision received 22 July 2014: Accepted 12 August 2014: First published online 18 September 2014
Abstract
Objective: To assess the iodine status of Swiss population groups and to evaluate the influence of iodized salt as a vector for iodine fortification.
Design: The relationship between 24 h urinary iodine and Na excretions was assessed in the general population after correcting for confounders. Single-day intakes were estimated assuming that 92 % of dietary iodine was excreted in 24 h urine. Usual intake distributions were derived for male and female population groups after adjustment for within-subject variability. The estimated average requirement (EAR) cut-point method was applied as guidance to assess the inadequacy of the iodine supply.
Setting: Public health strategies to reduce the dietary salt intake in the general population may affect its iodine supply.
Subjects: The study population (1481 volunteers, aged≥15 years) was randomly selected from three different linguistic regions of Switzerland.
Results: The 24 h urine samples from 1420 participants were determined to be properly collected. Mean iodine intakes obtained for men (n 705) and women (n 715) were 179 (SD68·1) µg/d and 138 (SD57·8) µg/d, respectively. Urinary Na
and Ca, and BMI were significantly and positively associated with higher iodine intake, as were men and non-smokers. Fifty-four per cent of the total iodine intake originated from iodized salt. The prevalence of inadequate iodine intake as estimated by the EAR cut-point method was 2 % for men and 14 % for women. Conclusions: The estimated prevalence of inadequate iodine intake was within the optimal target range of 2–3 % for men, but not for women.
Keywords Estimated average requirement Iodine Adjusted intake distribution Iodized salt
Iodine is essential to living organisms, in which it is actively concentrated in the thyroid gland. Iodine is an intramolecular component for the biosynthesis of the thyroid hormones, which are iodo-organic biomolecules relying on halogen bonding(1,2). Thyroid hormones regulate cell growth and differentiation, and increase the metabolism of proteins, lipids and carbohydrates. Insufficient iodine intake may lead to goitre and hypothyroidism in adults and to poor preg-nancy outcomes in pregnant women. In infants and children, thyroid hormones have an effect on growth and develop-ment. One of the most damaging and irreversible effects of iodine deficiency involves the developing brain. Even mild iodine deficiency seems to be causally involved in cognitive impairment in children(3,4). Children of severely iodine-deficient mothers are at risk for cognitive disability; however, less is known about the effects of mild-to-moderate
deficiency in pregnancy. Two recent studies found asso-ciations between mild-to-moderate iodine deficiency in pregnancy and poorer cognition in children(5,6). Despite such consequences, iodine deficiency persists in some parts of the world and has been recognized as cause of pre-ventable mental defects affecting humans worldwide(7).
The iodine status of a population is typically measured by urinary iodine concentrations (UIC). In particular, 24 h urinary iodine measurements reflect an individual’s daily iodine excretion, whichfluctuates considerably from day to day as a result of daily variations in dietary iodine intake(8). The corresponding daily dietary iodine intake can be derived because ingested iodine is predominantly (>90 %) excreted in the urine(9). Several reference values
exist for iodine intake and are collectively referred to as dietary reference intakes, such as the estimated average
requirement (EAR)(10)and the WHO criteria(11). The EAR is particularly useful for evaluating the possible adequacy of iodine intakes in population groups(12).
In Switzerland, iodine intake is intrinsically linked with salt, which is the carrier for iodine fortification, and thus salt reduction is expected to affect iodine intake. Therefore, a dietary salt reduction will require adaptations to the Swiss intervention strategy, e.g. increasing the iodine content in salt to compensate for the lower salt intake and ensuring high penetration rates of iodized salt in processed food.
In the current investigation we took advantage of the nationwide Swiss survey on salt intake(13)in which iodine was measured in 24 h urine samples as a complement to Na. The combined analyses of urinary iodine and Na in a large cohort allow sensitive examination of iodine nutrition and determining the contribution of iodized salt to it. The survey on salt intake was part of the Swiss Salt Strategy, which was developed following a recommen-dation of the WHO that a population should have a salt intake of 5 g/d(14). Worldwide, most people consume much more salt than the physiological minimum needed for life(15) and excessive Na intake is involved in hyper-tension and CVD(16). For this reason, population-based salt reduction programmes are a key element of public health policies and essential to reduce the burden of non-communicable diseases(17).
Ideally, iodized salt as a complement to iodine already contained in food meets the needs of almost all of the consumers. Switzerland was among the pioneering countries with a legal implementation of salt iodization in 1922 at a level of 3·75 mg/kg. Since then, the level of iodine in salt has been gradually increased, but for more than a decade it was kept at a level of 20 mg/kg(18) and subsequently on 1 January 2014, the iodine concentration in commercial salt was increased to 25 mg/kg following the recommendations of the Swiss Federal Commission for Nutrition(19). At a fortification level of 20 mg/kg, iodine intakes of infants, lactating women and women of repro-ductive age are borderline sufficient(20). By contrast, the
kind of salt used in households and for food production is on a voluntary basis. The objectives of the present work were to estimate the prevalence of iodine inadequacy in Switzerland and to infer an appropriate level of salt iodization based on the relationship between urinary iodine and Na excretions in a population-based sample of people aged 15 years and over.
Methods
Study design and participants
The iodine study was realized as part of the Swiss survey on salt intake, which was carried out between January 2010 and April 2012. The Institute of Social and Preventive Medicine, Lausanne University Hospital coordinated the survey. Nine study centres at cantonal hospitals from
different Swiss regions recruited participants from local populations based on a two-level sampling strategy. Par-ticipants were eligible for inclusion if they were≥15 years of age and permanent residents in Switzerland. Each study centre recruited participants from the local population and aimed at including the same number of people in each of the eight predefined gender and age strata, i.e. 15–29, 30–44, 45–59 and ≥60 years of age in men and women. The Federal Statistical Office provided separately for each canton a list of randomly selected households (first level). The selected households received information letters and were subsequently contacted by telephone. Thus, information on the composition of each household was obtained. Finally, one person per household was ran-domly selected (second level) and invited to participate in the study.
Informed written consent was obtained from all individuals before participation. Due to randomness, the selection included persons dwelling in both urban and rural commu-nities, minimizing biases due to age, gender, socio-economic and cultural influences. The study report describes the design in more detail(13). This multicentre study was conducted according to the guidelines laid down in the Declaration of Helsinki and all procedures involving human subjects were approved by nine local ethics committees.
The participants were instructed to collect urine for 24 h and to bring it to the local centre. Urinary volumes were normalized to a standard 24 h output using a time correction factor based on duration of urine collection. Two criteria for judging incompleteness were applied: (i) participants with urinary creatinine excretions of less than 5 mmol/d (<0·57 g/d); and (ii) participants with urinary creatinine excretions of less than 6 mmol/d (<0·68 g/d) together with a urine volume of less than 1000 ml(21). These criteria were previously validated on an independent sam-ple and showed excellent specificity(22). Participants who
did not meet these criteria, stated that their urine collection was incomplete or reported to take medications containing iodine were excluded. To assess reproducibility, a subset of study participants from seven study centres provided a second 24 h urine collection on the following day. The percentage of participants who provided a second collection was comparatively small (<4 %). Funding sources did not allow the collection of multiple 24 h urine samples for all participants.
Analytical methods
UIC were measured by a previously developed, isotope dilution, inductively coupled plasma–mass spectrometry method, which consists of the measurement of the ratio (127I:129I) between the natural sample iodine (127I) and the isotopically labelled analogue iodine (129I)(23). Iodine is susceptible to varying matrix effects in urine; however, the signal intensities of 127I and 129I are affected to the same extent, so that the measured ratio is not changed. Modifications to the published method consisted of the
use of the stabilizer tetramethylammonium hydroxide and simplified calculations(24). A urine quality control sample (NIST SRM 2670a, certified iodine content 88·2 (SD1·1) µg/l;
National Institute of Standards and Technology, Gaithers-burg, MD, USA) was included in every run. The mean and 95 % confidence limit of observed values was 88·4 (0·73) µg/l (n 129) for the certified reference material. The urinary parameters Na, Ca and creatinine were measured centrally in the clinical chemistry laboratory of the Lausanne Uni-versity Hospital, which is regularly checked by the Swiss Center for Quality Control.
Statistical analysis and data treatment
Systat 13·0 statistical software (Systat, Chicago, IL, USA) was used for the data analysis. The general linear model (‘GLM’) procedure in Systat software was performed to identify the explanatory variables that made an important contribution to the variability of iodine intake, which was represented by the urinary iodine excretion. Iodine excretions were extrapolated back to dietary intakes under the assumption that 92 % of the absorbed iodine appears subsequently in the 24 h collections(25). The iodine intake was set as response variable and the variables gender, smoking (never, former, current), region (study centres), urinary Na excretion, age, BMI, date of sampling (as a proxy for season) and urinary Ca excretion were included as explanatory variables. The initial model included each of the main effects as well as the three two-way and one three-way interactions. Backward stepwise elimination of statistically non-significant terms was used to obtain the final model, i.e. variables with P values <0·15 were retained. The aptness of the GLM model was evaluated graphically, homoscedasticity was checked by plotting the standardized residuals against predicted iodine values, and probability plots were examined for assessing normality of the residuals. The statistical GLM analysis was performed after exclusion of cases due to missing descriptive data or high residuals. In addition, high iodine intakes that did not result from food were excluded from the statistical analysis.
Calculation of the contribution of iodized salt to the total iodine intake
Predicted values of the dependent variable iodine intake were calculated based on the GLM model. Simple linear regression was used to fit the predicted iodine intakes and the observed urinary Na excretions. The intercept was the predicted value of the iodine intake when the Na excretion is zero, i.e. the intercept yields the contribution to the total iodine intake that does not depend on Na(26). Information on the relative contribution of dietary Na was needed to differentiate between naturally inherent and added Na. Concentration values of inherent Na were col-lected from the Swiss food composition database(27). Food supply data(28) provided estimates of food availability, which gave a crude impression of average consumption.
Estimates of actual food consumptions were combined with data on the inherent Na concentration for the relevant food considered. Summarizing the inherent to food Na con-tributions from the most consumed foods yielded the per capita dietary intake of Na, which is independent of added salt. Urinary Na was considered an indicator for dietary Na(29) and thus the average Na intake of the population was obtained. The former was subtracted from the latter to derive an estimate of the Na (salt) contributed by pro-cessing, cooking or table salt.
Estimated average requirement cut-point method The EAR cut-point method was proposed by Beaton(30) and described in detail and validated by subcommittees of the Institute of Medicine (USA)(31). The method requires knowledge of the median requirement, i.e. the EAR value, for iodine and the distribution of usual intakes. The EAR represents the average daily iodine intake level estimated to meet the requirements of half the healthy individuals in a life stage and gender group, i.e. the risk of inadequacy is 50 %. The iodine EAR for men and women aged 19 to >70 years is set at 95 µg/d(10).
Accordingly, the prevalence of inadequate iodine intakes was assessed by estimating the proportion of participants with intakes below the EAR. Single-day dietary intake dis-tributions do not reflect the usual intakes of individuals because daily iodine intakes vary according to the amounts and types of foods consumed. Therefore, adjustment of the distribution is necessary to reduce the within-person variability and represent usual intakes within the study population more accurately. The US National Cancer Institute (NCI) developed a non-linear mixed-effect model and quantile estimation procedure that was used for this purpose(32). The NCI model was extended with Na excre-tion as a three-level covariate (0– < 3, 3– < 6 and 6–9 g Na/d). A Box–Cox parameter was estimated as part of the method, which transformed the dependent variable to nor-mality conditionally on the covariates. The statistical soft-ware package SAS version 9·2 was used to run the macros ‘Mixtran’ and ‘Distrib’, which were available from NCI(33).
They were run to estimate the distribution of usual iodine intake in the population from repeat 24 h urine collections. The method requires a minimum of two dietary assessments on a representative subset of individuals in each group. The NCI did not specify the minimum size of the subset. In general, procedures for estimating usual intake distribu-tions require independent repeat samples from at least some individuals in the population sample(34). In the case of iodine, 24 h urine samples on consecutive days are not likely to be biased as a result of a carryover effect(35). The probabilities of the prevalence of inadequacy were calculated with @Risk 5·7 risk analysis software (Palisades, Ithaca, NY, USA). In addition, the bestfit function of this program was used to determine the parametric distribution most closely representing the distribution of the dietary iodine intakes.
In addition, the SAS MI (multiple imputation) MCMC (Markov chain Monte Carlo) procedure forfilling missing data by simulating random samples was applied for the statistical verification of the relevance of the number of replicate collections(36). Imputation does not attempt to estimate each missing value through simulated values but rather to represent a random sample of the missing values. This process results in valid statistical inferences. The replicate collections of 24 h urine samples were regarded as a Markov chain, which is a sequence of random values with each depending on its predecessor, i.e. the replicate sampling was regarded as a time-series sequence.
Thus, within-person variations were obtained as if each study participant provided a second 24 h urine collection. Subsequently, the NCI method was applied based on data sets which contained measured replicate values for iodine and Na and simulated replicate data for individuals who did not provide a second 24 h urine collection.
Results
Estimated dietary iodine intake
A total of 1481 daily urine samples were collected from the participants but forty-nine were excluded because of assumed incomplete urine collection. Human exposure to iodine can result from sources other than dietary, e.g. a few participants were identified who underwent treatment with anti-arrhythmic agents that contain covalently bound iodine. In total, twelve study participants had excessive iodine excretions corresponding to iodine intakes in the range of 473 to 11 780µg/d, and were also excluded. The
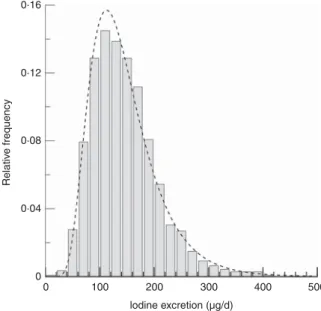
urinary iodine excretion, distribution parameters and all other basic data are summarized in Table 1 and displayed graphically in Fig. 1 for the remaining 1420 participants, who were eligible for analysis. From these participants, fifty-four provided a second 24 h urine collection.
An adult following the dietary recommendations of the WHO will have a daily intake of 150µg of iodine. Accordingly, the median estimated 24 h iodine population Table 1 Sample characteristics and distribution parameters at the time of 24 h urine collections within the 2010–2012 period; random sample of residents≥15 years of age (n 1420) from three different linguistic regions of Switzerland
Women Men Both genders
Parameter collections/adjustment Median Mean SD n Median Mean SD n Median Mean SD n 1st collection*
Age (years) 45·7 18·0 715 47·7 18·5 705 46·7 18·2 1420
BMI (kg/m2) 24·4 4·9 712 26·0 4·2 702 25·2 4·7 1414
24 h urine volume, corrected (l) 2·04 0·91 715 1·92 0·90 705 1·98 0·90 1420
Urinary iodine concentration (µg/l) 62·5 74·0 42·2 715 90·6 101·4 54·5 705 75·7 87·6 50·6 1420 Single-day iodine intake (µg/d) 128·2 138·2 57·8 715 171·1 179·3 68·1 705 148·3 158·6 66·4 1420 Urinary Na excretion (g) 2·96 3·14 1·31 715 4·06 4·18 1·58 705 3·43 3·66 1·54 1420 Urine Ca excretion (g) 0·13 0·14 0·08 715 0·17 0·18 0·10 705 0·15 0·16 0·09 1420 2nd collection, subset*
Age (years) 40·8 14·2 26 45·0 16·5 28 43·0 15·4 54
BMI (kg/m2) 24·7 4·8 26 26·1 5·4 28 25·4 5·2 54
24 h urine volume, corrected (l) 1·73 0·75 26 1·77 0·73 28 1·76 0·74 54
Urinary iodine concentration (µg/l) 71·8 89·4 69·0 26 99·1 100·1 46·4 28 77·4 94·7 58·1 54 Single-day iodine intake (µg/d) 121·6 135·5 53·0 26 165·7 176·2 75·3 28 136·3 156·6 68·2 54 Urinary Na excretion (g) 2·88 2·99 0·95 26 3·51 4·0 1·58 28 3·29 3·53 1·40 54 Urinary Ca excretion (g) 0·14 0·14 0·06 26 0·20 0·23 0·12 28 0·17 0·18 0·10 54 Adjusted daily iodine intakes
Usual iodine intake† (µg/d) 132 138 40·8 174 179 48·6
Simulated iodine intake‡ (µg/d) 134 136 41·3 175 179 46·0
*The duplicate samples from men and women were weakly correlated, with coefficients of correlation of 0·62 (P < 0·01) and 0·42 (P = 0·03), respectively. †Adjusted distribution according to the National Cancer Institute (NCI) method.
‡Markov chain Monte Carlo simulations of replicate iodine intakes for participants who did not provide a second collection and subsequent application of the NCI method on the completed data set.
0.16 0.12 0.08 0.04 Relativ e frequency 0 0 100 200 300 400 500 lodine excretion (µg/d)
Fig. 1 Relative frequency distribution of 24 h iodine excretion (µg/d) data of the study population (random sample of residents ≥15 years of age (n 1420) from three different linguistic regions of Switzerland, 2010–2012). The distribution is unimodal and slightly skewed (Pχ2lognormal= 0·3), with no outliers
intake of 148·2 µg/d corresponded approximately to the recommended daily intake of iodine (Table 1).
Factors influencing dietary iodine intake
The GLM model (n 1396) revealed that dietary iodine intake was significantly related to Na and Ca excretion, BMI, region, smoking, date of urine collection and gender, but clearly Na was the most significant variable (P< 0·001). In contrast, dietary iodine intake proved to be unrelated to age (P= 0·66) in the GLM analysis. After adjusting for region, smoking, date of urine collection and gender, higher BMI and higher Na and Ca excretions were all positively associated with increased iodine intakes. Among the categorical variables there was a significant interaction between smoking and gender (P= 0·018). The statistically significant interaction term means that the dietary iodine intake associated with smoking differs between men and women. In both gender groups, smokers had a lower iodine intake. An adjusted squared multiple correlation (R2) of 0·39 was obtained, which indicated that the GLM model predicts the data well. Non-linear transfor-mations of originally recorded variables were not necessary. Coefficients of the GLM model are shown in Table 2. Other variables were not included in the model due to lack of previous evidence for an association or multicollinearity, e.g. language of the participants.
Impact of iodized salt on the dietary iodine intake To assess the efficacy of salt as a carrier of iodine, it is important to know the contribution of iodized salt to the
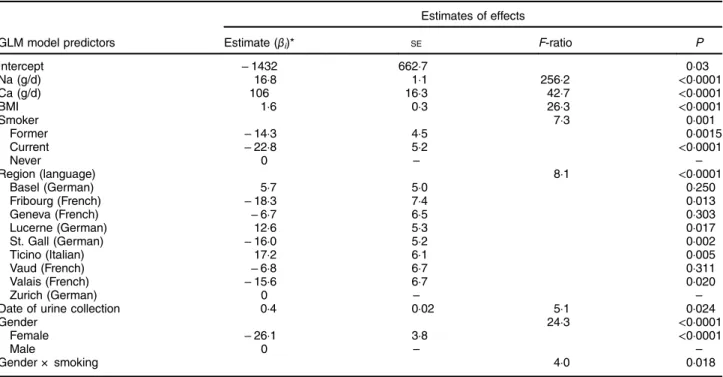
daily iodine intake. The GLM model allows for an estimate of the dependent variable iodine intake for the experi-mentally measured Na excretions, which represent salt consumption of individuals. As depicted in Fig. 2, a dependency on Na existed for urinary iodine, expressed as daily intake. Under the assumption that the iodine response is adequately described by the variable Na (r= 0·88), the intercept of 73·4 (SD 1·3) µg partitions the
dietary iodine intake and represents the portion that does not depend on iodized salt because it is inherent in food. Subtracting the inherent dietary iodine contribution of 73·4 µg from the total intake of 158·6 µg yields the com-plementary iodine quantity of 85·2 µg, which originated from iodized salt. Accordingly, the proportionate amount of 54 % of the dietary iodine intake can be attributed to iodized salt. As for iodine, the Na intake can also be partitioned. If iodized salt contained 20µg iodine/g, a mass of 4·26 g iodized salt that is equivalent to 1·66 g of Na would correspond to 85·2 µg of iodine. As depicted in Fig. 2, the 1·66 g fraction of the mean Na intake (3·7 g) suggests that approximately 45 % of the Na originated from iodized salt, which appears plausible in the light of the fact that only about half of all salt sold in Switzerland is iodized(19).
As for iodine, food contains Na that is independent of added salt. Approximately 0·4 g or 12 % of the total Na intake corresponds to inherent Na. Consequently, the dietary intake of inherent Na is relatively small and sug-gests that on the population basis only a small fraction of Na is not associated with salt (Fig. 2).
Table 2 Summary of the variables considered for inclusion in the general linear model (GLM) of factors influencing the dependent variable actual dietary iodine intake
Estimates of effects
GLM model predictors Estimate (βi)* SE F-ratio P
Intercept − 1432 662·7 0·03 Na (g/d) 16·8 1·1 256·2 <0·0001 Ca (g/d) 106 16·3 42·7 <0·0001 BMI 1·6 0·3 26·3 <0·0001 Smoker 7·3 0·001 Former − 14·3 4·5 0·0015 Current − 22·8 5·2 <0·0001 Never 0 – – Region (language) 8·1 <0·0001 Basel (German) 5·7 5·0 0·250 Fribourg (French) − 18·3 7·4 0·013 Geneva (French) − 6·7 6·5 0·303 Lucerne (German) 12·6 5·3 0·017 St. Gall (German) − 16·0 5·2 0·002 Ticino (Italian) 17·2 6·1 0·005 Vaud (French) − 6·8 6·7 0·311 Valais (French) − 15·6 6·7 0·020 Zurich (German) 0 – –
Date of urine collection 0·4 0·02 5·1 0·024
Gender 24·3 <0·0001
Female − 26·1 3·8 <0·0001
Male 0 – –
Gender × smoking 4·0 0·018
In principle, the above statistical method could also be applied for Ca excretion to estimate the proportion of the dietary iodine intake that is attributed to Ca-rich foods; however, the correlation was inferior (r= 0·55) to that obtained with Na. Consequently, uncertainty in the deter-mination of the intercept did not result in meaningful partitions of the iodine intake.
The estimated average requirement in assessment of gender groups
The prevalence of inadequate iodine intakes was estimated for male and female gender groups. As age did not explain a significant proportion of the variance in iodine intakes, the adult groups were not further subdivided into additional life-stage categories. To obtain usual iodine intake distributions, single-day distributions were adjusted for within-subject variation according to the NCI method, which was based on sub-samples of repeats of 24 h urine collections from both gender groups(37). Within- to between-subject variability ratios of 1·2 and 1·1 were obtained in men and women, respectively, which indicates that there is more variability within individuals than there is between them. It is important that the sub-samples are representative of the larger population groups on the key attribute that might affect the outcome, i.e. the iodine intake was the characteristic used for adjusting the distributions. In this respect, the
sub-samples were comparable with the population samples because the 95 % confidence interval of iodine intakes for men and women, 147–205 µg and 114–157 µg, respectively, include the mean values of the population samples (Table 1). The shapes of each of the two distributions for men and women, respectively, in Fig. 3 are quite different. The spread of the resulting adjusted distributions of both gender groups is smaller and approached symmetry. A posteriori NCI analysis on replicate data generated for each participant by MCMC simulation did not change the parameters of the distributions (Table 1). 350 300 250 200 150 100 50 0 0 2 4 6 8 10 12 Inherent Na (0.4 g/d)
Avg iodine intake 158.6 µg/d Iodine from salt Inherent iodine Avg Na intake 3.7 g/d 73.4 µg/d
Adjusted iodine intak
e (µg/d)
Na intake (g/d)
Fig. 2 Regression line drawn on scatter diagram relating sodium excretion/intake and adjusted estimated iodine intake of the study population (random sample of residents≥15 years of age (n 1420) from three different linguistic regions of Switzerland, 2010–2012): Iodine intake = 73·4 ± 1·3 + 3·66 × 23·0 ± 0·34 (r = 0·88). The intercept of 73·4 µg denotes the fraction of the total iodine intake that is inherent in food and does not depend on iodized salt. The complementary fraction to the total iodine intake represents the contribution from iodized salt. The fraction of inherent sodium was obtained from food supply data and the food composition database
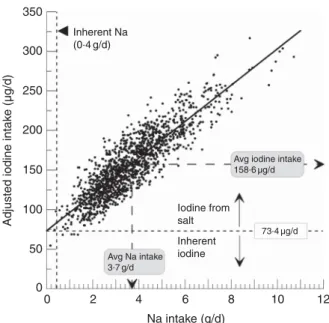
0 100 200 300 400 500 EAR cut-point: 95 µg Women Men F requency of intak es F requency of intak es 21 % 14 % 5 % 2 % Iodine Intake (µg/d)
Fig. 3 Application of the US National Cancer Institute method to estimate the distribution of usual iodine intake for females and males of the study population (random sample of residents ≥15 years of age (n 1420) from three different linguistic regions of Switzerland, 2010–2012). The usual intake distributions (———) were obtained from single-day intake data (– – – – –) adjusted for repeated measures. The fractions below the estimated average intake (EAR) of 95µg iodine/d correspond to the prevalence of inadequacy. The black shaded areas represent the prevalence of inadequacy in women (14 %) and in men (2 %) after adjustment. The grey plus black shaded areas represent the prevalence of inadequacy in women (21 %) and in men (5 %) based on single-day intakes
More importantly, the estimated prevalence of inade-quacy, i.e. percentages of individuals with usual intakes less than the EAR of 95µg/d, were 2 % and 14 % for men and women, respectively. A residual risk of inadequate iodine intake between 2 and 3 % is still acceptable and can be regarded as a target value(38). Even though a seemingly small proportion of women are at risk of an inadequate dietary iodine intake, the estimated prevalence of inade-quacy clearly exceeds the target value.
According to the WHO, median UIC is the main indi-cator to be used to assess iodine status of a population. In the general population it should be within the range 100–199 μg/l(11). Applying the WHO criteria, the median UIC is far below the recommended range and thus based on this Switzerland would be epidemiologically classified as mildly deficient with an insufficient iodine intake, because it falls into the range of 50–99 µg/l (Table 1). The potential dilution effect from large urine volumes of about 2 litres (Table 1) suggests that the percentage below the EAR threshold may be a more accurate reflection of the extent of iodine deficiency than the approach of com-paring a median UIC with the current WHO criteria(39,40). Discussion
Thefindings supported the generally accepted notion that iodine intakes from food alone do not meet the needs in a substantial proportion of the Swiss population. Salt iodi-zation is a suitable approach to making up the difference between usual dietary iodine intakes and requirements of population groups. Of the salt consumed, 70 to 80 % comes from processed industrial foods. Iodized salt used in home cooking and at the table represents only a small part of the total iodine intake(20). The strong correlation between Na and iodine as shown in Fig. 2 reveals the composite nature of salt and iodine intake and illustrates the effect of a potential salt reduction on the iodine intake. For example, if the population adopted a diet that is sodium-healthy, and consumes no more than 5 g salt/d (2 g Na/d) as recommended by the WHO, the iodine intake would drop to approximately 120μg/d. Thus iodized salt was identified as the key nutritional source which is responsible for about 54 % of the iodine intake.
Even though the uptake, storage and release processes of Ca are regulated through a complex hormonally influenced mechanism(41), Ca excretion was a significant predictor of the iodine intake. In adults, Ca intake can be associated with urinary Ca excretion(42). Milk as part of the everyday diet contains high Ca levels and is also a major source of iodine(43). Therefore, Ca is a contrasting but complementary variable because it might refer to a class of iodine-rich foods that are not related to iodized salt(44). In Switzerland, milk and milk products are next to bread in contributing to the dietary iodine intake(45).
Lifestyle, anthropometric and geographic factors, such as smoking, BMI or region, were included in the analysis
because they were significantly related to dietary iodine intake and improved the fit of the GLM model. Even though inclusion of study participants was made according to age, this variable was not significantly associated with the dietary iodine intake, a fact that was also observed in large-sample 24 h iodine studies(46). Smoking has various effects on thyroid function(47,48); e.g. thiocyanate, a major component of smoke, inhibits iodine uptake by the thyroid and may lead to increased excretion of iodine(49). However, the relationship between smoking and thyroid function is commonly confounded by iodine intake(50). In the present study, smokers had a significantly lower iodine intake compared with non-smokers. In general, smokers tend to have lower nutrient intakes(51). The effect of region may indicate mere nutritive differences due to the distinct cultural differences that exist among the three main language areas in Switzerland.
A single 24 h urine collection is not a satisfactory indi-cator of usual iodine intake because it varies considerably for each individual with time. In individuals, there may be as much as a threefold variation in day-to-day 24 h iodine excretion(35). Therefore, the distribution of usual intakes was derived to assess the prevalence of inadequate iodine intake in a group of individuals. The reduction of the day-to-day variability had a marked effect on the resulting distributions of usual iodine intakes and consequently the adjusted dis-tributions showed lower prevalence of inadequacy across the gender groups (Fig. 3). Thus, the accuracy of assessment of adequate iodine intakes depends on meaningful esti-mates of the usual iodine intake distribution. In practice, the mean bias of the NCI method as it relates to estimating the distribution of usual intakes is small(52). But in any case, application of the EAR prevalence approach for iodine needs to be validated in future studies.
A limitation of the present study was that only a relatively small number of participants (3·8 %) collected replicate 24 h urine samples. In principle, the NCI method accounts for incomplete cases and reduces the potential biases due to this limitation. Applying MCMC imputation, the unknown missing replicate data were replaced by sets of simulated values and analysed by the NCI method, which provided adjusted distributions for both gender groups (Table 1). As a result, the parameters of the simulated distributions did not differ from those obtained with small subsets of replicates (Table 1). Therefore, the number of participants with replicates was not critical, contrary to increasing the number of replicate samples for each individual, which may have an effect on the prevalence estimate(37). The third US National Health and Nutrition Examination Survey (NHANES III) collected two observations on individuals and the proportion with a second dietary intake observation was only 5 %(53). As demonstrated, even a comparatively small subset of two 24 h urine collections can significantly reduce the bias in the prevalence estimate due to within-subject variability (Fig. 3). An advantage of the NCI method was that it permits controlling for variables that may influence
variability. In this respect, urinary Na excretion was a sig-nificant fixed factor which accommodated the differences in iodine intake that occur between Na intake levels.
Although the median UIC is a common population indi-cator of iodine status (Table 1), this information is inap-propriate to assess the prevalence of inadequacy. As depicted in Fig. 3, the prevalence of inadequacy depends on the shape and variation of the usual intake distribution, rather than on mean or median intake of population groups. Therefore, the distribution of intakes was examined to determine the pro-portion of the population below the EAR. Less than 2 % of men had intakes below the EAR of 95µg/d, indicating that iodine nutrition is not likely to be a problem for adult males. About 14 % of adult women, however, had intakes below the EAR, which is higher than the commonly accepted pre-valence of inadequacy of about 2–3 %. This finding is in accordance with a recent Swiss survey in which women of reproductive age had borderline low iodine intakes(20).
Apparently, there is an inconsistency between the EAR cut-point method and the criteria endorsed by WHO for the assessment of optimal iodine status. According to the EAR cut-point method, the proportion of individuals with an inadequate iodine intake was negligible for men and relatively small for women. Even though 14 % of the women are at risk of inadequate iodine intake, overall, the results suggest that most people living in Switzerland are able to obtain sufficient iodine from their daily diet. Conversely, iodine deficiency is defined by the WHO as a population median UIC that falls below 100μg/l. As pointed out before, the median UIC in the present study was 76μg/l and denotes a mildly iodine-deficient popu-lation. In fact, the median UIC cut-off value of 100µg/l was evaluated from a relationship between goitre rate and urinary iodine excretion(54), which may overestimate the inadequacy of iodine status in adults(40). Considering an adult-specific cut-off range between 60 and 70 µg/l(40)
instead of the WHO criteria, the Swiss population has at least a borderline sufficient iodine status and cannot be regarded as iodine deficient.
A serious problem could arise when the implementation of a salt reduction programme proves to be effective and the iodine intake contribution from iodized salt is reduced accordingly(55,56). Iodine intake from salt con-taining 20 mg/kg would fall substantially short of meeting the iodine requirements, particularly for women. The present study showed that women need a nutritional intervention to avoid detrimental effects of lowering salt intake. Consequently, the amount of iodine in salt would need to be increased, thus affecting approximately 54 % of the current iodine intake. By increasing the iodine con-centration in salt, the adjusted iodine intake distribution curve (Fig. 3) is shifted to the right without changing its shape and allows predictive modelling of the prevalence of iodine inadequacy according to the EAR cut-point method. If the current iodine level in salt of 20 mg/kg was increased by 5 mg/kg, this would considerably lower the
prevalence of inadequacy to<4 % for women (<0·2 % for men), which is close to the target range. For women and men, the corresponding 95th percentiles are 232µg/d and 291µg/d, respectively. These values do not indicate excessive intakes and are well below the tolerable upper intake level of 600µg iodine/d(57).
The use of iodized salt in processed foods, e.g. bread, modulates the dietary iodine intake to a large extent. Aside from iodized salt, only milk and its products constitute a considerable part of the iodine intake(19). Marinefish, the highest natural source of iodine, and other foods con-tribute only a small proportion of the total iodine intake(45). Nutritional supplements are an insignificant source of iodine because vitamin and mineral formula-tions available in Switzerland do not normally contain iodine(19). In addition, a recent study states that only 15 % of pregnant women were taking supplements containing iodine(20). Therefore, salt intake should be reduced without compromising iodine fortification. Adapting iodine levels in salt is, however, a one-sided approach. Alternatively, an increase in the proportion of processed foods using iodized salt will also have a compensatory effect on the iodine intake, in particular as the estimated contribution of 54 % from iodized salt is relatively low. Therefore the share of iodized salt in the total amount of salt contained in pro-cessed foods could be further improved. Trends in indus-trialized countries show that individuals are consuming most of their salt through processed foods(58).
Conclusions
By resorting to a probabilistic scheme as proposed by the dietary reference intakes committee, exact proportions of individuals whose intakes are less than the EAR are obtained. The estimated prevalence of inadequate iodine intake was within the optimal target range of 2–3 % in men, but not in women (14 %), in this Swiss population-based sample. In view of expected short-term changes in salt intake affecting the usual dietary iodine intakes of adults, we advocate the increase of the iodine level in salt from 20 to 25 mg/kg, in order to provide sufficient iodine supply to the population, in particular to women of childbearing age. At the same time, the voluntary use of iodized salt in the production of foods should be pro-moted. Both are important strategies to ensure sufficient iodine intake in the population. However, it is impossible to predict whether an increase of the iodine level in salt or dispersion of iodine in food will be more effective.
Future studies are necessary to monitor the effects of a higher iodine level in salt with concurrent reduction of salt intake. In any case, iodine fortification factors have to be considered as an integral part of salt reduction pro-grammes, e.g. foods consumed, salt and food iodine sources, appropriate iodine requirements of the popula-tion and vulnerable populapopula-tion groups (children, pregnant and lactating women).
Acknowledgements
Acknowledgements: The authors thank Maria Andersson for her advice on the manuscript and Annabelle Blanc for laboratory assistance. They also thank the study colla-borators for their participation in data collection: Isabelle Binet, David Conen, Paul Erne, Luca Gabutti, Augusto Gallino, Idris Guessous, Daniel Hayoz, Pascal Meier, Franco Muggli, Antoinette Péchère-Bertschi and Paolo M. Suter. Financial support: The Swiss Salt Survey was fun-ded by the Food Safety Department of the Swiss Federal Office of Public Health (FOPH). Support for additional laboratory analyses was also provided by FOPH and the University Hospital Lausanne. On 1 January 2014, the Food Safety Department of the FOPH was affiliated to the Swiss Federal Food Safety and Veterinary Office. The funders had no role in the design, analysis or writing of this article. Conflict of interest: None. Authorship: M.H. and V.D. analysed the iodine data and prepared results. M.H. and V.D. wrote the first draft of the manuscript. M. Burnier, M. Bochud and F.P. designed the study con-cept were investigators of the Swiss Salt Survey. All authors edited the manuscript and approved the final manuscript version and the revisions. Ethics of human subject participation: The study was conducted according to the guidelines laid down in the Declaration of Helsinki and all procedures involving human subjects were approved by nine local ethics committees.
References
1. Nakamura M, Yamazaki I, Kotani T et al. (1985) Thyroid peroxidase selects the mechanism of either 1- or 2-electron oxidation of phenols, depending on their substituents. J Biol Chem 260, 13546–13552.
2. Ma YA, Sih CJ & Harms A (1999) Enzymatic mechanism of thyroxine biosynthesis. Identification of the lost three-carbon fragment. J Am Chem Soc 121, 8967–8968. 3. Santiago-Fernandez P, Torres-Barahona R, Muela-Martinez
JA et al. (2004) Intelligence quotient and iodine intake: a cross-sectional study in children. J Clin Endocrinol Metab 89, 3851–3857.
4. Bougma K, Aboud FE, Harding KB et al. (2013) Iodine and mental development of children 5 years old and under: a systematic review and meta-analysis. Nutrients 5, 1384–1416.
5. Hynes KL, Otahal P, Hay I et al. (2013) Mild iodine de fi-ciency during pregnancy is associated with reduced edu-cational outcomes in the offspring: 9-year follow-up of the gestational iodine cohort. J Clin Endocrinol Metab 98, 1954–1962.
6. Bath SC, Steer CD, Golding J et al. (2013) Effect of inade-quate iodine status in UK pregnant women on cognitive outcomes in their children: results from the Avon Long-itudinal Study of Parents and Children (ALSPAC). Lancet 382, 331–337.
7. Andersson M, Karumbunathan V & Zimmermann MB (2012) Global iodine status in 2011 and trends over the past decade. J Nutr 142, 744–750.
8. Konig F, Andersson M, Hotz K et al. (2011) Ten repeat collections for urinary iodine from spot samples or 24-hour
samples are needed to reliably estimate individual iodine status in women. J Nutr 141, 2049–2054.
9. Zimmermann MB (2008) Methods to assess iron and
iodine status. Br J Nutr 99, Suppl. 3, S2–S9.
10. Institute of Medicine (2001) Dietary Reference Intakes for Vitamin A, Vitamin K, Arsenic, Boron, Chromium, Copper, Iodine, Iron, Manganese, Molybdenum, Nickel, Silicon, Vanadium, and Zinc. A Report of the Panel on Micro-nutrients, Food and Nutrition Board, Institute of Medicine. Washington, DC: National Academies Press.
11. World Health Organization (2007) Assessment of Iodine Deficiency Disorders and Monitoring their Elimination, 3rd ed. Geneva: WHO.
12. Trumbo P, Yates AA, Schlicker S et al. (2001) Dietary reference intakes: vitamin A, vitamin K, arsenic, boron, chromium, copper, iodine, iron, manganese, molybdenum, nickel, silicon, vanadium, and zinc. J Am Diet Assoc 101, 294–301.
13. Chappuis A, Bochud M, Glatz N et al. (2012) Swiss survey on salt intake: main results. Federal Office of Public Health and Institute of Social and Preventive Medicine, University Hospital Lausanne. http://www.blv.admin.ch/themen/04679/ 05055/05060/05061/index.html?lang=en (accessed February 2014).
14. World Health Organization (2003) Diet Nutrition and the Prevention of Chronic Diseases. Joint WHO/FAO Expert Consultation. WHO Technical Report Series no. 916. Geneva: WHO.
15. DeSimone JA, Beauchamp GK, Drewnowski A et al. (2013) Sodium in the food supply: challenges and opportunities. Nutr Rev 71, 52–59.
16. Strazzullo P, D’Elia L, Kandala NB et al. (2009) Salt intake, stroke, and cardiovascular disease: meta-analysis of pros-pective studies. BMJ 339, b4567.
17. World Health Organization (2013) Mapping Salt Reduction Initiatives in the WHO European Region. Copenhagen: WHO Regional Office for Europe.
18. Zimmermann MB, Aeberli I, Torresani T et al. (2005)
Increasing the iodine concentration in the Swiss iodized salt program markedly improved iodine status in pregnant women and children: a 5-y prospective national study. Am J Clin Nutr 82, 388–392.
19. Zimmermann MB, Quack Lötscher K, Bürgi H et al.
(2013) Iodine Supply in Switzerland: Current Status and Recommendations. Zurich: Federal Office of Public Health; available at http://www.blv.admin.ch/themen/04679/05108/ 05869/index.html?lang=en
20. Andersson M, Aeberli I, Wüst N et al. (2010) The Swiss iodized salt program provides adequate iodine for school children and pregnant women, but weaning infants not receiving iodine-containing complementary foods as well as their mothers are iodine deficient. J Clin Endocrinol Metab 95, 5217–5224.
21. Reinivuo H, Valsta LM, Laatikainen T et al. (2006) Sodium in the Finnish diet: II trends in dietary sodium intake and comparison between intake and 24-h excretion of sodium. Eur J Clin Nutr 60, 1160–1167.
22. Murakami K, Sasaki S, Takahashi Y et al. (2008) Sensitivity and specificity of published strategies using urinary creatinine to identify incomplete 24-h urine collection. Nutrition 24, 16–22. 23. Haldimann M, Zimmerli B, Als C et al. (1998) Direct deter-mination of urinary iodine by inductively coupled plasma mass spectrometry using isotope dilution with iodine-129. Clin Chem 44, 817–824.
24. Adriaens AG, Kelly WR & Adams FC (1993) Propagation of uncertainties in isotope dilution mass spectrometry using pulse counting detection. Anal Chem 65, 660–663. 25. Nath SK, Moinier B, Thuillier F et al. (1992) Urinary
excre-tion of iodide and fluoride from supplemented food
26. Zimmerli B, Tobler L, Bajo S et al. (1995) Analysis of daily rations from Swiss canteens and restaurants. Part 7. Essential trace elements iodine and selenium. Mitt Geb Lebensmittel-unters Hyg 86, 226–265.
27. Federal Office of Public Health (2013) Swiss Food Compo-sition Database. Bern: Federal Department of Home Affairs; available at http://naehrwertdaten.ch/request?xml =Messa-geData&xml=MetaData&xsl=Start&lan=en&pageKey=Start 28. Swiss Farmers Union (2013) Food Consumption Statistics.
Brugg: Schweizerischer Bauernverband; available at http:// www.sbv-usp.ch/de/statistik/ernaehrung/
29. Schachter J, Harper PH, Radin ME et al. (1980) Comparison of sodium and potassium intake with excretion. Hyperten-sion 2, 695–699.
30. Beaton G (1994) Criteria of an adequate diet. In Modern Nutrition in Health and Disease, pp. 1491–1505 [R Shils, J Olson and M Shike, editors]. Philadelphia, PA: Lea & Febiger.
31. Institute of Medicine, Subcommittees on Interpretation and Uses of Dietary Reference Intakes and Upper Reference Levels of Nutrients (2000) Using the estimated average requirement for nutrient assessment of groups. In Dietary Reference Intakes: Applications in Dietary Assessment, pp. 73–105 [Institute of Medicine editor]. Washington, DC: The National Academies Press.
32. Tooze JA, Midthune D, Dodd KW et al. (2006) A new statis-tical method for estimating the usual intake of episodically consumed foods with application to their distribution. J Am Diet Assoc 106, 1575–1587.
33. National Cancer Institute (2010) Usual Dietary Intakes: SAS Macros for Analysis of A Single Dietary Component. Bethesda, MD: National Cancer Institute, National Institutes of Health; available at http://riskfactor.cancer.gov/diet/ usualintakes/macros_single.html
34. Carriquiry AL (1999) Assessing the prevalence of nutrient inadequacy. Public Health Nutr 2, 23–33.
35. Rasmussen LB, Ovesen L & Christiansen E (1999) Day-to-day and within-Day-to-day variation in urinary iodine excretion. Eur J Clin Nutr 53, 401–407.
36. Kass RE, Carlin BP, Gelman A et al. (1998) Markov chain Monte Carlo in practice: a roundtable discussion. Am Stat 52, 93–100.
37. Tooze JA, Kipnis V, Buckman DW et al. (2010) A mixed-effects model approach for estimating the distribution of usual intake of nutrients: the NCI method. Stat Med 29, 2857–2868.
38. Murphy SP & Barr SI (2011) Practice paper of the American Dietetic Association: using the dietary reference intakes. J Am Diet Assoc 111, 762–770.
39. Manz F, Johner SA, Wentz A et al. (2012) Water balance throughout the adult life span in a German population. Br J Nutr 107, 1673–1681.
40. Zimmermann MB & Andersson M (2012) Assessment of iodine nutrition in populations: past, present, and future. Nutr Rev 70, 553–570.
41. Klumpp S & Schultz J (1985) Calcium and calmodulin. Pharm Unserer Zeit 14, 19–26.
42. Matkovic V, Ilich JZ, Andon MB et al. (1995) Urinary cal-cium, sodium, and bone mass of young females. Am J Clin Nutr 62, 417–425.
43. Als C, Haldimann M, Burgi E et al. (2003) Swiss pilot study of individual seasonal fluctuations of urinary iodine con-centration over two years: is age-dependency linked to the major source of dietary iodine? Eur J Clin Nutr 57, 636–646. 44. Goy D, Häni JP, Piccinali P et al. (2012) Salt and its
sig-nificance in cheese making. ALP-Forum 59, 16–17. 45. Haldimann M, Alt A, Blanc A et al. (2005) Iodine content of
food groups. J Food Compost Anal 18, 461–471.
46. Rasmussen LB, Ovesen L, Bülow I et al. (2002) Dietary iodine intake and urinary iodine excretion in a Danish popu-lation: effect of geography, supplements and food choice. Br J Nutr 87, 61–69.
47. Wiersinga WM (2013) Smoking and thyroid. Clin Endocri-nol (Oxf) 79, 145–151.
48. Belin RM, Astor BC, Powe NR et al. (2004) Smoke exposure is associated with a lower prevalence of serum thyroid autoantibodies and thyrotropin concentration elevation and a higher prevalence of mild thyrotropin concentration suppression in the third National Health and Nutrition Examination Survey (NHANES III). J Clin Endocrinol Metab 89, 6077–6086.
49. Fukayama H, Nasu M, Murakami S et al. (1992) Examination of antithyroid effects of smoking products in cultured thyr-oid follicles: only thiocyanate is a potent antithyrthyr-oid agent. Acta Endocrinol (Copenh) 127, 520–525.
50. Cho NH, Choi HS, Kim KW et al. (2010) Interaction between cigarette smoking and iodine intake and their impact on thyroid function. Clin Endocrinol (Oxf) 73, 264–270. 51. Dallongeville J, Marecaux N, Fruchart JC et al. (1998)
Cigarette smoking is associated with unhealthy patterns of nutrient intake: a meta-analysis. J Nutr 128, 1450–1457. 52. de Boer EJ, Slimani N, van’t Veer P et al. (2011) The
European Food Consumption Validation Project: conclu-sions and recommendations. Eur J Clin Nutr 65, Suppl. 1, S102–S107.
53. Carriquiry AL (2003) Estimation of usual intake distributions of nutrients and foods. J Nutr 133, issue 2, 601S–608S. 54. Ascoli W & Arroyave G (1970) Epidemiology of endemic
goitre in Central America. Relation between prevalence and excretion of I in urine. Arch Latinoam Nutr 20, 309–320. 55. Verkaik-Kloosterman J, van’t Veer P & Ocké MC (2010)
Reduction of salt: will iodine intake remain adequate in The Netherlands? Br J Nutr 104, 1712–1718.
56. World Health Organization (2014) Salt Reduction and
Iodine Fortification Strategies in Public Health. Geneva: WHO.
57. Scientific Committee on Food, European Commission
(2002) Opinion of the Scientific Committee on Food on the Tolerable Upper Intake Level of Iodine. Brussels: European Commission.
58. Ohlhorst SD, Slavin M, Bhide JM et al. (2012) Use of iodized salt in processed foods in select countries around the World and the role of food processors. Compr Rev Food Sci Food Saf 11, 233–284.