arXiv:1405.4123v2 [hep-ex] 29 Jul 2014
EUROPEAN ORGANISATION FOR NUCLEAR RESEARCH (CERN)
CERN-PH-EP-2014-053
Submitted to: Phys. Rev. D
Search for high-mass dilepton resonances in
pp
collisions at
√
s
= 8
TeV with the ATLAS detector
The ATLAS Collaboration
Abstract
The ATLAS detector at the Large Hadron Collider is used to search for high-mass resonances
decaying to dielectron or dimuon final states. Results are presented from an analysis of proton–
proton (
pp
) collisions at a center-of-mass energy of 8 TeV corresponding to an integrated luminosity
of 20.3 fb
−1in the dielectron channel and 20.5 fb
−1in the dimuon channel. A narrow resonance with
Standard Model
Z
couplings to fermions is excluded at 95% confidence level for masses less than
2.79 TeV in the dielectron channel, 2.53 TeV in the dimuon channel, and 2.90 TeV in the two channels
combined. Limits on other model interpretations are also presented, including a grand-unification
model based on the
E
6gauge group,
Z
∗bosons, Minimal
Z
′Models, a spin-2 graviton excitation
from Randall–Sundrum models, quantum black holes and a Minimal Walking Technicolor model with
a composite Higgs boson.
c
2014 CERN for the benefit of the ATLAS Collaboration.
Search for high-mass dilepton resonances in pp collisions at
s
= 8 TeV with the
ATLAS detector
The ATLAS Collaboration
The ATLAS detector at the Large Hadron Collider is used to search for high-mass resonances decaying to dielectron or dimuon final states. Results are presented from an analysis of proton– proton (pp) collisions at a center-of-mass energy of 8 TeV corresponding to an integrated luminosity of 20.3 fb−1 in the dielectron channel and 20.5 fb−1 in the dimuon channel. A narrow resonance with Standard Model Z couplings to fermions is excluded at 95% confidence level for masses less than 2.79 TeV in the dielectron channel, 2.53 TeV in the dimuon channel, and 2.90 TeV in the two channels combined. Limits on other model interpretations are also presented, including a grand-unification model based on the E6 gauge group, Z∗bosons, Minimal Z′ Models, a spin-2 graviton excitation from Randall–Sundrum models, quantum black holes and a Minimal Walking Technicolor model with a composite Higgs boson.
PACS numbers: 12.60.Cn, 13.85.Fb, 13.85.Qk, 13.85.Rm, 14.80.Rt, 14.80.Tt
I. INTRODUCTION
The current energy frontier can be explored in the in-variant mass spectrum of dielectron or dimuon pairs via a search for new massive resonances at the Large Hadron Collider (LHC). Such a search has been performed us-ing the full 8 TeV center-of-mass energy proton–proton (pp) collision dataset of about 20 fb−1 recorded with the
ATLAS detector [1] in 2012.
While the Standard Model (SM) has been confirmed at the LHC, the identification of massive dilepton reso-nances in proton-proton collisions still constitutes one of the most promising channels in searches for new physics. It implies a fully reconstructed signal over a smooth and well-understood background. Models with dilepton reso-nances are predicted in many scenarios for new physics. Among these are grand-unification models, which are mo-tivated by gauge unification or a restoration of the left-right symmetry violated by the weak interaction. These models predict the existence of additional neutral, spin-1 vector gauge bosons, called Z′
bosons, due to the exis-tence of larger symmetry groups that break to yield the SM gauge group and additional U (1) gauge groups. Ex-amples considered in this article include the Z′
bosons of the E6-motivated [2, 3] and Minimal Models [4].
An-other Z′ signal, the Z′
SSM, is considered due to its
in-herent simplicity and usefulness as a benchmark model. The Sequential Standard Model (SSM) includes a Z′
SSM
boson with couplings to fermions equivalent to those of the SM Z boson.
Dilepton resonances are also predicted by several mod-els motivated by solutions to the hierarchy problem of the SM, which involves the need to reconcile the very dif-ferent scales of electroweak symmetry breaking and the gravitational Planck scale (MPl). The search for physics
beyond the SM remains as crucial as it was prior to the discovery of the Higgs boson at the LHC [5, 6], since solving the hierarchy problem is one of the primary ob-jectives of the LHC physics program. Examples of poten-tial signals in models that address the hierarchy problem
are the Z∗ [7–10] boson, the spin-2 graviton excitation
in Randall–Sundrum (RS) models [11], quantum black holes (QBHs) [12], and technimesons in Minimal Walk-ing Technicolor (MWT) [13–16]. These, along with the Z′
interpretations motivated by grand unification, are further discussed in Sec. II.
To conduct the search, the dilepton invariant mass (mℓℓ) line shape is examined for a localized excess of
events corresponding to a new resonance, where ℓℓ cor-responds to either the dielectron or dimuon final state. This is done using signal and background templates that provide the expected yield of events in bins of mℓℓ. The
methodology is fully described in Sec. XI. This search approach is advantageous because using the full shape of the distribution makes the analysis robust against un-certainties in the background model at high mass. If shape information were not used in the analysis, uncer-tainty in the background estimate would be more likely to mask a potential signal. The shape-based method is also more sensitive to a signal in the case of a signal with a low-mass tail arising from off-shell production, which occurs due to the steeply falling parton distribution func-tion (PDF) of the two colliding partons at large values of Bjorken x. This feature is commonly referred to as a “parton-luminosity tail,” and its size increases with the resonance width. The impact of this parton-luminosity tail on the mℓℓ distribution grows as the kinematic limit
is approached.
The models considered here predict resonances that are narrow relative to the detector resolution. In such cases, interference effects, where they occur, are not expected to significantly alter the line shape and are thus not con-sidered. The exception to this is the class of Minimal Z′
Models described in Sec. II, for which large coupling strengths, and hence larger widths, are considered. In this case, interference effects are included explicitly in the analysis.
The potential signals studied in this analysis vary in width and spin, and some exhibit a parton-luminosity tail while others do not. Because of this, the final
re-sults given in Sec. XII can be interpreted in the context of other models that are not directly studied here, but that predict resonances in the mℓℓspectrum with similar
signal shapes.
II. DESCRIPTION AND STATUS OF
THEORETICAL MODELS
A detailed description of the models studied in this article is given in this section. For most models, the best previous limits from the ATLAS experiment were obtained using 5 fb−1 of data at√s = 7 TeV [17], while
the exclusion results from the CMS experiment are based on 5 fb−1 of data at √s = 7 TeV and 4 fb−1 of data at
√
s = 8 TeV [18]. The data collected at 7 TeV have not been used to obtain the results presented in this paper, as doing so would not significantly extend the sensitivity of the search. Previous limits on the mass scale for QBH production are obtained from other sources, as noted in Sec. II E.
For the benchmark model, previous results from ATLAS exclude a Z′
SSM boson with mass less than
2.22 TeV at 95% confidence level (CL), while previous results from the CMS experiment exclude a Z′
SSM boson
with mass less than 2.59 TeV at 95% CL. Direct searches at the Tevatron experiments [19, 20] and indirect con-straints from LEP [21–24] have resulted in limits on the Z′
SSM mass of 1.071 TeV [20] and 1.787 TeV [25],
respec-tively.
A. E6-motivated Z′ models
In the class of models based on the E6 gauge group,
this unified symmetry group can break to the SM in a number of different ways [2]. In many of them, E6is first
broken to SO(10)×U(1)ψ, with SO(10) then breaking
ei-ther to SU (4) × SU(2)L× SU(2)Ror SU (5) × U(1)χ. In
the first of these two possibilities, a Z′
3R coming from
SU (2)R or a ZB−L′ from the breaking of SU (4) into
SU (3)C× U(1)B−L could exist at the TeV scale. Both
of these Z′
bosons appear in the Minimal Z′
Models dis-cussed in the next section.
In the SU (5) case, the presence of U (1)ψ and U (1)χ
symmetries implies the existence of associated gauge bosons Z′
ψ and Z ′
χ that can mix. When SU (5) is
bro-ken down to the SM, one of the U (1) can remain un-broken down to intermediate energy scales [2, 3]. There-fore, the precise model is governed by a mixing angle θE6,
with the new potentially observable Z′ boson defined by
Z′(θ
E6) = Z
′
ψcos θE6+ Z
′
χsin θE6. The value of θE6
spec-ifies the Z′ boson’s coupling strength to SM fermions as
well as its intrinsic width. In comparison to the bench-mark Z′
SSM, which has a width of approximately 3% of
its mass, the E6Models predict narrower Z′signals. The
Z′
ψ considered here has a width of 0.5% of its mass, and
the Z′
χ has a width of 1.2% of its mass [26, 27]. All other
Z′
signals in this model are defined by specific values of θE6 ranging from 0 to π, and have widths between those
of the Z′ ψ and Z
′ χ.
Previous results from ATLAS exclude the Z′ ψ (Z
′ χ)
boson with mass less than 1.79 TeV (1.97 TeV) at 95% CL [17], while the CMS experiment excludes a Z′
ψ
boson with mass less than 2.26 TeV at 95% CL [18].
B. Minimal Z′ models
In the Minimal Z′ Models [4], the phenomenology of
Z′
boson production and decay is characterized by three parameters: two effective coupling constants, gB−L and
gY, and the Z′ boson mass. This parameterization
en-compasses Z′
bosons from many models, including the Z′ χ
belonging to the E6-motivated Model of the previous
sec-tion, the Z′
3Rin a left-right symmetric model [28, 29] and
the Z′
B−L of the pure (B − L) Model [30], where B (L)
is the baryon (lepton) number and (B − L) is the con-served quantum number. The coupling parameter gB−L
defines the coupling of a new Z′
boson to the (B − L) current, while the gY parameter represents the coupling
to the weak hypercharge Y. It is convenient to refer to the ratios ˜gB−L≡ gB−L/gZand ˜gY≡ gY/gZ, where gZis
the coupling of the SM Z boson defined by gZ= 2MZ/v.
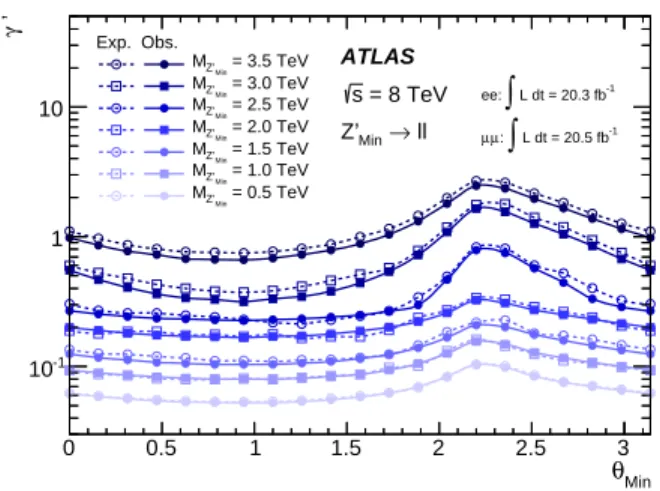
Here v = 246 GeV is the SM Higgs vacuum expecta-tion value. To simplify further, γ′ and θ
Min are chosen
as independent parameters with the following definitions: ˜
gB−L = γ′cos θMin, ˜gY = γ′sin θMin. The γ′ parameter
measures the strength of the Z′
boson coupling relative to that of the SM Z boson, while θMin determines the
mixing between the generators of the (B − L) and the weak hypercharge Y gauge groups. Specific values of γ′
and θMin correspond to Z′ bosons in various models, as
is shown in Table I for the three cases mentioned in this section.
TABLE I. Values for γ′ and θMin in the Minimal Z′ Models corresponding to three specific Z′bosons: Z′
B−L, Zχ′ and Z3R′ . The SM weak mixing angle is denoted by θW.
Z′ B−L Zχ′ Z3R′ γ′ q5 8sin θW q 41 24sin θW 5 √12sin θW cos θMin 1 q 25 41 1 √5 sin θMin 0 − q 16 41 − 2 √5
For the Minimal Z′
Models, the width depends on γ′
and θMin, and the interference with the SM Z/γ∗process
is included. Couplings to hypothetical right-handed neu-trinos and to W boson pairs are not included. Previous limits on the Z′
mass versus couplings in the context of these models were set by the ATLAS experiment; the spe-cific mass limit varies with γ′
. For γ′
Z′
mass limits at 95% CL corresponding to θMin∈ [0, π]
is 1.11 TeV to 2.10 TeV [17].
C. Z∗ bosons
One set of models proposes a solution to the SM hier-archy problem via the introduction of a new doublet of vector bosons: (Z∗
, W∗
) [7–10]. These are predicted to have masses near the weak scale, motivating the search at the LHC.
As a result of the tensor form of the coupling, the kine-matics of the Z∗ boson’s decay to dileptons are different
from that of a Z′ boson [7], and there is no interference
between this and the Z/γ∗
process. To fix the Z∗
bo-son’s coupling strength to fermions, a model with quark– lepton universality is adopted [9, 10]. The gauge coupling is chosen to be the same as in the SM SU (2) group, and the scale of new physics is proportional to the mass of the new heavy boson. The model parameters are chosen such that the total and partial decay widths of the W∗
are the same as those of the charged partner of the Z′ SSM
boson (W′
SSM) with the same mass. The width of the Z ∗
resonance is 3.4% of its mass [10]. Previous ATLAS results exclude a Z∗
with mass less than 2.20 TeV at 95% CL [17].
D. Graviton excitations in Randall–Sundrum
models
Models with extra dimensions offer an alternative so-lution to the mass hierarchy problem in that the higher-dimensional Planck scale can be of the order of the electroweak scale. Among them, the Randall–Sundrum model [11] postulates the existence of one warped extra dimension. Specifically, the geometry of the original RS model contains two 4-dimensional branes, known as the TeV brane and the Planck brane, within a 5-dimensional bulk. The extra dimension in the bulk is compactified, which leads to a Kaluza–Klein tower of excited states of the graviton. The particles of the SM are confined to the TeV brane, where due to warping the apparent strength of gravity is exponentially suppressed. Gravity originates on the Planck brane; gravitons are also located on the Planck brane, but can propagate in the bulk.
The RS model phenomenology is characterized by the mass of the lightest Kaluza–Klein excitation mode of the graviton, known as G∗, and the ratio k /M
Pl, which
de-fines the coupling strength of the G∗ to SM particles.
Here k is a scale that defines the warp factor of the extra dimension and MPl = MPl/√8π is the reduced Planck
mass. The G∗ in this model is expected to be narrow for
values of k /MPl< 0.2. The intrinsic width of the
parti-cle is proportional to (k /MPl)2, and is 0.014% (5.8%) of
the pole mass for k /MPl = 0.01 (0.2). A lower bound on
k/MPl of 0.01 is theoretically preferred [31], as it limits the new physics energy scale to be of the order of TeV,
and less than 10 TeV. For values above k /MPl ≈ 0.1
the compactification radius approaches the Planck length and is less motivated on theoretical grounds [31], as this theory does not incorporate quantum gravity.
The G∗ is produced predominantly via quark–
antiquark annihilation and gluon fusion, with decays to SM fermions or bosons. While the branching ratio to dileptons is low due to the spin-2 quantum numbers of the particle, the dilepton final state is nevertheless sensi-tive to new spin-2 resonances due to the clean final state.
Previous ATLAS results exclude a G∗
with cou-pling k /MPl= 0.1 at 95% CL for masses less than
2.16 TeV [17], and the corresponding limit from CMS is 2.39 TeV [18].
E. Quantum black holes
In the context of models with extra dimensions, semi-classical black holes can be formed at a collider if the available energy is well above the higher-dimensional Planck scale [32, 33]. Such black holes would then decay through Hawking radiation. Quantum (or non-thermal) black holes differ from these variants in that they lack a well-defined temperature or significant entropy. This in-hibits thermal decays of black holes produced at a mass scale just above the (higher-dimensional) Planck scale, which in turn limits the number of particles in the final state [12]. For two-particle final states, it is interest-ing to look at the quantum gravity regime, where the threshold for QBH production, Mth, lies between the
higher-dimensional Planck scale, and about five times this value [12, 34, 35]. The QBH decay is governed by the yet unknown theory of quantum gravity, but it is as-sumed that QBHs emit with equal strength all SM parti-cle degrees of freedom. Provided the higher-dimensional Planck scale is not higher than a few TeV, QBHs could be observed at the LHC.
Production of QBHs can occur in the original RS model, and in the extra-dimensional model proposed by Arkani-Hamed, Dimopoulos and Dvali (ADD) [36]. Both scenarios are considered in the model interpretation pre-sented here. The ADD model postulates the existence of n ≥ 1 flat additional spatial dimensions, commonly compactified with radius R. Only gravity propagates in these extra dimensions, with SM particles confined to a 4-dimensional manifold. The threshold for QBH produc-tion in the ADD model is assumed to correspond to the higher-dimensional Planck scale. The analysis here was performed assuming n = 6, but the dependence of the resulting production limit on n is small.
The specific model [37] used to interpret the result of this article conserves color, electric charge and total an-gular momentum. Two QBHs states with zero charge, produced via qq and gg, have predicted branching ratios to each dilepton final state of 0.5% and 0.2%, respec-tively, assuming conservation of the global symmetries of lepton and baryon number. While the model parameters
of Ref. [37] are considered in the context of ADD, one can take the 5-dimensional ADD case to obtain an approxi-mate RS model, which is what is used in the case of the RS model interpretation. In the RS model, the higher-dimensional Planck scale ˜M can be calculated from the G∗
mass and k /MPl as follows [12]:
˜ M = MG∗ 3.83 × (k/MPl) 2 3 ,
where also here the mass threshold for QBH production, Mth, is assumed to be equal to the higher-dimensional
Planck scale.
Previous limits on the types of QBH production de-scribed in this article were set by the ATLAS experi-ment using final states with an energetic photon and a jet [38] as well as final states with an energetic lepton and a jet [39]. Previous limits also exist from the CMS experiment from a search dominated by multi-jet final states [40]. The ATLAS experiment has also set limits on the production of a different type of QBHs using dijet events [41, 42]. While QBHs are not resonances, an in-crease in the dilepton production cross-section near the black hole threshold is expected. The expected signal is therefore similar to that predicted by resonance mod-els, and QBHs are thus referred to as resonances in the remainder of this article.
F. Minimal Walking Technicolor
Another solution to the hierarchy problem is to postu-late that the Higgs boson is a composite particle, bound by a strong force called technicolor. Technicolor models use the new strong dynamics to break electroweak sym-metry. These models predict the existence of new narrow technimeson resonances with masses of a few hundred GeV decaying to the dilepton final state. The interpre-tation used here is in the context of the Minimal Walk-ing Technicolor model [13–16], which predicts a compos-ite Higgs boson having properties consistent, within cur-rent uncertainties, with the Higgs boson discovered at the LHC [5, 6].
The MWT model used here is defined by the follow-ing parameters: the bare axial-vector and vector masses, MA and MV; the coupling of the spin-1 resonance to
SM fermions g/˜g, where g is the coupling constant of the weak interaction and ˜g is the strength of the spin-1 resonance interaction; the S-parameter obtained using the zeroth Weinberg Sum Rule, used to constrain MA
and MV; the Higgs boson mass mH, and s, the
cou-pling of the Higgs boson to composite spin-1 states. Here the S-parameter and s are set according to the recom-mendation set forth in Ref. [43]: S = 0.3 and s = 0, while mH = 125 GeV is used for the Higgs boson mass.
The physical mass of about 125 GeV for the Higgs bo-son emerges after top quark corrections are taken into account [16].
This model predicts new particles in the form of tech-nimeson triplets: R0,±1 and R
0,±
2 . The R10 and R02 are
produced by quark–antiquark annihilation and decay to dilepton final states via an intermediate Z/γ∗ state. For
each pair of values (MR1, ˜g), the values of MR2, MAand
MV are unique. The widths and the mass difference of
R1and R2vary strongly depending on the model
param-eters [44]. In this analysis, the model parameter ˜g = 2 is used. Previous studies have shown [17] that the mℓℓ
distributions obtained with ˜g = 2 are representative of those for all values of ˜g and MA to which this analysis
is currently sensitive. For this analysis, an mℓℓ
distribu-tion accounting for contribudistribu-tions from both R1and R2is
used. However, the magnitude of the mass difference be-tween the two and the characteristics of the distribution are dependent on ˜g and MA. For larger values of ˜g and
small values of MA, R2 is broad with a reduced
ampli-tude, and therefore does not contribute significantly to the signal shape.
Previous limits on this model were set by ATLAS on the bare axial mass, MA, in the MWT model. For a
value of the coupling parameter ˜g = 2, MA values less
than 1.57 TeV were excluded at 95% CL [17].
III. ATLAS DETECTOR
The ATLAS detector [1] consists of an inner track-ing detector system (ID) surrounded by a superconduct-ing solenoid, electromagnetic and hadronic calorimeters, and a muon spectrometer (MS). Charged particles in the pseudorapidity1 range |η| < 2.5 are reconstructed with
the ID, which consists of layers of silicon pixel and mi-crostrip detectors and a straw-tube transition-radiation tracker having coverage within |η| < 2.0. The ID is im-mersed in a 2 T magnetic field provided by the solenoid. The latter is surrounded by a hermetic calorimeter that covers |η| < 4.9 and provides 3-dimensional reconstruc-tion of particle showers. The electromagnetic calorime-ter is a liquid argon sampling calorimecalorime-ter, which uses lead absorbers for |η| < 3.2 and copper absorbers in the very forward region. The hadronic sampling calorime-ter uses plastic scintillator tiles as the active macalorime-terial and iron absorbers in the region |η| < 1.7. In the re-gion 1.5 < |η| < 4.9, liquid argon is used as active mate-rial, with copper or/and tungsten absorbers. Outside the calorimeter, air-core toroids supply the magnetic field for the MS. There, three stations of precision chambers al-low the accurate measurement of muon track curvature
1
ATLAS uses a right-handed coordinate system with its origin at the nominal interaction point in the center of the detector and the z-axis along the beam pipe. The x-axis points from the interaction point to the center of the LHC ring, and the y-axis points upward. Cylindrical coordinates (r, φ) are used in the transverse plane, φ being the azimuthal angle around the beam pipe. The pseudorapidity is defined in terms of the polar angle θ as η = − ln tan(θ/2).
in the region |η| < 2.7. The majority of these precision chambers are composed of drift tubes, while cathode strip chambers provide coverage in the inner stations of the forward region for 2.0 < |η| < 2.7. Additional muon chambers installed between the inner and middle sta-tions of the forward region and commissioned prior to the 2012 run improve measurements in the transition region of 1.05 < |η| < 1.35 where the outer stations have no cov-erage. Muon triggering is possible in the range |η| < 2.4, using resistive-plate chambers in the central region and thin-gap chambers in the forward region. A three-level trigger system [45] selects events to be recorded for offline analysis.
IV. DATA SAMPLE
The events in the dataset were collected during peri-ods with stable beams and all relevant subsystems op-erational. The pp collision data recorded between April and December 2012 at√s = 8 TeV amount to 20.3 fb−1
in the dielectron channel and 20.5 fb−1 in the dimuon
channel.
In the dielectron channel, events are triggered by the presence of two energy deposits (“clusters”) in the elec-tromagnetic calorimeter, one with transverse momentum (pT) threshold of pT > 35 GeV, and the other with
pT > 25 GeV. The shower profiles are required to be
consistent with those expected for electromagnetic show-ers [46]. This trigger is preferred over a dedicated di-electron trigger, which incorporates tracking informa-tion, because it is advantageous in the estimation of the data-driven background, as explained in Sec. VIII. In the dimuon channel, events are triggered by at least one of two single-muon triggers with transverse momentum thresholds of pT > 24 GeV or pT > 36 GeV with an
addi-tional requirement that the muon candidate be isolated (see Sec. VI) for the former case.
V. SIMULATED SAMPLES
Expected signal and background yields, with the ex-ception of certain data-driven background estimates, are evaluated with simulated Monte Carlo (MC) samples and normalized using the highest-order cross-section predic-tions available in perturbation theory.
The sample used to model the Drell–Yan (q ¯q → Z/γ∗
→ ℓ+ℓ−) background is generated at
next-to-leading order (NLO) using Powheg [47] and the CT10 PDF [48], with Pythia 8 [49] to model parton showering and hadronization. For this and all other samples, the final-state photon radiation (FSR) is handled by Pho-tos [50], and the interaction of particles with the detec-tor and its response are modeled using a full ATLAS de-tector simulation [51] based on Geant4 [52]. The Z/γ∗
differential cross-section with respect to mass has been calculated at next-to-next-to-leading-order (NNLO)
per-turbative QCD (pQCD) using FEWZ [53, 54] with the MSTW2008NNLO PDF [55]. The calculation includes NLO electroweak (EW) corrections beyond FSR, as well as a contribution from the irreducible, non-resonant photon-induced (PI) background, γγ → ℓ+ℓ−. The
PI contribution is estimated using the MRST2004qed PDF [56] at leading order (LO), by taking an average of the predictions obtained under the current and con-stituent quark mass schemes. Differences between the average and the individual results from those schemes are used to assign the uncertainty on this additive correc-tion. The PI corrections were verified by SANC [57, 58]. An additional small correction arises from single boson production in which the final-state charged lepton radi-ates a real W or Z boson. This was estimated using Madgraph 5 [59], following the prescription outlined in Ref. [60]. A mass-dependent K-factor used to scale the Z/γ∗
background samples is obtained from the ratio of the calculated NNLO pQCD cross-section, with addi-tional EW, PI and real W/Z corrections, to the cross-section from the Powheg sample. The values of the K-factors as evaluated at dilepton masses of 1, 2 and 3 TeV are 1.07, 1.10 and 1.14, respectively.
Other important backgrounds are due to diboson (W W , W Z and ZZ) and top quark production. The di-boson processes are generated with Herwig [61, 62], us-ing the CTEQ6L1 PDF [63]. The diboson cross-sections are known to NLO with an uncertainty of 5%, and the values used are 57 pb (W W ), 21 pb (W Z) and 7.4 pb (ZZ), as calculated with MCFM [64]. Backgrounds from t¯t and from single top production in association with a W boson are modeled with MC@NLO [65–67] with Herwig using the CT10 PDF. The t¯t cross-section is σt¯t= 253+13−15pb for a top quark mass of 172.5 GeV. This
is calculated at NNLO in QCD including resummation of next-to-next-to-leading logarithmic soft gluon terms with Top++2.0 [68–73]. The PDF and αS uncertainties on
the t¯t cross-section are calculated using the PDF4LHC prescription [74] with the MSTW2008 68% CL NNLO [55, 75], CT10 NNLO [48, 76] and NNPDF2.3 5f FFN [77] PDF error sets added in quadrature to the scale un-certainty. Varying the top quark mass by ±1 GeV leads to an additional systematic uncertainty of +8 pb and – 7 pb, which is also added in quadrature. The single top background in association with a W boson has a cross-section of σW t = 22.4 ± 1.5 pb [78]. Given that the W t
contribution is small compared to the t¯t cross-section, an overall uncertainty of 6% is estimated on the top quark background. The simulated top quark samples are statis-tically limited at high invariant mass, and the expected number of events as a function of mℓℓ is therefore
ex-trapolated into this region using fits. A number of fits to the invariant mass distribution are carried out, ex-ploring various fit ranges as well as the two fit functions y(x) = p1xp2+p3log x and y(x) = p1/(x + p2)p3, where y
represents the expected yield and x = mℓℓ. The mean
and RMS of these fits are used as the background con-tribution and its uncertainty, respectively. Background
contributions from events with jets or photons in the final state that pass the electron selection criteria are deter-mined using the data, as explained in Sec. VIII. In the muon channel this background is negligible. In order to avoid double counting, the simulated samples in the elec-tron channel are filtered for the presence of two elecelec-trons. An overview of the simulated MC signal and back-ground samples is given in Table II.
TABLE II. Overview of simulated samples used.
Process Generator Parton shower PDF
Drell-Yan Powheg Pythia 8.162 CT10
Diboson Herwig++ 2.5.2 Herwig 6.520 CTEQ6L1
t¯t, W t MC@NLO 4.06 Herwig 6.520 CT10
Z′ Pythia 8.165 Pythia 8.165 MSTW2008LO
G∗ Pythia 8.160 Pythia 8.160 CTEQ6L
Z∗ CalcHEP 4.5.1 Pythia 8.165 MSTW2008LO
MWT Madgraph 5 Pythia 8.165 MSTW2008LO
QBH QBH 1.05 Pythia 8.165 CT10
Simulated signal processes for the Z′
models are ob-tained by reweighting Pythia 8 Drell–Yan samples to the shape of the resonance. The same technique is used for MWT signals, and the shape of the resonance is ob-tained using Madgraph 5. A reweighting procedure is also used for Z∗ and G∗ signals, but it is applied to
dedicated samples generated with CalcHEP [79] in the case of Z∗
, and with Pythia 8 in the case of G∗
. For the QBH signals, samples are generated for each assumed en-ergy threshold (Mth) using the QBH [80] generator. The
MSTW2008LO PDF [55] is used for all signal samples, except the G∗
, which uses the CTEQ6L PDF [63]. The ratio of the NNLO pQCD cross-section calculated with FEWZ without the additional EW, PI and real W/Z cor-rections to the cross-section from the Pythia 8 sample is used to determine a mass-dependent K-factor for the signal samples. The values of the K-factors as evalu-ated at dilepton masses of 1, 2 and 3 TeV are 1.22, 1.16 and 1.16, respectively. The additional EW and real W/Z corrections are not applied to the signal samples because the dominant EW corrections depend on the W and Z boson couplings of the new particle, and are therefore model-dependent. The PI contribution is non-resonant and thus only contributes to the background. No K-factor is applied to the leading-order Z∗
and QBH cross-sections. This is due to the different coupling of the Z∗
to fermions, and the unknown gravitational interaction. For G∗
, a NLO K-factor was provided by the authors of Refs [81–83], using CTEQ6L, which is the same PDF used in the simulation of the signal.
VI. LEPTON RECONSTRUCTION
Electron candidates are formed from clusters of cells reconstructed in the electromagnetic calorimeter with an associated well-reconstructed ID track. The track and the cluster must satisfy a set of identification criteria [46]
that are optimized for high pile-up2 conditions. These
criteria require the shower profiles to be consistent with those expected for electrons and impose a minimum re-quirement on the amount of transition radiation. In ad-dition, to suppress background from photon conversions, a hit in the first layer of the pixel detector is required if an active pixel layer is traversed. The electron’s energy is obtained from the calorimeter measurements and its direction from the associated track.
At transverse energies (ET) relevant to this search, the
calorimeter energy resolution is measured in data to be 1.2% for electrons in the central region (|η| < 1.37) and 1.8% in the forward region (1.52 < |η| ≤ 2.47) [84]. For dielectron masses above 200 GeV, the mass resolution is below 2% over the entire η range.
To suppress background from misidentified jets, iso-lated electrons are selected. A limit is placed on the energy, corrected for transverse shower leakage and pile-up, contained in a cone of radius ∆R = 0.2 surround-ing the electron candidate in the (η, φ) plane: ∆R = p(∆η)2+ (∆φ)2. For the leading (highest-p
T) electron
candidate this energy is required to be less than 0.007 × ET + 5.0 GeV, while for the subleading electron
candi-date a requirement of less than 0.022 × ET + 6.0 GeV is
used. These requirements have been optimized to main-tain a high selection efficiency of ≈ 99% for each electron candidate. The difference in the isolation selection for the leading and subleading electrons takes into account the different energy losses due to bremsstrahlung.
Muon tracks are first reconstructed [85, 86] separately in the ID and in the MS. The two tracks are then matched and a combined fit is performed using ID and MS hits, taking into account the effects of multiple scattering and energy loss in the calorimeters. The momentum is taken from the combined fit. Each muon is required to have a minimum number of hits in each of the ID components. To obtain optimal momentum resolution, at least one selected muon is required to have at least three hits in each of three stations of the MS, or, for muons in the very forward region, at least two hits in the cathode strip chambers and at least three hits in the middle and outer MS stations. At least one hit in each of two layers of the trigger chambers is also required. These muons are referred to as 3-station muons, and have pT resolution
at 1 TeV ranging from 19% to 32%, depending on η. In the very forward region of the MS, the hit requirement in the inner station corresponds to at least two hits in the cathode strip chambers.
In addition to 3-station muons, the best remaining muon candidates in the central region of the MS (|η| < 1.05) with at least five precision hits in each of the in-ner and outer stations are selected, and are referred to as 2-station muons. These 2-station muons are required
2
Multiple pp collisions occurring in the same or neighboring bunch crossings.
to have at least one hit in one layer of the trigger cham-bers, and they have slightly worse pT resolution than the
3-station muons.
Residual misalignments of the muon detectors, which could cause a degradation of the momentum resolution, were studied with collision data in which the muons tra-versed overlapping sets of muon chambers. The effects of these misalignments and the intrinsic position resolution are included in the simulation. Muon candidates passing through chambers where the alignment quality does not allow a reliable momentum measurement at high pT are
rejected.
For each 3-station (2-station) muon, the difference be-tween the standalone momentum measurements from the ID and MS must not exceed five (three) times the sum in quadrature of the standalone uncertainties. To sup-press background from cosmic rays, the muons are also required to satisfy requirements on the track impact pa-rameters with respect to the primary vertex of the event. The impact parameter along the beam axis is required to be within 1 mm, and the transverse impact parameter is required to be within 0.2 mm. The primary vertex of the event is defined as the reconstructed vertex consis-tent with the beam spot position with the highestP p2
T.
The sum includes the p2T of all tracks associated with the
primary vertex. At least three associated tracks are re-quired, each with pT above 0.4 GeV. To reduce the
back-ground from misidentified jets, each muon is required to be isolated such that ΣpT(∆R < 0.3)/pT(µ) < 0.05,
where ΣpT(∆R < 0.3) is the scalar sum of the pT of
all other tracks with pT > 1 GeV within a cone of radius
∆R = 0.3 around the direction of the muon.
VII. EVENT SELECTION
Events are required to have at least one reconstructed primary vertex.
For the dielectron channel, at least two reconstructed electron candidates within |η| < 2.47 are required. The leading and subleading electron must satisfy ET >
40 GeV and ET > 30 GeV, respectively. The
transi-tion region between the central and forward regions of the calorimeters, in the range 1.37 ≤ |η| ≤ 1.52, hibits degraded energy resolution and is therefore ex-cluded. Because of possible charge misidentification, an opposite-charge requirement is not placed on electron candidates. Charge misidentification can occur either due to bremsstrahlung, or due to the limited momentum resolution of the ID at very high pT.
The product of acceptance and efficiency (A × ǫ) is de-fined as the fraction of simulated candidate events that pass the dilepton event selection requirement in the mℓℓ
search region 128 GeV < mℓℓ< 4500 GeV, out of those
generated with a Born level dilepton mass greater than 60 GeV. Fig. 1 shows A × ǫ as a function of the Z′
SSM
pole mass for both channels. Using the described search criteria, A × ǫ in the dielectron channel is found to be
[TeV]
SSM Z’M
1 2 3E
ff
ic
ie
n
c
y
×
Acceptance
0 0.2 0.4 0.6 0.8 ee → Z’ µ µ → Z’ Simulation ATLAS = 8 TeV sFIG. 1. Product of acceptance and efficiency for the dielec-tron (upper distribution) and dimuon (lower distribution) se-lections as a function of the Z′
SSMpole mass.
71% for a Z′
SSMpole mass of 2 TeV. For low values of the
Z′
SSM pole mass, A × ǫ rises due to kinematic selection
requirements. It drops again at high pole mass because the strong decrease of the parton luminosity at high mo-mentum transfer enhances the relative fraction of events in the low-mass tail of the spectrum arising from off-shell Z′
SSMproduction.
Muons passing the reconstruction criteria are required to satisfy pT > 25 GeV and are used to build
opposite-charge muon pairs. If two opposite-opposite-charge muons pass-ing the 3-station selection are found, they are used to make the pair and the event is said to pass the “primary dimuon selection.” If no primary dimuon candidate is found, pairs are built with one 3-station muon and a 2-station muon of opposite charge. Events with such pairs are said to pass the “secondary dimuon selection.” For both selections, if more than one dimuon candidate is found in an event, the one with the highest transverse momentum scalar sum is selected. In the case of a Z′
SSM
of mass 2 TeV, A×ǫ in the dimuon channel is estimated to be 46%, as can be seen in Fig. 1. The contribution of the primary (secondary) dimuon selection is about 42% (4%) at 2 TeV. Due to the stringent requirements placed on the number and distribution of hits required in the MS, which ensure good momentum resolution at large mℓℓ,
the A × ǫ for the dimuon channel is lower compared to the dielectron channel.
VIII. DATA-DRIVEN BACKGROUNDS
As mentioned above, background contributions from events with jets or photons in the final state that pass the electron selection criteria are determined using the data. This includes contributions from dijet, heavy-flavor
quarks and γ + jet production, referred to hereafter as the dijet background. Additional contributions are due to W + jets processes and top quark production with W + jets final states, referred to hereafter as W + jets background.
The probability that a jet is misidentified as an elec-tron (the “fake rate”) is determined as a function of ET
and η using background-enriched data samples. These samples are recorded using several inclusive jet triggers with ET thresholds in the range 25–360 GeV. In each of
these samples, the fake rate f1 (f2) is calculated as the
fraction of leading (subleading) electron candidates that pass the nominal electron identification and isolation re-quirements (“tight”), with respect to the entire sample of “loose” electron candidates. The loose candidates satisfy only a subset of the nominal electron identification crite-ria, which has to be stricter than the trigger requirements imposed on a single object. To avoid bias due to a real electron contribution from W decays or the Drell–Yan process, events are vetoed in the following cases: if the missing transverse momentum is larger than 25 GeV, if they contain two identified electrons satisfying strict cri-teria or if they contain two electrons satisfying less strict
criteria but with an invariant mass between 71 GeV and 111 GeV. A weighted average of the fake rates obtained from the jet samples is then calculated. The values of the fake rates are around 10%. They are not strongly ET-dependent, but are smaller at central
pseudorapidi-ties and increase to as high as 20% for 2.4 < |η| < 2.47. In addition to the fake rate, the probability r1(r2) that
a real electron in the sample of loose electrons satisfies the nominal electron identification and leading (subleading) isolation requirements is used in evaluating this back-ground. This probability is computed from MC simula-tion. Potential differences between data and simulated samples in lepton identification and isolation efficiencies are accounted for by applying scale factors to the simu-lation, which are generally close to unity. The values for r1 and r2are well above 90% for all ET and η.
A system of equations is used to solve for the unknown true contribution to the background from events with one or more fake electrons. The relation between the number of true paired objects Nab, with ETa > ETb and
a, b ∈ {R, F }, and the number of measured pairs in the triggered sample Nxy, with x, y ∈ {T, L}, can be written
as: NT T NT L NLT NLL = r1r2 r1f2 f1r2 f1f2 r1(1 − r2) r1(1 − f2) f1(1 − r2) f1(1 − f2) (1 − r1)r2 (1 − r1)f2 (1 − f1)r2 (1 − f1)f2 (1 − r1)(1 − r2) (1 − r1)(1 − f2) (1 − f1)(1 − r2) (1 − f1)(1 − f2) NRR NRF NF R NF F . (1)
The subscripts R and F refer to real electrons and fakes (jets), respectively. The subscript T refers to elec-trons that pass the tight selection. The subscript L cor-responds to electrons that pass the loose requirements described above but fail the tight requirements.
The background is given as the part of NT T, the
num-ber of pairs where both objects are reconstructed as signal-like, originating from a pair of objects with at least one fake:
NT TDijet&W+jets = r1f2NRF+ f1r2NF R+ f1f2NF F. (2)
The true paired objects on the right-hand side of Eq. (2) can be expressed in terms of measurable quantities (NT T,
NT L, NLT, NLL) by inverting the matrix in Eq. (1).
The dijet background in the dimuon sample is evalu-ated from data by reversing the requirement that muons pass the track isolation requirement based on the variable ΣpT(∆R < 0.3)/pT. The method is further described in
Ref. [87]. The contribution of the dijet background in the dimuon channel is negligible, as is the background from cosmic rays.
IX. SYSTEMATIC UNCERTAINTIES
The treatment of systematic uncertainties in this anal-ysis is simplified by the fact that the backgrounds are normalized to the data in the region of the Z peak. This procedure makes the analysis insensitive to the uncer-tainty on the measurement of the integrated luminosity as well as other mass-independent systematic uncertain-ties. A mass-independent systematic error of 4% is as-signed to the signal expectation due to the uncertainty on the Z/γ∗
cross-section in the normalization region. This uncertainty is due to the PDF and αS uncertainties
obtained from the 90% CL MSTW2008NNLO PDF error set, using the program VRAP [88] in order to calculate the NNLO Drell–Yan cross-section in the normalization region. In addition, scale uncertainties are estimated by varying the renormalization and factorization scales si-multaneously up and down by a factor of two, also using VRAP.
Mass-dependent systematic uncertainties include the-oretical and experimental effects on the signal and back-ground. These uncertainties are correlated across all mℓℓ
bins in the search region. The mass-dependent theoreti-cal uncertainties are applied to the Z/γ∗
background ex-pectation only. In general, theoretical uncertainties are
not applied to the signal. However, the mass dependence of the PDF uncertainty due to acceptance variations was checked and found to be negligible. It is assumed that the experimental uncertainties are fully correlated between the signal and all types of background. In the statistical analysis, all systematic uncertainties estimated to have an impact < 3% on the expected number of events for all values of mℓℓ are neglected, as they have negligible
impact on the results of the search.
The combined uncertainty on the Z/γ∗
background due to PDF (“PDF variation”) and αS is obtained
from the 90% CL MSTW2008NNLO PDF error set, using VRAP in order to calculate the NNLO Drell– Yan cross-section as a function of mℓℓ. The
result-ing uncertainties at dilepton masses of 2 TeV and 3 TeV are given in Tables III and IV, respectively. An additional uncertainty is assigned to take into ac-count potential differences between modern PDFs at the same αS= 0.117: MSTW2008NNLO, CT10NNLO,
NNPDF2.3 [77], ABM11 [89] and HERAPDF1.5 [90]. Of these, only the central values for ABM11 fall outside of the MSTW2008NNLO PDF’s uncertainty band. Thus, an envelope of the latter uncertainty and the ABM11 cen-tral value is formed with respect to the cencen-tral value of the MSTW PDF. The 90% CL uncertainty from MSTW is subtracted in quadrature from this envelope, and the remaining part, which is only non-zero when the ABM11 central value is outside the MSTW2008NNLO PDF un-certainty, is quoted as “PDF choice.” Scale uncertainties are estimated by varying the renormalization and torization scales simultaneously up and down by a fac-tor of two, also using VRAP. The resulting maximum variations are taken as uncertainties and are less than 3%. The uncertainty on the PI correction is taken as half the difference between the predictions obtained un-der the current and constituent quark mass schemes, as discussed in Sec. V. In addition, a systematic uncertainty is attributed to EW corrections for both channels, corre-sponding to the difference in the theoretical calculation between FEWZ and SANC.
On the experimental side, a systematic effect common to both channels is due to an uncertainty of 0.65% on the beam energy [91]. The effect on the background cross-section was evaluated for the dominant Z/γ∗
background only, and it can be as high as 5% at high dilepton masses. For the signals considered here, the effect of this uncer-tainty on A × ǫ is negligible (<1%).
In the dielectron channel, the systematic uncertainty is dominated by the determination of background con-tributions with jets faking electrons in the final state, mainly dijet and W + jets processes. In order to de-rive this uncertainty, the method described above was altered by assuming r1 = r2 = 1. This second
“ma-trix method” leads to a simplification of the ma“ma-trix in Eq. (1), but also necessitates the use of MC corrections for the identification and isolation inefficiencies of real electrons. Large corrections from MC simulation can be avoided in a third “matrix method” where objects in the
background-enriched sample fail the requirement on the matching between track and cluster, instead of the full identification and isolation requirements.
In addition to the standard background-enriched sam-ple recorded using the jet triggers, two alternative background-enriched samples are obtained using a “Tag and Probe” technique on the jet-triggered sample and the sample triggered by electromagnetic objects. Here the choice of an electromagnetic-object trigger that is looser than a dedicated electron trigger (see Sec. IV) leads to an enlarged sample. The background-enriched sample of probes is obtained by selecting a jet-like tag and a probe with the same charge, among other requirements, in or-der to suppress real electron contamination. Finally, the default method and the two additional matrix methods are each used in conjunction with the default sample and the two different background-enriched samples, leading to nine different background estimates. In the mℓℓsearch
region, the maximum deviation of the eight alternative estimates from the default background estimate is 18% and is taken as a systematic uncertainty at all values of mℓℓ.
Furthermore, the different requirements used to sup-press real electron contamination in the default fake-rate calculation are varied. The largest deviations, about 5%, occur when the value of the missing energy requirement is changed. The statistical uncertainty on the fake rates results in an uncertainty on the background of at most 5%.
Another systematic uncertainty can arise if fake rates are different for the various processes contributing to the background, and if the relative contributions of these pro-cesses in the data samples from which the fake rates are measured and in the data sample to which the fake rates are applied are different. Jets originating from bottom quarks have a higher fake rate than jets originating from light-quark jets, but the effect of this is negligible as the number of b-jets is small and similar in both samples. As an additional check, the background is recalculated using all nine methods discussed above, but with separate fake rates for different background processes. The mean of these nine methods is in agreement with the background estimate from the default method.
Thus, adding the different sources of uncertainty in quadrature, an overall systematic uncertainty of 20% is assigned to the dijet and W + jets background. At low invariant masses there is an additional uncertainty due to the statistical uncertainty from the sample to which the fake rates are applied. At high invariant masses this component is replaced by a systematic uncertainty due to the background extrapolation into this region. The extrapolation is done in the same way as for the top quark background (see Sec. V) and dominates the uncertainty on the dijet and W + jets background contribution at the highest invariant masses.
Experimental systematic uncertainties from the elec-tron reconstruction and identification efficiencies, as well as from the energy calibration and resolution are
ne-TABLE III. Summary of systematic uncertainties on the ex-pected numbers of events at a dilepton mass of mℓℓ= 2 TeV, where n/a indicates that the uncertainty is not applicable. Uncertainties < 3% for all values of meeor mµµare neglected in the respective statistical analysis.
Source (mℓℓ= 2 TeV) Dielectrons Dimuons
Signal Backgr. Signal Backgr.
Normalization 4% n/a 4% n/a
PDF variation n/a 11% n/a 12%
PDF choice n/a 7% n/a 6%
αs n/a 3% n/a 3%
Electroweak corr. n/a 2% n/a 3%
Photon-induced corr. n/a 3% n/a 3%
Beam energy < 1% 3% < 1% 3%
Resolution < 3% < 3% < 3% 3%
Dijet and W + jets n/a 5% n/a n/a
Total 4% 15% 4% 15%
glected, as they alter the expected number of events by less than 3%.
For the dimuon channel, the combined uncertainty on the trigger and reconstruction efficiencies is negligi-ble. Inefficiencies may occur for muons with large en-ergy loss due to bremsstrahlung in the outer parts of the calorimeter, interfering with muon reconstruction in the MS. However, such events are rare and the corresponding systematic uncertainty is negligible over the entire mass range considered. This is an improvement on previous ATLAS publications [17], which used a very conservative, and much larger, estimate: 6% at 2 TeV. In addition, the uncertainty on the resolution due to residual misalign-ments in the MS propagates to a change in the steeply falling background shape at high dilepton mass and in the width of signal line shape. The potential impact of this uncertainty on the background estimate reaches 3% at 2 TeV and 8% at 3 TeV. The effect on the signal is negli-gible. As for the dielectron channel, the momentum scale uncertainty has negligible impact in the dimuon channel search.
Mass-dependent systematic uncertainties that change the expected number of events by at least 3% anywhere in the mℓℓ distribution are summarized in Tables III and
IV for dilepton invariant masses of 2 TeV and 3 TeV, respectively.
X. COMPARISON OF DATA AND
BACKGROUND EXPECTATIONS
The observed invariant mass distributions, mee and
mµµ, are compared to the expectation from SM
back-grounds after final selection. To make this comparison, the sum of all simulated backgrounds, with the rela-tive contributions fixed according to the respecrela-tive cross-sections, is scaled such that the result agrees with the observed number of data events in the 80 - 110 GeV normalization region, after subtracting the data-driven
TABLE IV. Summary of systematic uncertainties on the ex-pected numbers of events at a dilepton mass of mℓℓ= 3 TeV, where n/a indicates that the uncertainty is not applicable. Uncertainties < 3% for all values of meeor mµµare neglected in the respective statistical analysis.
Source (mℓℓ= 3 TeV) Dielectrons Dimuons
Signal Backgr. Signal Backgr.
Normalization 4% n/a 4% n/a
PDF variation n/a 30% n/a 17%
PDF choice n/a 22% n/a 12%
αs n/a 5% n/a 4%
Electroweak corr. n/a 4% n/a 3%
Photon-induced corr. n/a 6% n/a 4%
Beam energy < 1% 5% < 1% 3%
Resolution < 3% < 3% < 3% 8%
Dijet and W + jets n/a 21% n/a n/a
Total 4% 44% 4% 23%
background in the case of the electron channel. The scale factors obtained with this procedure are 1.02 in the dielectron channel and 0.98 in the dimuon chan-nel. It is this normalization approach that allows the mass-independent uncertainties to cancel in the statisti-cal analysis.
Figure 2 depicts the mℓℓdistributions for the dielectron
and dimuon final states. The bin width of the histograms is constant in log mℓℓ, chosen such that a possible signal
peak spans multiple bins and the shape is not impacted by statistical fluctuations at high mass. The shaded band in the ratio inset represents the systematic uncertainties described in Sec. IX. Figure 2 also displays the expected Z′
SSMsignal for two mass hypotheses. Table V shows the
number of data events and the estimated backgrounds in several bins of reconstructed dielectron and dimuon in-variant mass above 110 GeV. The number of observed events in the normalization region is 4,257,744 in the dielectron channel and 5,075,739 in the dimuon chan-nel. The higher yield in the normalization region for the dimuon channel, despite the lower A × ǫ at higher masses as displayed in Fig. 1, is due to the higher ET cuts on the
electrons. This reduces the yield in the dielectron chan-nel in the region of the Z peak. The dilepton invariant mass distributions are well described by the predictions from SM processes.
XI. STATISTICAL ANALYSIS
The data are compared to the background expecta-tion in the search region. The comparison is performed by means of signal and background templates [92, 93] that provide the expected yield of events (¯n) in each mℓℓ bin. The dependence of the resonance width on
the coupling strength is taken into account in the signal templates. The coupling to hypothetical right-handed neutrinos and to W boson pairs is neglected in the Z′
search. Interference of the Z′
TABLE V. The numbers of expected and observed events in the dielectron (top) and dimuon (bottom) channel in bins of the invariant mass mℓℓ. The region 80–110 GeV is used to normalize the total background to the data. The errors quoted are the combined statistical and systematic uncertainties.
mee[GeV] 110–200 200–400 400–800 800–1200 1200–3000 3000–4500
Z/γ∗ 122000 ± 7000 14000 ± 800 1320 ± 70 70 ± 5 10.0 ± 1.0 0.008 ± 0.004
Top 8200 ± 700 2900 ± 500 200 ± 80 3.1 ± 0.8 0.16 ± 0.08 < 0.001
Diboson 1880 ± 90 680 ± 40 94 ± 5 5.9 ± 0.4 1.03 ± 0.06 < 0.001
Dijet & W +jet 3900 ± 800 1290 ± 320 230 ± 70 9.0 ± 2.3 0.9 ± 0.5 0.002 ± 0.004
Total 136000 ± 7000 18800 ± 1000 1850 ± 120 88 ± 5 12.1 ± 1.1 0.011 ± 0.005 Observed 136200 18986 1862 99 9 0 mµµ[GeV] 110–200 200–400 400–800 800–1200 1200–3000 3000–4500 Z/γ∗ 111000 ± 8000 11000 ± 1000 1000 ± 100 49 ± 5 7.3 ± 1.1 0.034 ± 0.022 Top 7100 ± 600 2300 ± 400 160 ± 80 3.0 ± 1.7 0.17 ± 0.15 < 0.001 Diboson 1530 ± 180 520 ± 130 64 ± 16 4.2 ± 2.1 0.69 ± 0.30 0.0024 ± 0.0019 Total 120000 ± 8000 13700 ± 1100 1180 ± 130 56 ± 6 8.2 ± 1.2 0.036 ± 0.023 Observed 120011 13479 1122 49 8 0
Yan background is taken into account in the Minimal Z′
Models interpretation framework only. When inter-ference is not taken into account, ¯n is given by ¯n = nX(λ, ννν) + nZ/γ∗(ννν) + nobg(ννν), where nX represents the
number of events produced by the decay of a new res-onance, X (X = Z′
, Z∗
, G∗
, Mth, R1,2), and nZ/γ∗ and
nobgare the number of Z/γ∗(Drell–Yan) and other
back-grounds events, respectively. The symbol λ represents the parameter of interest in the model, and ννν is the set of Gaussian-distributed nuisance parameters incorporating systematic uncertainties. When interference effects are included, ¯n = nX+Z/γ∗(λ, ννν) + nobg(ννν), where nX+Z/γ∗
is the number of signal plus Z/γ∗
events and X is the Z′
boson in the Minimal Models interpretation. A binned likelihood function is employed for the statistical analy-sis. The likelihood function is defined as the product of the Poisson probabilities over all mass bins in the search region, L(λ, ννν) = Nbins Y i e−¯nin¯di di! G(ννν).
The symbol di corresponds to the observed number of
events in bin i of the mℓℓ distribution and G(ννν)
repre-sents the Gaussian functions for the set of nuisance pa-rameters ννν.
The significance of a signal is summarized by a p-value, the probability of observing an excess at least as signal-like as the one observed in data, assuming the null hy-pothesis. The outcome of the search is ranked using a log-likelihood ratio (LLR) test statistic, using a Z′
SSM
template assuming no interference. Explicitly, LLR = −2 ln L(data | ˆnZ′, ˆMZ′, ˆννν)
L(data | (ˆnZ′ = 0), ˆννν)ˆ
,
where ˆnZ′ and ˆMZ′ are the best-fit values for the Z′
nor-malization and the Z′
mass. The nuisance parameters that maximize the likelihood L given the data are rep-resented by ˆννν and ˆννν, assuming in the numerator thatˆ
a Z′
signal is present, and in the denominator that no signal is present. The LLR is scanned as a function of Z′
cross-section and MZ′ over the full considered mass
range. This approach naturally includes the trials factor, which accounts for the probability of observing an excess anywhere in the search region. The observed p-values for the dielectron and dimuon samples are 27% and 28%, respectively.
In the absence of a signal, upper limits on the number of events produced by the decay of a new resonance are determined at 95% CL. The same Bayesian approach [94] is used in all cases, with a uniform positive prior prob-ability distribution for the parameter of interest. When interference is not taken into account, the parameter of interest is the signal cross-section times branching frac-tion (σB). When interference effects are included the coupling strength is chosen as the parameter of interest, with a prior that is flat in the coupling strength to the fourth power. The most likely number of signal events, and the corresponding confidence intervals, are deter-mined from the binned likelihood function defined above. The product of acceptance and efficiency for the signal as a function of mass is different for each model considered due to different angular distributions, boosts, and line shapes. This is propagated into the expectation. The dependence of the likelihood on the nuisance parameters is integrated out using the Markov Chain Monte Carlo method [94].
The expected exclusion limits are determined using simulated pseudo-experiments with only SM processes by evaluating the 95% CL upper limits for each pseudo-experiment for each fixed value of the resonance pole mass, MX. The median of the distribution of limits is
chosen to represent the expected limit. The ensemble of limits is also used to find the 68% and 95% envelopes of the expected limits as a function of MX.
The combination of the dielectron and dimuon chan-nels is performed under the assumption of lepton uni-versality. For each source of systematic uncertainty, the
Events -1 10 1 10 2 10 3 10 4 10 5 10 6 10 7 10 Data 2012 * γ Z/ Top quark Dijet & W+Jets Diboson Z’ SSM (1.5 TeV) Z’ SSM (2.5 TeV) ATLAS ee → Z’ -1 L dt = 20.3 fb
∫
= 8 TeV s [TeV] ee m 0.08 0.1 0.2 0.3 0.4 0.5 1 2 3 4 Data/Expected 0.6 0.8 1 1.2 1.4 Events -1 10 1 10 2 10 3 10 4 10 5 10 6 10 7 10 Data 2012 * γ Z/ Top quark Diboson Z’ SSM (1.5 TeV) Z’ SSM (2.5 TeV) ATLAS µ µ → Z’ -1 L dt = 20.5 fb∫
= 8 TeV s [TeV] µ µ m 0.08 0.1 0.2 0.3 0.4 0.5 1 2 3 4 Data/Expected 0.6 0.81 1.2 1.4FIG. 2. Dielectron (top) and dimuon (bottom) invariant mass (mℓℓ) distributions after event selection, with two se-lected Z′
SSM signals overlaid, compared to the stacked sum of all expected backgrounds, and the ratios of data to back-ground expectation. The bin width is constant in log mℓℓ. The green band in the ratio plot shows the systematic uncer-tainties described in Sec. IX.
correlations across bins, as well as the correlations be-tween signal and background, are taken into account.
XII. MODEL INTERPRETATION AND
RESULTS
As no evidence for a signal is observed, limits are set in the context of the physics models introduced in Sec. II. For all but the Minimal Z′ Models, limits are set on σB
versus the resonance mass. The predicted σB is used to derive limits on the resonance mass for each model. Table VI lists the predicted σB values for a few reso-nance masses and model parameters. In the case of the Minimal Z′
Models, limits are set on the effective cou-plings as a function of the resonance mass to incorporate interference effects of the Z′
signal with the Drell–Yan background. [TeV] SSM Z’ M 0.5 1 1.5 2 2.5 3 3.5 B [pb] σ -5 10 -4 10 -3 10 -2 10 -1 10 1 Expected limit σ 1 ± Expected σ 2 ± Expected Observed limit SSM Z’ ATLAS ll → SSM Z’ = 8 TeV s -1 L dt = 20.3 fb
∫
ee: -1 L dt = 20.5 fb∫
: µ µFIG. 3. Median expected (dashed line) and observed (solid red line) 95% CL upper limits on cross-section times branch-ing ratio (σB) in the combined dilepton channel, along with predicted σB for Z′
SSM production. The inner and outer bands show the range in which the limit is expected to lie in 68% and 95% of pseudo-experiments, respectively. The thickness of the Z′
SSM theory curve represents the theoretical uncertainty from the PDF error set and αS, as well as the choice of PDF.
A. Limits on narrow spin-1 Z′
SSM, E6 Z′ and Z∗ bosons
For the Z′
SSM, E6-motivated Z′ and Z∗ bosons, the
model specifies the boson’s coupling strength to SM fermions and therefore the intrinsic width. The param-eter of interest in the likelihood analysis is therefore σB as a function of the new boson’s mass.
Figure 3 presents the expected and observed exclusion limits on σB at 95% CL for the combined dielectron and dimuon channels for the Z′
SSMsearch. The observed limit
is within the ±2σ band of expected limits for all MZ′.
TABLE VI. Values of σB for the different models. The model parameter M corresponds to the mass of the Z′, Z′
χ, Zψ′, Z∗ and G∗boson. For the QBH models, M = Mth corresponds to the threshold mass, while for the MWT model M = MR1.
The value M = 3 TeV is not applicable for the MWT model, as the range of the limits is up to 2.25 TeV.
σB [fb]
Model M = 1 TeV M = 2 TeV M = 3 TeV
Z′ SSM 170 3.4 0.21 Z′ χ 93 1.5 0.062 Z′ ψ 47 0.87 0.032 Z∗ 300 4.0 0.076 G∗, k /MPl=0.1 190 1.8 0.044 RS QBH 56 0.40 0.0065 ADD QBH 11000 96 1.8 MWT, ˜g = 2 31 0.17 n/a
[TeV] SSM Z’ M 0.5 1 1.5 2 2.5 3 3.5 B [pb] σ -4 10 -3 10 -2 10 -1 10 µ µ Expected limit µ µ Observed limit Expected limit ee Observed limit ee Expected limit ll Observed limit ll SSM Z’ ATLAS ll → SSM Z’ = 8 TeV s -1 L dt = 20.3 fb
∫
ee: -1 L dt = 20.5 fb∫
: µ µ µ µ Expected limit µ µ Observed limit Expected limit ee Observed limit ee Expected limit ll Observed limit ll SSM Z’FIG. 4. Median expected (dashed line) and observed (solid line) 95% CL upper limits on cross-section times branching ratio (σB) for Z′
SSMproduction for the exclusive dimuon and dielectron channels, and for both channels combined. The width of the Z′
SSMtheory band represents the theoretical un-certainty from the PDF error set, the choice of PDF as well as αS.
Figure 3 also contains the Z′
SSMtheory band for σB. Its
width represents the theoretical uncertainty, taking into account the following sources: the PDF error set, the choice of PDF, and αS. The value of MZ′ at which the
theory curve and the observed (expected) 95% CL limits on σB intersect is interpreted as the observed (expected) mass limit for the Z′
SSMboson, and corresponds to 2.90
(2.87) TeV.
A comparison of the combined limits on σB and those for the exclusive dielectron and dimuon channel is given in Figure 4. This demonstrates the contribution of each channel to the combined limit. As expected from Fig. 1, the larger values for A×ǫ in addition to the better resolu-tion in the dielectron channel results in a stronger limit than in the dimuon channel. The observed (expected) Z′
SSMmass limit is 2.79 (2.76) TeV in the dielectron
chan-nel, and 2.53 (2.53) TeV in the dimuon channel.
Figure 5 shows the observed σB exclusion limits at 95% CL for the Z′ SSM, Z ′ χ, Z ′ ψ and Z ∗ signal searches. Here only observed limits are shown, as they are always very similar to the expected limits (see Fig. 4). The the-oretical σB of the boson for the Z′
SSM, two E6-motivated
Models and Z∗
are also displayed. The 95% CL limits on σB are used to set mass limits for each of the considered models. Mass limits obtained for the Z′
SSM, E6-motivated
Z′
and Z∗
bosons are displayed in Table VII.
As demonstrated in Fig. 5, for lower values of MZ′ the
limit is driven primarily by the width of the signal and gets stronger with decreasing width. At large MZ′, the
σB limit for a given Z′
model worsens with increasing mass. This weakening of the limit is due to the pres-ence of the parton-luminosity tail in the mℓℓ line shape.
The magnitude of this degradation is proportional to the
[TeV] Z’ M 0.5 1 1.5 2 2.5 3 3.5 B [pb] σ -4 10 -3 10 -2 10 SSM Observed limit Z’ χ Observed limit Z’ ψ Observed limit Z’ Observed limit Z* SSM Z’ χ Z’ ψ Z’ Z* ATLAS = 8 TeV s -1 L dt = 20.3 fb
∫
ee: -1 L dt = 20.5 fb∫
: µ µ SSM Observed limit Z’ χ Observed limit Z’ ψ Observed limit Z’ Observed limit Z* SSM Z’ χ Z’ ψ Z’ Z*FIG. 5. Observed upper cross-section times branching ra-tio (σB) limits at 95% CL for Z′
SSM, E6-motivated Z′and Z∗ bosons using the combined dilepton channel. In addition, the-oretical cross-sections on σB are shown for the same models. The stars indicate the lower mass limits for each considered model. The width of the Z′
SSM band represents the theoret-ical uncertainty from the PDF error set, the choice of PDF as well as αS. The width of the ZSSM′ band applies to the E6-motivated Z′ curves as well.
size of the low-mass tail of the signal due to much higher background levels at low mℓℓ compared to high mℓℓ. All
Z′ models exhibit a parton-luminosity tail, the size of
which increases with increasing natural width of the Z′
resonance. The tail is most pronounced for Z′
SSM, and
least for Z′
ψ, in line with the different widths given in
Table VII. Even though the width of the Z∗
is similar to the width of the Z′
SSM, the tensor form of the coupling of
the Z∗to fermions strongly suppresses parton luminosity
effects. Limits on σB for the Z∗interpretation therefore
do not worsen with increasing invariant mass. Quantita-tively, the observed Z′
SSMmass limit would increase from
2.90 TeV to 2.95 TeV and 3.08 TeV, if the Z′ χand Z
′ ψ
bo-son signal templates, with smaller widths, were used. If the Z∗boson template with negligible parton-luminosity
tail but similar width were used instead of the Z′
SSM
tem-plate, the observed limit would increase to 3.20 TeV.
TABLE VII. Observed and expected lower mass limits for Z′ and Z∗bosons, using the corresponding signal template for a given model.
Model Width Observed Limit Expected Limit
[%] [TeV] [TeV] Z′ SSM 3.0 2.90 2.87 Z′ χ 1.2 2.62 2.60 Z′ ψ 0.5 2.51 2.46 Z∗ 3.4 2.85 2.82