Publisher’s version / Version de l'éditeur: Journal of Building Physics, pp. 1-34, 2013-10-15
READ THESE TERMS AND CONDITIONS CAREFULLY BEFORE USING THIS WEBSITE.
https://nrc-publications.canada.ca/eng/copyright
Vous avez des questions? Nous pouvons vous aider. Pour communiquer directement avec un auteur, consultez la première page de la revue dans laquelle son article a été publié afin de trouver ses coordonnées. Si vous n’arrivez pas à les repérer, communiquez avec nous à PublicationsArchive-ArchivesPublications@nrc-cnrc.gc.ca.
Questions? Contact the NRC Publications Archive team at
PublicationsArchive-ArchivesPublications@nrc-cnrc.gc.ca. If you wish to email the authors directly, please see the first page of the publication for their contact information.
NRC Publications Archive
Archives des publications du CNRC
This publication could be one of several versions: author’s original, accepted manuscript or the publisher’s version. / La version de cette publication peut être l’une des suivantes : la version prépublication de l’auteur, la version acceptée du manuscrit ou la version de l’éditeur.
For the publisher’s version, please access the DOI link below./ Pour consulter la version de l’éditeur, utilisez le lien DOI ci-dessous.
https://doi.org/10.1177/1744259113505748
Access and use of this website and the material on it are subject to the Terms and Conditions set forth at
Energy retrofit using vacuum insulation panels: an alternative solution
for enhancing the thermal performance of woodframe walls
Saber, Hamid H.; Maref, Wahid; Ganapathy, Gnanamurugan; Nicholls, Mike
https://publications-cnrc.canada.ca/fra/droits
L’accès à ce site Web et l’utilisation de son contenu sont assujettis aux conditions présentées dans le site LISEZ CES CONDITIONS ATTENTIVEMENT AVANT D’UTILISER CE SITE WEB.
NRC Publications Record / Notice d'Archives des publications de CNRC: https://nrc-publications.canada.ca/eng/view/object/?id=2474b62a-855b-434e-b39b-52a41e2f8193 https://publications-cnrc.canada.ca/fra/voir/objet/?id=2474b62a-855b-434e-b39b-52a41e2f8193
Energy Retrofit using VIPs - an Alternative Solution for Enhancing the
Thermal Performance of Wood-Frame Walls
Hamed H. Saber*, Wahid Maref, Ganapathy Gnanamurugan and Mike Nicholls
Building Envelope and Materials Program NRC-Construction, National Research Council Canada
Bldg. M-24, 1200 Montreal Road, Ottawa, Ontario, Canada K1A 0R6 *Corresponding Author (hamed.saber@nrc-cnrc.gc.ca, phone: 613-993-9772)
ABSTRACT
Field monitorings of the thermal performance of residential 2 x 6 wood-frame wall systems that had been retrofitted using Vacuum Insulation Panels (VIPs) and extruded polystyrene foam (XPS) panels were undertaken in May 2011 - May 2012 at the Field Exposure of Walls Facility (FEWF) of NRC-Construction. The main objective of this research was to measure the steady-state and transient thermal performance of three wall assemblies (4 ft x 6 ft), two of which incorporated VIPs within an XPS Tongue and Groove (T&G) configuration and VIPs within an XPS Clip-On (C-O) configuration, and a third assembly incorporating only XPS. The three wall assemblies were installed in the FEWF for a one year cycle of exposure to outdoor natural weather conditions. The results of the model calculations were in good agreement with the experimental data. Given that the VIPs could be punctured during the installation process (e.g. inadvertent use of fasteners in wall assembly) or could fail during normal operating conditions, additional model calculations were used to predict the thermal resistance (R-value) in cases where one or more VIPs failed. The model was also used to predict the yearly cumulative heat losses across these wall systems. It is important to point out that the aging effect and the effect of the thermal bridging due the envelope (i.e. skin) of the VIPs are not accounted for in this study. However, sensitivity analysis of the thickness and thermal conductivity of the VIP envelope was conducted in this paper to investigate the effect of these parameters on the effective R-values of VIP. The results showed that the yearly cumulative heating load for the XPS retrofit wall specimen was 69.9% and 78.8%, respectively, greater than that obtained for the T&G and the C-O VIP retrofit wall specimens. Furthermore, the results showed that the effect of the furred-airspace assembly in the C-O VIP retrofit wall specimen, when assuming the emissivity of all surfaces that bounded the airspace to be 0.9, resulted in a reduction in the yearly heating load by 5% as compared to the T&G VIP retrofit wall specimen without furred-airspace.
Keywords: Vacuum Insulation Panel (VIP), thermal resistance, thermal performance, retrofit, wood-frame
wall systems, energy savings.
INTRODUCTION
Increasingly, home builders are turning towards a variety of construction and retrofit methods to improve thermal performance whilst reducing the operating cost of construction. The energy crisis in the 70’s had a major effect on building technology related to energy performance. Thermal insulation of buildings became the key element to minimize heat losses and hence improve energy performance. Adding more thermal insulation on the exterior wall and increasing the airtightness of the assembly was an evident solution adopted by many practitioners to achieve reduced energy usage in homes. Achieving better airtightness, however, high levels of envelope insulation will certainly be required with wall thermal resistances (R-values) of more than 3.33 m2K /W and roof R-values of more than 5.0 m2K /W [1, 2]. Normally, the air
leakage and airtightness across the wall systems depends on the type of insulation materials, air-barrier systems, and the pressure differential across the wall systems [1-6].
To achieve high levels of energy performance, the wall systems would need to be considerably thicker and this may be less acceptable to consumers because of the loss of usable floor area as well as new challenges for the structure associated with greatly increased wall thickness. To maintain reasonable envelope thickness while having high thermal performance, however, a promising recent innovation in building technology was investigated within the context of its application using Vacuum Insulation Panel (VIP) systems. By considering the center of the panel, VIPs are of interest owing to their exceptional insulating R-value, up to R-60 per inch or even higher [1-2, 7]. This concept is gaining interest and is being considered by architects and building practitioners for new and retrofit construction [8]. In the case of accounting for the thermal bridging due the envelope (i.e. skin) of the VIP, the effective R-value might be lower than that at the center of the panel.
Despite their high R-values at the center of the panels, VIPs have been slow to make inroads into construction because of three drawbacks: cost, the need to protect them against puncturing and the absence of long-term performance data or procedures to predict their long-term performance. Recently, Canadian and European research efforts have mainly focused on the core materials and the envelopes of the VIPs themselves [9-12]. Also, research efforts are now being made to investigate how to integrate VIPs in building construction in such a way that the thermal advantages are fully used. Preliminary efforts have been published in reports of the IEA Annex 39 related to High Performance Thermal Insulation [12-14].
The VIP technology can be used in retrofitting existing homes, for example, either at the interior or at the exterior of the wall assembly [16]. It can also be used in new construction such as in double stud wood-frame construction [17]. Most of the VIP activities in Canada are still in the research and development phase with some demonstration projects that have been recently completed [1, 2]. Germany and Switzerland are the first two countries where VIP technology has been introduced to the building construction sector through research efforts such as those undertaken within the IEA Annex 39 [14].
Since VIP technology is currently considerably more costly than established insulating technologies, in the future measures such as improved production capacity and efficient manufacturing techniques, as well as alternative and less expensive core material for VIPs [9] will likely contribute in making VIP insulation more cost-effective for building envelopes. Several prototype projects have been completed or are being carried out in Europe using VIP technology [13]. Given the need for improvement in insulation technology for building envelopes, there is an expectation that further technological developments in insulation technology will occur in the coming years. Hence, NRC of Canada and other organizations and laboratories around the world have established research programs and studies that focus on the applicability of high performance VIPs in building envelope constructions. More specifically, NRC-Construction, together with the Natural Resources Canada (NRCan) and the Canada Mortgage and Housing Corporation (CMHC) have recently focused their combined research efforts on the “Next Generation Building Envelope Building Systems” and the manner in which VIPs can provide alternative solutions for enhancing the thermal performance of wood-frame walls.
OBJECTIVES
The objective of this paper is to evaluate the thermal performance of three 2 x 6 wood-frame wall assemblies, two of which incorporated VIPs within either an XPS Tongue and Groove (T&G) configuration or VIPs within an XPS Clip-On (C-O) configuration, and a third assembly incorporating only XPS. The three wall assemblies were installed in NRC-Construction’s Field Exposure of Walls Facility (FEWF), for a one year cycle of exposure to outdoor natural weather conditions. The model results were compared with the measured data of different wall systems that were tested in the period between May 2011 and May 2012. Given that the VIPs could be punctured during the installation process (e.g. inadvertent use of fasteners in
wall assembly) or that some panels could fail during normal operating conditions, the numerical model was used to determine the wall R-values when one or more VIPs failed. Also, the model was used to investigate the reduction in R-value of walls incorporating VIPs when one or more VIPs were replaced by an XPS layer of the same thickness as the VIP. Finally, the model was used to calculate the the average yearly thermal performance of each of the respective wall systems.
DESCRIPTION OF RETROFITTED WALL SPECIMENS
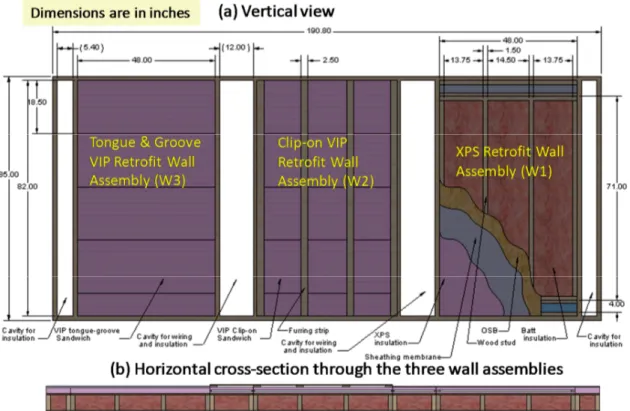
Three wall specimens (4 ft x 6 ft) conforming to typical residential wood-frame construction were installed side-by-side in the FEWF. The different material layers and the dimensions of the wall specimens are shown in Figure 1 and Figure 2. The backup wall for all three retrofit strategies consists of interior drywall (1/2 inch thick), polyethylene air barrier (6 mil), 2 x 6 wood-frame with friction-fit glass fibre batt insulations, OSB (7/16 inch thick), and Tyvek sheathing membrane. The backup wall was retrofitted by adding different types of external insulations. The first wall (W1) was retrofitted by adding an XPS layer (2 inch thick) between the sheathing membrane and vinyl siding. The other two walls were retrofitted with Vacuum Insulation Panels (VIPs) using two concepts as described below. No information is available about the type of the material of the VIP envelope (i.e. skin) and the degree of vacuum inside the VIP.
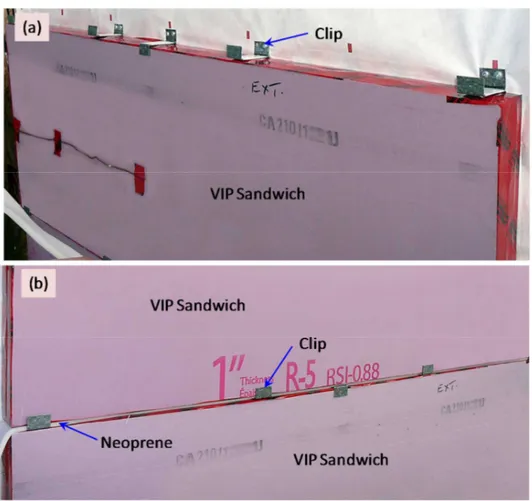
In the second retrofit concept, each VIP having nominal thickness of 15 mm (5 panels in total) was sandwiched between an exterior XPS board (1 inch thick) and an interior XPS board (5/8 inch thick). Note that VIPs of thickness of 20 mm and thicker up to 40 mm are common in Germany and Switzerland. To protect the VIP, a hollow piece of XPS of the same thickness as the VIP was cut and the VIP panel was placed inside the opening such that the VIP would be protected by the XPS surround. The effect of thermal bridging of the XPS surround on the effective R-value of the wall assembly was accounted for by the numerical model. The assembly consisting of the VIP and XPS surround was placed between the exterior and interior XPS layers to form a “Tongue and Groove (T&G)” VIP “sandwich”, as shown in Figure 3. A thin glue layer was applied on the surfaces of the VIP to insure good thermal contact between the VIP and the XPS layers. Five T&G VIP “sandwiches” were assembled (friction-fit at the Tongue and Groove interfaces, see Figure 3c). Then the entire assembly of T&G VIPs was placed vertically between the sheathing and smart board for the retrofitted wall specimen. The smart board used in study, called “waferboard” is a class of mat-formed structural panels made predominantly of wood wafers.
In the third retrofit concept (see Figure 4), the VIP sandwich was similar to the VIP sandwich described in the second concept but without the tongue and groove assembly. In this concept, five VIP sandwiches were assembled using clips. Hence, the retrofitted wall specimen was called “Clip-On” (C-O) VIP. To insure good contact, a foamed polychloroprene (neoprene) gasket was inserted between the VIP sandwiches as shown in Figure 4b. The C-O VIP assembly was stacked vertically against the surface of the sheathing membrane. Vertical furring strips (16 inch o.c. and 5/8 inch thick) were attached to metal clips, which supported the C-O VIP assembly and provided the nailing surface to which the smart board (waferboard) was attached. Detailed descriptions for the instrumentation (i.e. thermocouples, heat flux transducers, pressure sensors and RH sensors) of the reference wall (W1), the C-O VIP (W2), and the T&G VIP (W3) are available in Maref et al. [18]. As a part of the test protocol, all thermocouples used in the three test specimens were calibrated. Also, all heat flux transducers were calibrated according to the ASTM C-1130 [35]. The uncertainties of temperature and heat flux measurements were ± 0.1oC and ± 5%, respectively.
MODEL DESCRIPTION AND PREVIOUS COMPARIASON WITH THE MEASURED VALUES
The numerical model that was used in this study, called hygIRC-C, simultaneously solves the highly nonlinear 2D and 3D Heat, Air and Moisture (HAM) equations. This model has been extensively benchmarked in a number of other projects and has been used in several related studies to assess the thermal
and hygrothermal performance of wall and roofing systems. The 3D version of this model was used to conduct numerical simulations for different full-scale wall assemblies incorporating, or not, penetrations representative of a window installation, such that the effective R-value of the assemblies could be predicted, taking into consideration air leakage across the assembly. The predicted R-values for these walls, which incorporated different types of spray polyurethane foams or glass fiber insulation, were in good agreement (within ± 5%) with the measured R-values that were obtained from testing in a Guarded Hot Box (GHB) [3
-6].
The present model was also benchmarked against GHB test results [24] and then used to conduct numerical simulations to investigate the effect of foil emissivity on the effective thermal resistance of different wall systems with foil bonded to different types of thermal insulations placed in furred-airspace assemblies, in which the foil was adjacent to the airspace [20, 23, 26]. Recently, this model was benchmarked against the test data of different types of reflective insulations [28-29] that were obtained using the ASTM C-518 test method, and then used to examine the thermal performance of different types of reflective insulation assemblies. As provided in [28-29], the heat fluxes predicted by the model were in good agreements with the measured heat fluxes (within 1.0%). Furthermore, the present model was benchmarked and used to assess the thermal performance of Insulated Concrete Form (ICF) wall systems when placed in the FEWF and subjected to yearly periods of Canadian climate [21-22, 32-33]. In these studies [3-6, 20-29, 32-33], no moisture transport was accounted for in predicting the thermal performance of different types of walls. In instances where the model was used to account for moisture transport across wall assemblies, the present model predicted the drying rate of a number of wall assemblies subjected to different outdoor and indoor boundary conditions [19] in which there was a significant vapour drive across the wall. The results showed that there was overall agreement between the results derived from the present model and the hygIRC-2D model, a model that had been previously developed and benchmarked at the NRC [34]. The present model predictions were in good agreement with the experimental measurements of drying rate of the assembly in respect to the shape of the curve and the length of time predicted for drying. As well, the predicted average moisture content of the different wall assemblies over the test periods were in good agreement, all being within ±5% of those measured [19]. Furthermore, in respect to the prediction of the hygrothermal performance of roofing systems, the present model was used to investigate the moisture accumulation and energy performance of reflective (white) and non-reflective (black) roofing systems that were subjected to different climatic conditions of North America [30, 31].
Having previously benchmarked the present model against experimental data of several tests undertaken in controlled laboratory conditions, a subsequent and important step in this study was to benchmark the present model against field measurements. The general parameters affecting the thermal response of wall specimens are discussed next, information is provided regarding assumptions, and initial and boundary conditions that were used in conducting the numerical simulations. Thereafter, results are given from the prediction of the thermal resistance and dynamic heat transmission of the different wall specimens obtained from the simulation. Finally, the estimated yearly cumulative heating and cooling loads for the respective wall specimens that were estimated on the basis of results derived from the model are discussed.
GENERAL PARAMETERS AFFECTING THE THERMAL PERFORMANCE OF WALL SPECIMENS
The thermal response of the wall specimens depends on both the thermal properties of all material layers of the wall specimen, and the outdoor and indoor conditions. All thermal properties of the different layers of which the wall assemblies were composed, with the exception of the Vacuum Insulation Panels (VIPs), were taken from the ASHRAE Handbook of Fundamentals [37]. However, the properties of the VIPs had been previously characterized in another study (see references [1, 2] for more details). The thermal conductivity of
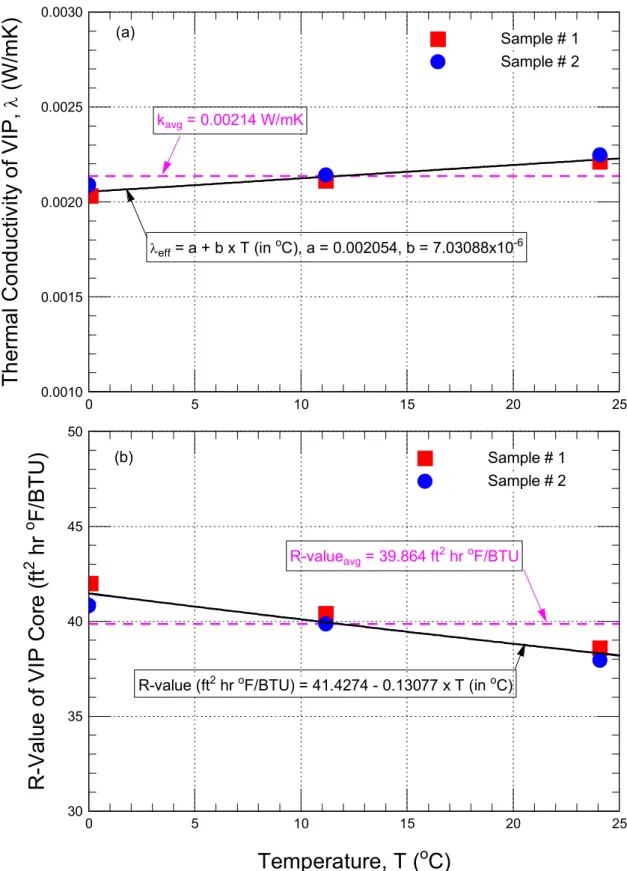
the VIP layer was measured at different temperatures. Two VIP specimens having a nominal thickness of 15 mm, and length and width of 1200 and 455 mm, respectively, were used to measure the thermal conductivity at three mean temperatures. The measured density of the VIP samples was 261.2 kg/m3. It is important to
point out that the type of the VIP that was used in this project is proprietary product. The details about the composition of this type of VIP such as degree of vacuum inside the VIP, type of fiber core material inside the VIP, and type of material and its thickness of the VIP envelope are not available.
The test method used to measure the thermal conductivity of the VIP was ASTM C-518 [36]. The use of heat flow meter apparatus according to the ASTM C-518 test method when there are thermal bridges present in the assembly may yield results that are unrepresentative of the assembly (see [36] for more details). According to the ASTM C-518 test method [36], the thermocouples embedded in the surfaces of the upper and lower plates (12 inch (305 mm) x 12 inch (305 mm)) of the heat flow meter measure the temperature drop across the specimen and the Heat Flux Transducer (HFT) embedded in each plate measures the heat flow through the specimen. The size of HFT in the NRC’s heat flow meter is 6 inch (152 mm) x 6 inch (152 mm). The uncertainty of the measurements in this test method is ±2%. As indicated earlier the size of the VIP sample is 1200 mm x455 mm, which is larger than the size of upper and bottom plates of the heat flow meter (305 mm x 305 mm). As such, the measured R-value of the VIP using the heat flow meter is not the effective R-value because the effect of thermal bridging due to the VIP edges is not accounted for. The limitations of using the test method of ASTM C-518 [36] for measuring the R-values of samples with thermal bridging are recently addressed by Saber [28, 29]. Alternatively, the ASTM C-1363 test method using the GHB can be used to determine the effective thermal resistance of sample with thermal bridges [38]. In this paper, the values of the thermal resistance and the corresponding thermal conductivity of the VIP are applicable to the center core of the VIP only. These values are applicable to whole VIP only in one case when the thermal conductivity of VIP envelope (i.e. skin) is the same as the thermal conductivity of the center core of the VIP. In Figure 5a and Figure 5b are respectively shown the dependence of the thermal conductivity and R-value of the center core of the VIP samples on the temperature. The measured thermal conductivity of the VIP, (in W/(mK)), as a function of temperature, T (in °C), that was used in the
numerical simulation is given as:
. 10 7.03088 = b 0.002054, = a , -6 a b T (1)
The above correlation of is in good agreement with all measured values at different temperatures (within ±1.6%). In Figure 5b it is shown that the average R-value of the center core of the VIP sample (15 mm thick) is 7.03 m2K/W (39.9 ft2hroF/BTU).
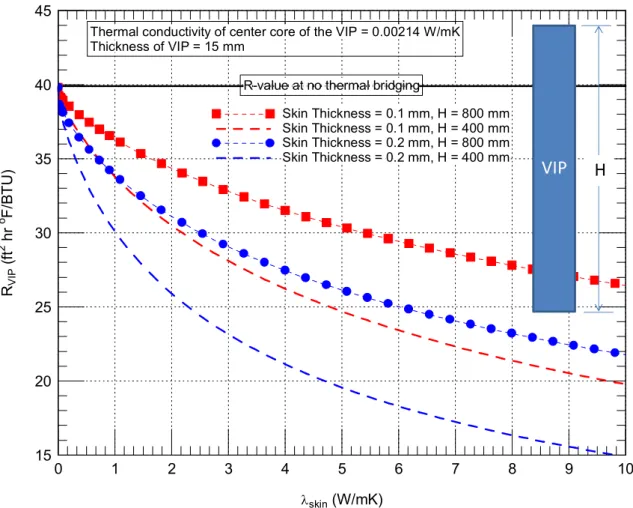
To quantify the effect of the thermal bridging due to the envelope of the VIP on its effective R-value, 2-D numerical simulations were conducted for VIPs of 15 mm thick, and have different heights (H) of 400 mm and 800 mm and different envelope thicknesses (skin) of 0.1 mm and 0.2 mm. The 2-D numerical
simulations represent the case of using VIP of a large width. In these simulations, the thermal conductivity of the VIP core was taken equal to the measured value using the ASTM C-518 test method (0.00214 W/(mK)), whereas a wide range was considered for the thermal conductivity of the VIP envelope (ranging from 0.00214 – 10.0 W/(mK)). Figure 6 shows the dependence of the effective R-values of the VIP (RVIP) of
different H and skin and on the thermal conductivity of its envelope (skin). As shown in this figure, the
parameters H, skin, and skinhave a significant effect on the effective R-value of the VIP. For example, for
VIP of skin = 0.2 mm and H = 400 mm, the RVIP decreases by 33% (from 39.9 ft2hroF/BTU to 30.0
ft2hroF/BTU) as skin increases from 0.00214 W/(mK) to 1.0 W/(mK). At skin = 1.0 W/(mK) and H = 400
mm, increasing skin from 0.1 mm to 0.2 mm resulted in a decrease in the RVIP by 13% (from 33.8
ft2hroF/BTU to 30 ft2hroF/BTU). Furthermore, at
400 mm to 800 mm resulted in an increase of RVIPby 7.4% (from 33.8 ft2hroF/BTU to 36.3 ft2hroF/BTU). In
summary, the results shown in Figure 6 clearly indicated that the thermal bridging due the envelope of the VIP can have a significant effect on its effective R-value. This effect, however, was neglected in this study due to lack of information about the envelope of the VIP. Also, due to lack of information about the change of the degree of vacuum inside the VIP with time, the aging effect on the effective R-value was not accounted for in this study.
The thermal conductivity and R-value of the VIP were also measured using the ASTM C-518 test method [36] when the VIP failed. These measurements were conducted in order to investigate the reduction in R-value of a retrofitted wall specimen incorporating VIPs for which one or more VIPs had failed. The measured values of thermal conductivity and R-value when the VIP failed were 0.0257 W/(m.K) and 3.32 ft2hroF/BTU, respectively. It is important to point out that the thermal conductivity of the VIP when it is
failed is approximately equal to the thermal conductivity of still air. Furthermore, when the VIP failed, its thermal conductivity is significantly increased by a factor of ~12 (increased from 0.00214 W/(m.K) to 0.0257 W/(m.K)); and this resulted in a significant reduction in its R-value (from 39.9 ft2hroF/BTU to 3.32
ft2hroF/BTU). Consequently, consideration and care should be given in handling and installing VIPs in the
wall systems so as to minimize the risk of puncturing them. The present model was used to predict the steady-state and transient thermal performance of different wall systems (W1, W2 and W3).
Assumptions
It was assumed that all material layers were in perfect contact (i.e. the interfacial thermal resistances between all material layers were neglected). Due to lack of information about the type of VIP that was used in this project, the effects of aging and thermal bridging due to the envelope of the VIP were neglected. Note that the constructive thermal bridges in the different wall systems (W1, W2 and W3) were obviously considered in this study. The emissivity of all surfaces that bounded the airspaces (i.e. airspaces between XPS layer and vinyl siding for W1, and airspaces between vertical furring, C-O VIP assembly and waferboard for W2) was taken equal to 0.9 [37]. The effect of heat transfer by conduction, convection and radiation inside these airspaces on the thermal performance of W1 and W2 were accounted for. The effect of installing foil of low emissivity on one or more surfaces that bound the airspaces on the thermal performance of W1 and W2 will be investigated and subsequently addressed in future publications.
Surface-to-surface R-value of wall specimens
One of the objectives of this study was to determine the R-values of wall specimens with different retrofit strategies. The surface-to-surface R-value was determined as:
/
/ and/ outd,tot outd,surf outd,avg
outd T Q A T q
R (2)
/
/ ./ ind,tot ind,surf ind,avg
ind T Q A T q
R (3)
Note that the air-to-air R-value can easily be determined after adding the reciprocal of the outdoor and indoor film coefficients (1/houtd1/hind) to the R-value given by Eqs. (2) and (3). When the outdoor and indoor surface areas are not equal, which is the case of the three wall specimens considered in this study (W1, W2 and W3), the R-value can be calculated either based on the outdoor surface area (Routd, Eq. (2)) or based on the indoor surface area (Rind , Eq. (3)).
In Eqs. (2) and (3), represents the surface-to-surface temperature difference across the wall specimen, T
, 1 1 , , , , , ,
surf ind surf outd A surf ind surf ind A surf outd surf outd dA T A dA T A abs T (4) where: surf outdT , and Tind,surf are the local temperatures of the outdoor and indoor surfaces, and Aoutd,surf and Aind,surf
are the areas of the outdoor and indoor surfaces of the wall specimen, respectively. Also, in Eqs. (2) and (3),
avg outd
q , and qind ,avg are the average value of heat flux on the outdoor and indoor surfaces, respectively. These heat fluxes represent the total heat passing across the wall specimen (i.e. from the indoor surface to the outdoor surface during winter conditions and in the opposite direction during summer conditions)
surf outd tot outd avg outd Q A q , , / ,
( and qind ,avg Qind,tot/Aind,surf). The respective average values of heat flux are calculated by performing the following numerical integrations:
, 1 / and , 1 / , , , , , , , , , , , , , ,
surf ind surf outd A surf ind n surf ind surf ind tot ind avg ind A surf outd n surf outd surf outd tot outd avg outd dA q A A Q q dA q A A Q q (5)where: qn,outd,surf and qn,ind,surf are the local normal heat fluxes on the outdoor and indoor surfaces of the wall specimen, respectively.
In the case of allowing for the side heat losses from the top and bottom surfaces of the wall specimens, the values of Qoutd,tot and Qind,tot given by Eq. (5) are not equal. However, to calculate the R-value using Eqs. (2) and (3), the heat losses from the periphery of surfaces of the wall specimens (i.e. lateral edge, top and bottom) should be eliminated. This can be achieved by applying an adiabatic boundary condition on these surfaces. Consequently, the values of Qoutd,tot and Qind,tot given in Eq. (5) are equal (due to energy conservation). Note that in the case of conducting experiments to measure the R-value of a specimen using one of the standard test methods (e.g. ASTM C-518 [36] or ASTM C-1363 [38]), to achieve an accurate measurement for the R-value, the edge heat losses from the specimen must be minimized.
When the outdoor and indoor surface areas of a wall specimen are equal (Aoutd,surf Aind,surf Asurf), for example see references [3-6], the average heat fluxes on these surfaces will also be equal
)
(qoutd ,avg qind ,avg qavg . In this case, the R-value can be given as:
avg ind
outd R T q
R
R / (6)
In this study, because the surface areas of the outdoor surface (vinyl siding for W1 and smart board for W2 and W3) and indoor surface (drywall) are not equal, it is important to point out that all R-values given in this paper for different wall specimens are the surface-to-surface R-values based on the indoor surface (see Eq. (3)).
Initial and Boundary Conditions
The initial temperature in all material layers of specimens W1, W2 and W3 was assumed uniform and equal to 10.0oC. Since this initial temperature was not the same as in the test, it was anticipated that the predicted
dynamic response of the different wall specimens in the first period of the test (say first 24 – 48 hr) would be different from that obtained in the test itself. Due to symmetry, only one module of each wall system was modeled, which is formed from a vertical plane passing through the middle of the stud and a vertical plane passing through the middle of the stud cavity (see the green dashed boxes shown in Figure 2a,b,c). The
boundary conditions on these vertical planes are adiabatic (due to symmetry). The boundary conditions on the top and bottom surfaces of one module of the wall systems are adiabatic (i.e. no edge heat losses). As indicated earlier, applying adiabatic conditions on these surfaces permits calculating the surface-to-surface R-values of the wall specimens using Eq. (2) or Eq. (3).
In this study, two types of numerical simulations were conducted:
(a) Steady-state numerical simulations to determine the R-values of different wall specimens. In this case, the outdoor surface of the vinyl siding for W1 and smart board (waferboard) for W2 and W3 were subjected to convective boundary conditions with an air temperature of -35oC and heat transfer
coefficient of 34.0 W/m2K [38]. Similarly, the indoor surface of the gypsum board for all wall
systems was subjected to a convective boundary condition with constant air temperature and heat transfer coefficient of 21.0oC and 8.29 W/m2K, respectively [38]. Note that the boundary conditions
on the outdoor and indoor surfaces of the wall specimens are similar to the case of measuring the R-value using the Guarded Hot Box (GHB) in accordance with ASTM C-1363 “Standard Test Method for the Thermal Performance of Building Assemblies by Means of a Hot Box Apparatus” [38].
(b) Transient numerical simulations were conducted in order to benchmark the present model and then determine the yearly heating and cooling loads for different wall specimens. In this case, the outdoor surface of the vinyl siding for W1 and smart board (waferboard) for W2 and W3 were subjected to temperature boundary conditions. Similarly, the indoor surface of the gypsum board for all wall systems was subjected to a temperature boundary condition. The temperatures on the outdoor and indoor surfaces of different wall specimens (changed with time) were taken equal to that measured on these surfaces (see reference [18] for more details). As an example, these temperatures are shown in Figure 7 for wall W1.
THERMAL RESISTANCES OF DIFFERENT WALL SPECIMENS
As indicated earlier, the present model was extensively benchmarked in previous studies [1, 3, 5, 5, 24, 28, 29] by comparing the predicted R-values against the measured R-values obtained using two standard test methods: (a) Guarded Hot Box in accordance with ASTM C-1363 [38], and (b) heat flow meter in accordance of ASTM C-518 [36]. Results showed that the predictions of the present model were in good agreement with the experimental data (within the uncertainties of the ASTM C-1363 test method [38] and ASTM C-518 test method [36]). After gaining confidence in the present model, it was used to predict the R-values of the three residential 2 x 6 wood-frame wall specimens that were retrofitted using thermal insulations of XPS (W1) and VIPs (W2 and W3). As indicated earlier, due to symmetry, only one module of the different wall systems was modeled, which expands from the half width of the stud to the half width of stud cavity.
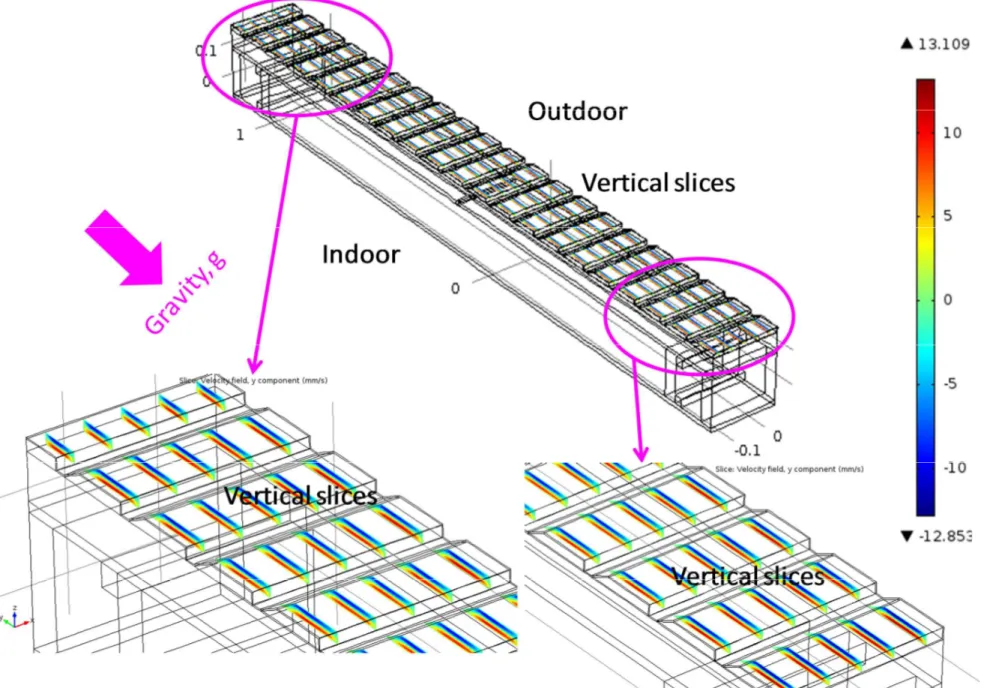
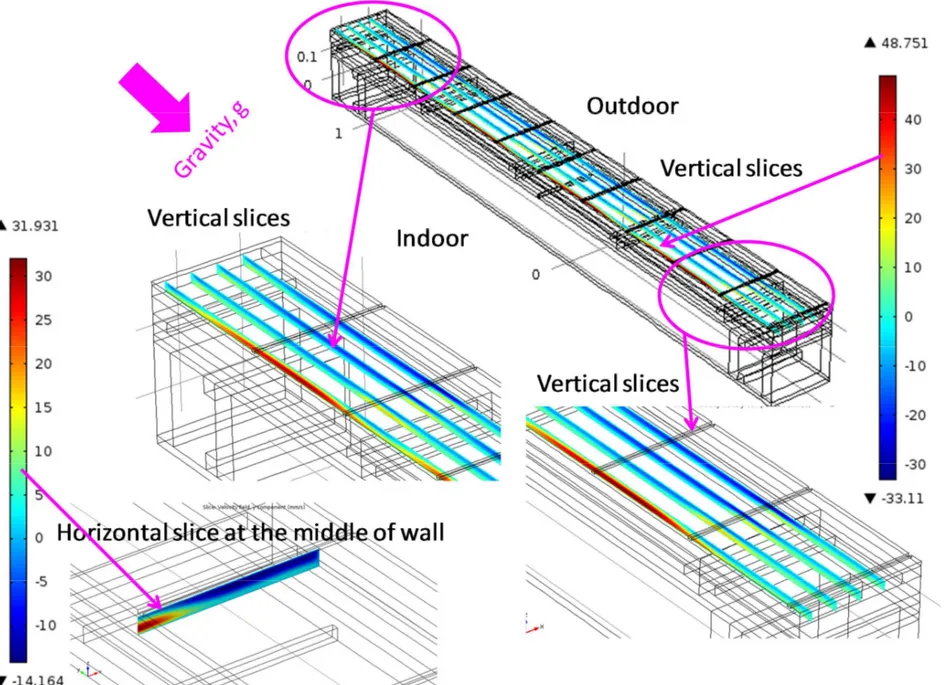
Figure 8 shows the vertical velocity distributions through five vertical slices in the enclosed airspaces between the XPS and the vinyl siding for the XPS retrofit wall assembly (W1). Also, Figure 9 shows the vertical velocity distributions through four vertical slices and one horizontal slice (along the mid-height of the wall) in the airspace between the vertical furring and the smart board of the C-O VIP retrofit wall assembly (W2). The temperature differential across the enclosed airspaces of these wall specimens caused a buoyancy-driven flow in the enclosed airspace resulting in a convection loop where a mono-cellular airflow was developed with one vortex cell in each of the enclosed airspaces. Note that the heat transfer by conduction, convection and radiation in the enclosed airspaces were accounted for when the emissivity of all surfaces that bounded the airspaces was assumed to be 0.9 [37].
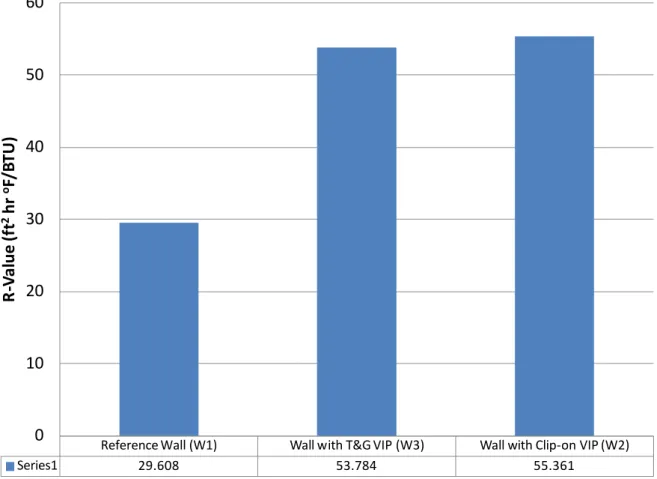
As indicated earlier, all values given in this study for different wall specimens are the surface-to-surface R-values based on the indoor surface (see Eq. (3)) when the outdoor temperature and heat transfer coefficient are -35oC and 34 W/(m2K) respectively, and the indoor temperature and heat transfer coefficient are
respectively 21oC and 8.29 W/(m2K) [38]. Figure 10 shows a comparison between the R-values for different
wall specimens. As shown in this figure, the XPS retrofit wall assembly (W1) resulted in the lowest R-value (29.6 ft2hr oF/BTU); whereas the C-O VIP retrofit wall assembly (W2) resulted in the highest R-value (55.4
ft2hr oF/BTU). The R-value of the T&G VIP retrofit wall assembly, W3 (without furred-airspace) was 53.8
ft2hr oF/BTU, which is lower than that for W2 by 1.58 ft2hr oF/BTU. This means that the furred-airspace in
the C-O VIP retrofit wall assembly (W2) having surface emissivity of all surfaces bounded in the airspace of 0.9 [37] contributed to the R-value by a value of 1.58 ft2hr oF/BTU. The contribution to the R-value would
increase if low emissivity material (e.g. foil with low emissivity) were installed on the surfaces that bound the airspace (e.g. see references [20, 23-24, 26-29]).
As explained in reference [18], the test results of the C-O VIP retrofit wall specimen (W2) showed that one of the VIPs failed during normal operation (at time = 202 day). At time = 271 day, this VIP was subsequently replaced by a new VIP component once it became apparent that the expected thermal performance of the wall was not being achieved. The R-value of the failed VIP was measured using the ASTM C-518 test method [36], and found to reduce the R-value from 39.9 ft2hroF/BTU to 3.32 ft2hroF/BTU
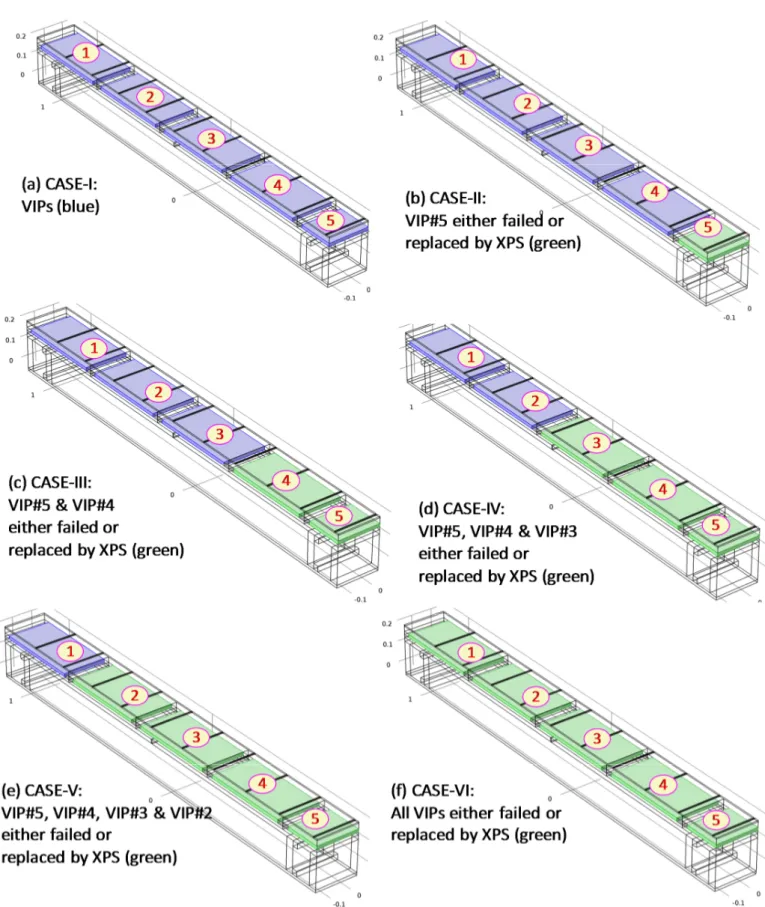
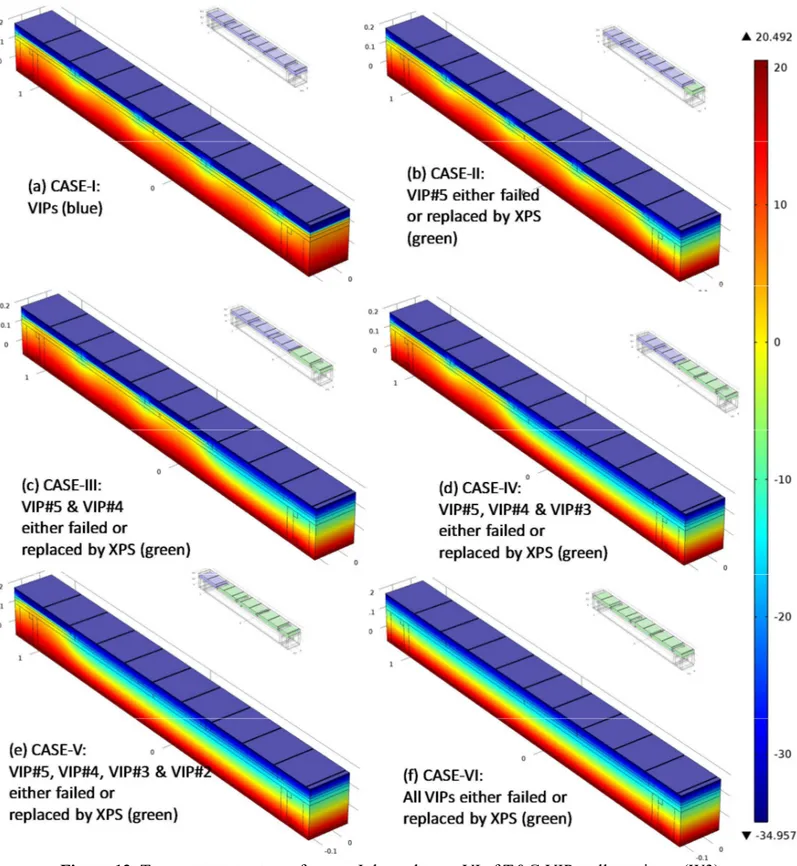
(a factor of ~12). Consequently, because there is always a risk of puncturing VIPs either during the installation process or over the course of its in-service use, a parametric study was conducted to predict the R-value of the wall assembly when one or more VIPs is punctured or failed by other means. Furthermore, because the VIP is more expensive than an XPS panel, this parametric analysis was conducted to determine the R-value when one or more VIPs is replaced by an XPS panel of the same dimension as that of the VIP. In these analyses, six cases were considered. These cases are shown in Figure 11a through Figure 11f for the T&G VIP wall specimen (W3). In Figure 11f, the case-VI represents the situation when the five VIPs in Figure 11a are either failed or replace by an XPS layer. When one or more VIPs is replaced by an XPS layer, the temperature distributions for the different cases (i.e. case-I through case-VI) are shown in Figure 12a through Figure 12f.
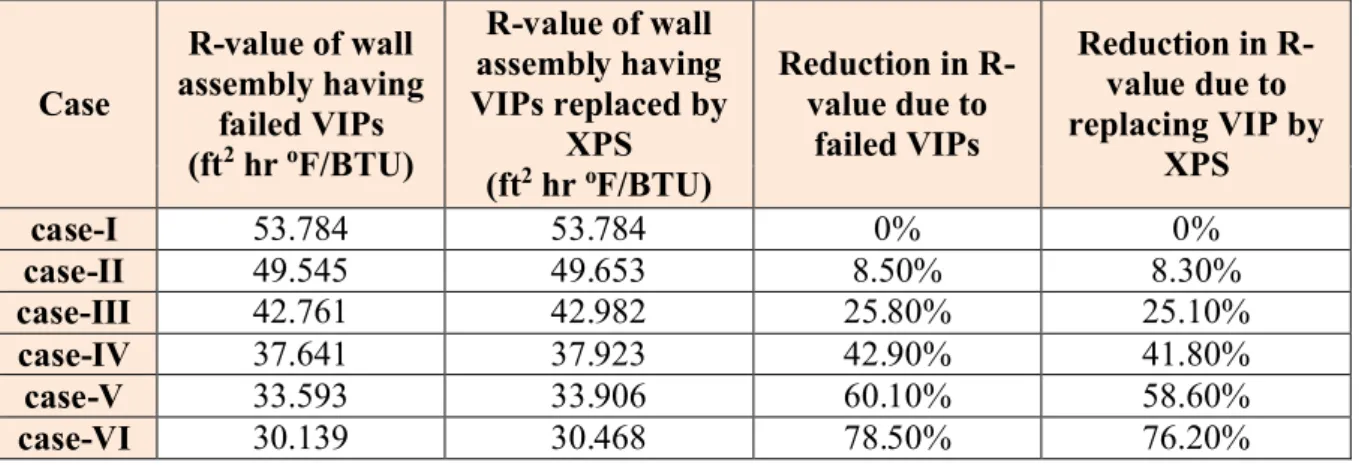
Comparisons of the surface-to-surface R-values based on the indoor surface (Eq. (3)) of the T&G VIP wall specimen (W3) for case-I through case-VI (see Figure 11) when the VIP is failed or replaced by an XPS layer are shown in Figure 13. Also, Table 1 shows the reduction of the R-values when the VIP is replaced by an XPS layer or failed.
Table 1. Comparisons between R-values for case I through case VI (see Figure 11) of T&G VIP wall
specimen (W3) Case R-value of wall assembly having failed VIPs (ft2hr oF/BTU) R-value of wall assembly having VIPs replaced by XPS (ft2hr oF/BTU) Reduction in R-value due to failed VIPs Reduction in R-value due to replacing VIP by XPS case-I 53.784 53.784 0% 0% case-II 49.545 49.653 8.50% 8.30% case-III 42.761 42.982 25.80% 25.10% case-IV 37.641 37.923 42.90% 41.80% case-V 33.593 33.906 60.10% 58.60% case-VI 30.139 30.468 78.50% 76.20%
It is important to indicate that when all VIPs failed (case-VI, Figure 13), the R-value of the T&G VIP wall specimen (R = 30.139 ft2hr oF/BTU) is only 1.8% higher than that of the reference wall (XPS retrofit wall
specimen, R = 29.608 ft2hr oF/BTU, see Figure 10). Therefore, consideration must be given when handling
As indicated earlier, the measured thermal conductivity and R-value when the VIP failed were 0.0257 W/(m.K) and 3.32 ft2hroF/BTU, respectively. On the other hand, the R-value of XPS layer (thermal
conductivity = 0.029 W/(m.K) [37]) of the same thickness as VIP (15 mm thick) is 2.94 ft2hroF/BTU, which
is approximately equal to the R-value of the VIP when it failed. As such, the reduction in the R-value when replacing VIP by an XPS layer is approximately the same as when the VIP failed (see Figure 13). For example, for the situation when the VIP is replaced by an XPS layer, the results given in Figure 13 and Table 1 show that the R-values are reduced by 8.3%, 25.1%, 41.8%, 58.6% and 76.2% for II, III, case-IV, case-V and case-VI, respectively, which are approximately the same as when the VIP failed. Hence, unless the VIP panel itself can be replaced, there is no benefit in respect to thermal performance of the overall assembly in replacing it with an XPS panel. Note that as indicated earlier, the effect of the thermal bridging due the envelope (i.e. skin) of VIP on the total R-values of the wall systems was not accounted for. The above comparisons between the performance of different wall specimens may change in the case of accounting for the effect of thermal bridging due to the VIP envelope.
During the test period, it was noted that the VIP#2 in the C-O VIP wall specimen had failed at time = 202 day (see reference [18] for more details). Numerical simulations were conducted to predict the R-value for this situation for both the T&G VIP and the C-O VIP wall specimens. The results obtained for the temperature distribution through a lateral slice passing through the middle of the wall and R-values of the assembly are shown in Figure 14 and Figure 15. For the T&G VIP wall specimen (R = 53.784 ft2 hr oF/BTU), the results given in Figure 14 show that the R-value was reduced to R = 45.876 ft2hr oF/BTU in the
case where VIP#2 only failed, and R = 30.468 ft2hr oF/BTU when all VIPs were replaced by XPS layers (a
reduction of 17.2% and 76.2%, respectively). Similarly, for the C-O VIP wall specimen, the results given in Figure 15 show that the R-value (R = 55.361 ft2 hr oF/BTU) was reduced by 16.5% and 75.5% in the cases
when VIP#2 failed (R = 47.503 ft2hr oF/BTU) and when all VIPs were replaced by XPS layers (R = 31.545
ft2hr oF/BTU), respectively.
DYNAMIC HEAT TRANSMISSION IN DIFFERENT WALL SPECIMENS
In order to benchmark the present model, and hence determine the yearly heating and cooling loads of different wall specimens, transient numerical simulations were conducted for the three wall specimens (W1, W2 and W3). In these simulations, the initial temperature in all material layers of the wall specimens was assumed uniform and equal to 10.0oC. For the purpose of benchmarking the present model, the indoor and
outdoor surfaces for all wall systems were subjected to temperature boundary conditions (e.g. see Figure 7 for wall W1). A description of all instrumentation and measurements are available in Maref et al. [18]. In each wall system, three Heat Flux Transducers (HFTs) were used to measure the heat flux at the middle (mid-height and mid-width) of each wall at three interfaces, namely [18]:
(a) HFT1 at the cladding – XPS interface (cladding type: vinyl siding for W1, smart board for W2 and W3);
(b) HFT2 at the XPS – OSB interface, and;
(c) HFT3 at the polyethylene air barrier – gypsum interface.
As an example, for the XPS retrofit wall specimen (W1), Figure 16 shows a comparison between the measured and the predicted values of heat flux at the XPS – OSB interface during the test period. As shown in this figure, the predicted heat flux is in good agreement with the measurements. Furthermore, the detail comparisons between the predicted and measured heat fluxes at the other interfaces of the different layers as described above for the three wall specimens (W1, W2 and W3) are available elsewhere [39]. The results showed that both predicted and measured values of heat fluxes were in good agreements (see [39] for more details).
YEARLY CUMULATIVE HEATING AND COOLING LOADS
After the present model was benchmarked, it was used to predict the yearly cumulative heating and cooling loads for the different wall specimens and subjected to the climatic condition of Ottawa in the period between May 2011 and May 2012. The predicted heat flux on the indoor surface of the gypsum board for the XPS retrofit wall specimen, the T&G VIP retrofit wall specimen and the C-O VIP retrofit wall specimen are given Figure 17, Figure 18 and Figure 19, respectively. In these figures, positive values of heat flux represent the case when cooling loads are needed whereas negative values of heat flux, shown in these figures, represent the case when heating loads are needed. Note that the effect of thermal mass of all wall layers was accounted for. The negative and positive heat fluxes shown in these figures were used to calculate the cumulative energy loss (i.e. yearly heating load shown in Figure 20) and cumulative energy gain (i.e. yearly cooling load shown in Figure 20), respectively. As shown in Figure 20, the yearly cooling loads were approximately the same for the different wall specimens given that over the test period which occurred over the summer season, the outdoor temperature was close to that of the indoor temperature. However, the yearly heating load for the XPS retrofit wall specimen (744 W-day/m2) was 69.9% and 78.8%, respectively, higher than that for the
T&G VIP retrofit wall specimen (438 W-day/m2), and the C-O VIP retrofit wall specimen (416 W-day/m2).
By comparing the wall specimens that were retrofitted with VIPs, the effect of the Furred-Airspace Assembly (FAA) in the C-O VIP retrofit wall specimen when the emissivity of all surfaces bounding the airspace was 0.9 [37], resulted in a reduction in the yearly heating load by 5.0% compared to the T&G VIP retrofit wall specimen without FAA. Installing foil with low emissivity on the surfaces that bounded the FAA (e.g. installing foil on the XPS surface) would result in further enhancement in the thermal performance for the C-O VIP retrofit wall specimen. As such, future work is recommended to quantify the amount of enhancement in the thermal performance for the C-O VIP retrofit wall specimen for the installation of low emissivity foil on the surfaces of the FAA.
SUMMARY AND CONCLUSIONS
To maintain reasonable envelope thickness while having high thermal performance, a promising recent innovation in building technology was investigated within the context of its application using Vacuum Insulation Panel (VIP) systems. This concept is gaining interest and is being considered by architects and building practitioners for new and retrofit construction. In this study, steady-state and transient numerical simulations were conducted to predict the thermal performance of residential 2 x 6 wood-frame wall specimens that were retrofitted using Vacuum Insulation Panels (VIPs) (W2 and W3) and extruded polystyrene foam, XPS (W1). Numerical simulations were conducted in order to investigate the effect of the thermal bridging due to the envelope of the VIP on its effective R-value. Depending on the VIP size, and the thickness of VIP envelope and its thermal conductivity, the results showed that the thermal bridging due the VIP envelope can have a significant effect on its effective R-value. This effect, however, was neglected in this study due to lack of information about the envelope of the VIP.
In order to determine the R-values of different wall specimens, steady-state numerical simulations were conducted using the same outdoor and indoor conditions as described in the standard test method using a Guarded Hot Box (GHB) (in accordance of the ASTM C-1363 [38]). Results showed that the XPS retrofit wall specimen resulted in the lowest R-value (29.6 ft2 hr oF/BTU), whereas the C-O VIP retrofit wall
specimen resulted in the highest R-value (55.4 ft2 hr oF/BTU). The R-value of the T&G VIP retrofit wall
specimen (without furred-airspace) was 53.8 ft2 hr oF/BTU, which was lower than that for the C-O VIP
retrofit wall specimen (with furred-airspace) by a margin of 1.58 ft2hr oF/BTU. Furthermore, because there
is a risk that the VIP may fail either during the installation process or during in-service conditions, a parametric study was conducted to predict the R-value when one or more VIPs failed.
In the second part of this study, transient numerical simulations were conducted in order to benchmark the present model and then determine the yearly heating and cooling loads for different wall specimens. The numerical results derived for heat flux were compared with the measured values of heat flux and the results showed that the comparison between the model predictions and experimental data were in good agreement. Thereafter, the model was used to predict the yearly heating loads for different wall specimens. Results showed that the yearly heating loads for the XPS retrofit wall specimen (744 W-day/m2) was 69.9% and
78.8%, respectively, higher than that for the T&G VIP retrofit wall specimen (438 W-day/m2), and the C-O
VIP retrofit wall specimen (416 W-day/m2). For the wall specimens that were retrofitted with VIPs, the
effect of the furred-airspace in the C-O VIP retrofit wall specimen when the emissivity of all surfaces that bounded the airspace was 0.9 resulted in a reduction in the yearly heating load by 5.0% compared to the T&G VIP retrofit wall specimen without furred-airspace. It is important to mention that the conclusion of this paper may change when the effect of thermal bridging due to the VIP envelope is significant. In general, research study on VIPs should continue in order to improve thermal resistance by reducing for example thermal bridging due to the VIP envelope and improving the way that it is manufactured. By considering the center of the panel, VIPs are of interest owing to their exceptional insulating R-value, up to 10.6 m2K/W (60
ft2hroF/BTU) per inch or even higher. ACKNOWLEDGMENTS
The authors wish to thank Mr. Silvio Plescia from the Canada Mortgage and Housing Corporation (CMHC) and Mr. Anil Parekh from the Natural Resources Canada (NRCan) for providing guidance and funding for this project. Funding from NRC-Construction has enabled NRC-Construction to build, operate and maintain a state-of-the-art Field Exposure of Walls facility (FEWF) that was used in this project. Also, the authors thank Dr. Phalguni Mukhopadhyaya and Mr. David van Reenen for their technical support.
REFERENCES
1. Maref, W., Saber, H.H., Glazer, R., Armstrong, M.M., Nicholls, M., Elmahdy, H., Swinton, M.C., “Energy performance of highly insulated wood-frame wall systems using a VIP”, 10th International Vacuum Insulation Symposium (Ottawa, Ontario 2011-09-15), pp. 68-76.
2. Maref, W., Saber, H.H., Armstrong, M.M., Glazer, R., Ganapathy, G., Nicholls, M., Elmahdy, H., Swinton, M.C., Integration of Vacuum Insulation Panels into Canadian Wood Frame Walls, Report 1-Performance Assessment in the Laboratory, Client Report – B1253, Building Envelope Engineering Materials Program, Construction Portfolio, National Research Council of Canada, Ottawa, Canada, 2012. 3. Elmahdy, H., Maref, M., Saber, H.H., Swinton, M.C, and Glazer, R. “Assessment of the Energy Rating of Insulated Wall Assemblies a Step Towards Building Energy Labelling”, 10thInternational Conference
for Enhanced Building Operations (ICEBO2010), Kuwait, October 2010.
4. Elmahdy, A.H., Maref, W., Swinton, M.C., Saber, H.H., and Glazer, R. “Development of energy ratings for insulated wall assemblies”, Building Envelope Symposium, San Diego, California, October 26, 2009, pp. 21-30.
5. Saber, H.H., Maref, W., Elmahdy, H., Swinton, M.C., and Glazer, R. “3D Heat and Air Transport Model for Predicting the Thermal Resistances of Insulated Wall Assemblies”, Journal of Building Performance
Simulation, vol. 5, no. 2, pp. 75-91, March 2012, (NRCC-53583),
http://dx.doi.org/10.1080/19401493.2010.532568.
6. Saber, H.H., Maref, W., Elmahdy, A.H., Swinton, M.C., and Glazer, R. “3D Thermal Model for Predicting the Thermal Resistances of Spray Polyurethane Foam Wall Assemblies”, Building XI conference, Clearwater, Florida, 2010.
7. Ogden, R. and Kendrick, C., “VIP Cladding Panels for Buildings: Applications and Conceptual Solutions”, 7th International Vacuum Insulation Symposium Proceedings, pp. 153-160, EMPA,
8. Mukhopadhyaya, P., “High-performance thermal insulation - better than ever”, Solplan Review, (153), pp. 1-3. 2010-07-17
9. Cremers, J.M., “Typology of Applications for Opaque and Translucent VIP in the Building Envelope and their Potential for Temporary Thermal Insulation”, 7th International Vacuum Insulation Symposium
Proceedings, pp. 189-196, EMPA, Duebendorf, Zurich, Switzerland, September 28-29, 2005.
10. Mukhopadhyaya, P., “High Performance Vacuum Insulation Panel-Research Update from Canada”, NRCC-48705, pp. 1-16. and Global Insulation Magazine, Oct. 2006, pp. 9-15.
11. Mukhopadhyaya, P., Kumaran, M.K.; Normandin, N.; van Reenen, D.; Lackey, J.C., “High performance vacuum insulation panel: development of alternative core materials”, Journal of Cold Regions Engineering, 22, (4), pp. 103-123. 2008-12-01, NRCC-49493.
12. Mukhopadhyaya, P., Kumaran, M.K.; Normandin, N.; van Reenen, D.; Lackey, J.C., “Fiber-Powder Composite as Core Material for Vacuum Insulation Panel”, 9th International Vacuum Insulation
Symposium, London, UK, September 17-18, 2009, pp. 1-9.
13. Simmler, H. and Brunner, S., “Aging and Service Life of VIP in Buildings”, 7th International Vacuum
Insulation Symposium Proceedings, pp. 15-22, EMPA, Duebendorf, Zurich, Switzerland, September 28-29, 2005.
14. HiPTI-High Performance Thermal Insulation, IEA /ECBCS Annex 39, “Vacuum Insulation in the Building Sector: Systems and Applications”. 2005.
15. Binz, A. and Steinke, G., “Applications of Vacuum Insulation in the Building Sector”, 7th International
Vacuum Insulation Symposium Proceedings, pp. 43-48, EMPA, Duebendorf, Zurich, Switzerland, September 28-29, 2005.
16. Rogatzki, P., “Pre-fabricated Cavity Walls-the potential for Vacuum Insulated Panels”, 9th International
Vacuum Insulation Symposium, September 17-18, 2009, pp. 1-26.
17. Maref, W., “Program of Energy Research and Development - PERD“, Internal Communication, April 27, 2011.
18. Maref, W., Saber, H.H., Ganapathy, G., and Nicholls, M., Field Energy Performance and Hygrothermal Evaluation of Different Strategies of Energy Retrofit for Residential Wood-Frame Wall Systems Field using VIP, Part I – Field Monitoring and Thermal Performance, Internal Research Report, National Research Council of Canada, Ottawa, December 2012.
19. Saber, H.H., Maref, W., Lacasse, M.A., Swinton, M.C., and Kumaran, K. “Benchmarking of Hygrothermal Model against Measurements of Drying of Full-Scale Wall Assemblies” International Conference on Building Envelope Systems and Technologies, ICBEST 2010, Vancouver, Canada, June 27-30, 2010.
20. Saber, H.H., Maref, W., and Swinton, M.C. “Thermal Response of Basement Wall Systems with Low Emissivity Material and Furred Airspace” Journal of Building Physics, vol. 35, no. 2, pp. 353-371, 2012, URL: http://www.nrc-cnrc.gc.ca/obj/irc/doc/pubs/nrcc53962.pdf.
21. Saber, H.H., Maref, W., Armstrong, M.M., Swinton, M.C., Rousseau, M.Z., and Ganapathy, G., "Benchmarking 3D Thermal Model against Field Measurement on the Thermal Response of an Insulating Concrete Form (ICF) Wall in Cold Climate", Eleventh International Conference on Thermal Performance of the Exterior Envelopes of Whole Buildings XI (Clearwater, FL, USA, December 4-9, 2010).
22. Armstrong, M., Saber, H.H., Maref, W., Rousseau, M.Z., Ganapathy, G., and Swinton, M.C., “Field Energy Performance of an Insulating Concrete Form (ICF) Wall”, 13th CCBST conference - Winnipeg 2011, The 13th Canadian Conference on Building Science and Technology, Winnipeg, Manitoba May 10 – 13, 2011.
23. Saber, H.H., Swinton, M.C. “Determining through Numerical Modeling the Effective Thermal Resistance of a Foundation Wall System with Low Emissivity Material and Furred – Airspace” International Conference on Building Envelope Systems and Technologies, ICBEST 2010, Vancouver, Canada, June 27-30, 2010.
24. Saber, H.H., Maref, W., Swinton, M.C., and St-Onge, C., "Thermal analysis of above-grade wall assembly with low emissivity materials and furred-airspace," Journal of Building and Environment, volume 46, issue 7, pp. 1403-1414, 2011, DOI:10.1016/j.buildenv.2011.01.009.
25. Saber, H.H, and Laouadi, A. “Convective Heat Transfer in Hemispherical Cavities with Planar Inner Surfaces (1415-RP)” Journal of ASHRAE Transactions, Volume 117, Part 2, 2011.
26. Saber, H.H., and Maref, W., “Effect of Furring Orientation on Thermal Response of Wall Systems with Low Emissivity Material and Furred-Airspace”, The Building Enclosure Science & Technology (BEST3) Conference, held in April 2-4, 2012 in Atlanta, Georgia, USA.
27. Saber, H.H., “Thermal Performance of Wall Assemblies with Low Emissivity” Journal of Building
Physics, vol. 36, no. 3, pp. 308-329, 2013, DOI: 10.1177/1744259112450419.
28. Saber, H.H., “Investigation of Thermal Performance of Reflective Insulations for Different Applications” Journal of Building and Environment, 52, p. 32-44, 2012, DOI: 10.1016/j.buildenv.2011.12.010.
29. Saber, H.H., Maref, W., Sherrer, G., Swinton, M.C. “Numerical Modelling and Experimental Investigations of Thermal Performance of Reflective Insulations”, Journal of Building Physics, vol. 36, no. 2, pp. 163-177, 2012 (NRCC-54538), DOI: 10.1177/1744259112444021.
30. Saber, H.H., Swinton, M.C., Kalinger, P., and Paroli, R.M., “Hygrothermal Simulations of Cool Reflective and Conventional Roofs”, 2011 NRCA International Roofing Symposium, Emerging Technologies and Roof System Performance, held in Sept. 7-9, 2011, Washington D.C., USA.
31. Saber, H.H., Swinton, M.C., Kalinger, P., and Paroli, R.M., “Long-Term Hygrothermal Performance Of White And Black Roofs In North American Climates”, Journal of Building and Environment, 50, p. 141-154, 2012, DOI: 10.1016/j.buildenv.2011.10.022.
32. Armstrong, M., Maref, W., Saber, H.H., Rousseau, M.Z., Ganapathy, G., Swinton, M.C., “The impact of the thermal mass on field energy performance of insulating concrete form (ICF) wall” International Workshop on Whole Building Testing, Evaluation and Modelling for Energy Assessment (Copenhagen, Denmark 2011-05-18), pp. 1-12.
33. Saber, H.H.; Maref, W.; Armstrong, M.M.; Swinton, M.C.; Rousseau, M.Z.; Gnanamurugan, G. “Numerical Simulations to Predict the Thermal Response of Insulating Concrete Form (ICF) Wall in Cold Climate “, Research Report-310, NRC Institute for Research in Construction, 310, 2011-04-01. 34. Maref, W., Kumaran, M.K., Lacasse, M.A., Swinton, M.C., and van Reenen, D. “Laboratory
measurements and benchmarking of an advanced hygrothermal model”, Proceedings of the 12th International Heat Transfer Conference, Grenoble, France, August 18, 2002, pp. 117-122 (NRCC-43054). 35. ASTM Designation: C 1130-07, “Standard Practice for Calibrating Thin Heat Flux Transducers”, Annual
Book of ASTM Standards, sec 4, Construction, vol. 04.06, Thermal Insulation; Building & Environment Acoustic, pp. 577-584, 2009.
36. ASTM Designation: C-518-04, Steady-State Thermal Transmission Properties by Means of the Heat Flow Meter Apparatus, Section 4, Volume 04.06, Thermal Insulation, 2007 Book of ASTM Standards. 37. ASHRAE. 2009. 2009 ASHRAE Handbook –Fundamentals (SI), Chapter 26, Atlanta: American Society
of Heating, Refrigerating, and Air-Conditioning Engineers Inc.
38. ASTM. 2006. ASTM C-1363, Standard Test Method for the Thermal Performance of Building Assemblies by Means of a Hot Box Apparatus, 2006 Annual Book of ASTM Standards 04.06:717–59, www.astm.org.
39. Saber, H.H., Maref, W., and Ganapathy, G., Field Energy Performance and Hygrothermal Evaluation of Different Strategies of Energy Retrofit for Residential Wood-Frame Wall Systems Using VIP, Part – II: Model Benchmarking and Numerical Simulations, Internal Research Report, National Research Council of Canada, Ottawa, December 2012.
Figure 1. Schematic of the three residential 2 in x 6 in wood-frame wall test specimens installed side-by-side
in the FEWF
Figure 3. Tongue and Groove (T&G) VIP assembly (W3)
Figure 5. Measured thermal conductivity and R-value at the center core of the of VIP samples (15 mm thick) 30 35 40 45 50 0 5 10 15 20 25 Sample # 1 Sample # 2 (b) R-valueavg= 39.864 ft2hroF/BTU
R-value (ft2hroF/BTU) = 41.4274 - 0.13077 x T (inoC)
Temperature, T (
oC)
R
-V
al
ue
o
fV
IP
C
o
re
(f
t
2hr
oF
/B
T
U
)
0.0010 0.0015 0.0020 0.0025 0.0030 0 5 10 15 20 25 Sample # 1 Sample # 2 (a) eff= a + b x T (inoC), a = 0.002054, b = 7.03088x10⁻⁶ kavg= 0.00214 W/mKT
h
er
m
al
C
on
d
uc
tiv
ity
o
fV
IP
,
(W
/m
K
)
Figure 6. Effect of thermal bridging due to VIP envelope on its effective R-value
Figure 7. Temperature measurements on the indoor and outdoor surfaces of the XPS retrofit wall
assembly (W1) 15 20 25 30 35 40 45 0 1 2 3 4 5 6 7 8 9 10 Skin Thickness = 0.1 mm, H = 800 mm Skin Thickness = 0.1 mm, H = 400 mm Skin Thickness = 0.2 mm, H = 800 mm Skin Thickness = 0.2 mm, H = 400 mm R-value at no thermal bridging
Thermal conductivity of center core of the VIP = 0.00214 W/mK Thickness of VIP = 15 mm skin(W/mK) RV IP (f t 2 hr o F /B T U ) VIP H -30 -25 -20 -15 -10 -5 0 5 10 15 20 25 30 35 40 45 50 55 0 30 60 90 120 150 180 210 240 270 300 330 360 Interior Surface Exterior Surface
Time = 0 corresponding to May 15, 2011 12:01:22 AM
Time (day) T e m p er at ur e ( o C )
Figure 9. Vertical velocity distribution in airspace between vertical furring, C-O VIP assembly and smart board for C-O VIP retrofit wall
Figure 10. Comparisons between the R-values of different wall specimens without considering
the effect of thermal bridging due to the envelope of the VIPs
Reference Wall (W1) Wall with T&G VIP (W3) Wall with Clip-on VIP (W2)
Series1 29.608 53.784 55.361 0 10 20 30 40 50 60 R-Va lu e (f t 2hr oF/ BT U )
Figure 11. Schematics of different cases when VIP is either failed or replaced by XPS panel (see the green dashed
Figure 13. Comparisons between R-values for case I through case VI (see Figure 11) of T&G
VIP wall specimen (W3) without considering the effect of thermal bridging due to the envelope of the VIPs
Figure 14. Comparisons between R-values for case I, when VIP#2 is failed, and all VIPs
were replaced by XPS (see Figure 11) of T&G VIP wall specimen (W3)
CASE-I CASE-II CASE-III CASE-IV CASE-V CASE-VI
XPS instead of VIP 53.784 49.653 42.982 37.923 33.906 30.468 Failed VIP 53.784 49.546 42.761 37.641 33.593 30.139 20 25 30 35 40 45 50 55 60 R-Va lu e (f t 2hr oF/ BT U )
Figure 15. Comparisons between R-values for case I, when VIP#2 is failed, and all VIPs
were replaced by XPS (see Figure 11) of C-O VIP wall specimen (W2)
Figure 16. Comparison between predicted and measured heat fluxes at XPS-OSB interface
for XPS retrofit wall specimen (W1)
-10 -8 -6 -4 -2 0 2 4 6 8 10 12 0 30 60 90 120 150 180 210 240 270 300 330 360 Predicted Measured
Time = 0 corresponding to May 15, 2011 12:01:22 AM
Hourly heat flux at XPS-OSB (tyvek) interface (HFT2)
Time (day) H ea tF lu x (W /m 2 )
Figure 17. Predicted heat flux at the indoor surface for XPS retrofit wall specimen (W1)
Figure 18. Predicted heat flux at the indoor surface for T&G retrofit wall specimen (W3) -10 -8 -6 -4 -2 0 2 4 0 30 60 90 120 150 180 210 240 270 300 330 360
Require Cooling Load
Require Heating Load
Time = 0 corresponding to May 15, 2011 12:01:22 AM
Time (day) P re di ct ed H ea tF lu x at In d oo r S ur fa ce (W /m 2 ) -8 -6 -4 -2 0 2 4 0 30 60 90 120 150 180 210 240 270 300 330 360
Time = 0 corresponding to May 15, 2011 12:01:22 AM
Require Heating Load Require Cooling Load
Time (day) P re di ct ed H ea tF lu x at In do or S ur fa ce (W /m 2 )
Figure 19. Predicted heat flux at indoor surface for C-O retrofit wall specimen (W2)
Figure 20. Comparisons of yearly cumulative heating and cooling loads of different wall
specimens -8 -6 -4 -2 0 2 4 0 30 60 90 120 150 180 210 240 270 300 330 360
Require Cooling Load
Require Heating Load
Time = 0 corresponding to May 15, 2011 12:01:22 AM
Time (day) P re di ct ed H ea tF lu x at In d oo r S ur fa ce (W /m 2 ) 0 100 200 300 400 500 600 700 800
Wall with T&G VIP Wall with C-O VIP Reference Wall
Ye ar ly H ea tin g an d Co ol in g Lo ad s (w -d ay /m 2) Cooling Load Heating Load
Figure 21. Comparisons of yearly cumulative heating load of different wall specimens
Wall with T&G VIP Wall with C-O VIP Reference Wall
Series1 438 416 744 0 100 200 300 400 500 600 700 800 Ye ar ly H ea tin g Lo ad (w -d ay /m 2)