Publisher’s version / Version de l'éditeur:
Journal of Hydrology, 396, 1-2, pp. 94-103, 2011-01-01
READ THESE TERMS AND CONDITIONS CAREFULLY BEFORE USING THIS WEBSITE. https://nrc-publications.canada.ca/eng/copyright
Vous avez des questions? Nous pouvons vous aider. Pour communiquer directement avec un auteur, consultez la
première page de la revue dans laquelle son article a été publié afin de trouver ses coordonnées. Si vous n’arrivez pas à les repérer, communiquez avec nous à PublicationsArchive-ArchivesPublications@nrc-cnrc.gc.ca.
Questions? Contact the NRC Publications Archive team at
PublicationsArchive-ArchivesPublications@nrc-cnrc.gc.ca. If you wish to email the authors directly, please see the first page of the publication for their contact information.
NRC Publications Archive
Archives des publications du CNRC
This publication could be one of several versions: author’s original, accepted manuscript or the publisher’s version. / La version de cette publication peut être l’une des suivantes : la version prépublication de l’auteur, la version acceptée du manuscrit ou la version de l’éditeur.
For the publisher’s version, please access the DOI link below./ Pour consulter la version de l’éditeur, utilisez le lien DOI ci-dessous.
https://doi.org/10.1016/j.jhydrol.2010.10.037
Access and use of this website and the material on it are subject to the Terms and Conditions set forth at
Uncertainty assessment of climate change impacts on the hydrology of small prairie wetlands
Zhang, H.; Huang, G. H.; Wang, D. L.; Zhang, X.
https://publications-cnrc.canada.ca/fra/droits
L’accès à ce site Web et l’utilisation de son contenu sont assujettis aux conditions présentées dans le site LISEZ CES CONDITIONS ATTENTIVEMENT AVANT D’UTILISER CE SITE WEB.
NRC Publications Record / Notice d'Archives des publications de CNRC:
https://nrc-publications.canada.ca/eng/view/object/?id=9be62135-4f09-417e-9b30-ad7aa3d14a13 https://publications-cnrc.canada.ca/fra/voir/objet/?id=9be62135-4f09-417e-9b30-ad7aa3d14a13
U nc e rt a int y a sse ssm e nt of c lim a t e c ha nge im pa c t s on t he hydrology of sm a ll pra irie w e t la nds
N R C C - 5 4 5 0 4
Z h a n g , H . ; H u a n g , G . H . ; W a n g , D . L . ; Z h a n g , X .
A u g u s t 2 0 1 1
A version of this document is published in / Une version de ce document se trouve dans: Journal of Hydrology, 396, (1-2), pp. 94-103, January, 1, 2011, DOI:
10.1016/j.jhydrol.2010.10.037
http://www.nrc-cnrc.gc.ca/irc
The material in this document is covered by the provisions of the Copyright Act, by Canadian laws, policies, regulations and international agreements. Such provisions serve to identify the information source and, in specific instances, to prohibit reproduction of materials without written permission. For more information visit http://laws.justice.gc.ca/en/showtdm/cs/C-42
Les renseignements dans ce document sont protégés par la Loi sur le droit d'auteur, par les lois, les politiques et les règlements du Canada et des accords internationaux. Ces dispositions permettent d'identifier la source de l'information et, dans certains cas, d'interdire la copie de documents sans permission écrite. Pour obtenir de plus amples renseignements : http://lois.justice.gc.ca/fr/showtdm/cs/C-42
Uncertainty Assessment of Climate Change Impacts on the Hydrology
of Small Prairie Wetlands
Hua Zhang a, and Guo H. Huang a,*, Dunling Wang b and Xiaodong Zhang a
a
Faculty of Engineering and Applied Science, University of Regina, Regina, SK S4S 0A2, Canada
b
Centre for Sustainable Infrastructure Research, Institute for Research in Construction, National Research Council, Regina, SK S4S 7J7, Canada
* Corresponding author. Tel: +1 (306) 585-4095. Fax: +1 (306) 585-4855. E-mail address: huang@iseis.org. Postal address: Faculty of Engineering and Applied Science, University of Regina, Regina, SK S4S 0A2, Canada.
Abstract
With increasing evidences of climate change in the prairie region, there is an urgent need to understand the future climate and the responses of small prairie wetlands. This study integrated two regional climate models (RCMs), two weather generators and a distributed hydrological model to examine uncertainties in hydrological responses to climate change in the Assiniboia watershed, Canada. Compared to baseline conditions (1971 - 2000), the annual water yield and evapotranspiration in the period of 2041 - 2070 were forecasted to be generally unchanged, while the annual reservoir storage was projected to be generally reduced. However, projected hydrological regimes were less consistent at a monthly level, particularly for March and July. Such uncertainties in simulated hydrological responses were derived from the implementations of different integrated downscaling methods, reflecting our imperfect knowledge of future climate. We identified a warming temperature trend from climatic projections, but had less confidence in the future pattern of precipitation. Uncertainties in integrated downscaling were primarily derived from the choice of RCM, and were amplified through the incorporation of different weather generators. Results of any climate change study based on only one RCM and one weather generator should be interpreted with caution, and the ensemble framework should be advised to generate a comprehensive vision of the future climate. This study demonstrated that the incorporation of precipitation occurrence change contributed to a full translation of RCM outputs, but introduced additional uncertainty. A balance is thus desired between the information loss and the additional uncertainty in order to effectively utilize RCM outputs.
Key words: Climate change; Prairie hydrology; Downscaling; Wetlands; Weather generator; Uncertainty.
1. Introduction
The semi-arid northern plains of North America are studded with millions of small depressions that are frequently occupied by ponds or lakes (Woo and Rowsell, 1993). These small wetlands play an important role in the prairie hydrology and are increasingly crucial to many economical and ecological services (Price et al., 2005; Su et al., 2000; Voldseth et al., 2007). Most prairie wetlands are located in closed catchments with largely internal drainage, and natural outflows are rare under normal weather conditions (Fang and Pomeroy, 2008; Hayashi et al., 1998). With a low permeable glacial till substrate, groundwater flow is generally slow and presents a minor component of the water balance (van der Kamp et al., 2003). Short-duration events such as snowmelt in spring and storms in summer are critical to the existence and function of these wetlands. Owing to the unstable and dry prairie climate, where potential evaporation greatly exceeds precipitation, small prairie wetlands are highly sensitive to changes in temperature and precipitation that affect runoff and atmospheric energy fluxes (Conly and Van der Kamp, 2001; Voldseth et al., 2009). With increasing evidences of climate change in the prairie region, there is an urgent need to comprehensively explore the future climate changes and the responses of small prairie watersheds to these changes (Huang et al., 1998; Huang et al., 2005; Qin et al., 2008).
Global Climate Models (GCMs) are the primary tool in the assessment of climate change. However, GCM-predicted runoff is often over-simplified, and hydrological models driven directly by GCM outputs have poor performance (Fowler et al., 2007). There is a
clear mismatch between the coarse resolution of GCMs and the scale of local hydrological processes. Different downscaling approaches have been applied to bridge this gap, varying from simple techniques that constantly modify the time series of meteorological variables (Ficklin et al., 2009; Somura et al., 2009) to complex statistical or dynamical methods (Franczyk and Chang, 2009; Marshall and Randhir, 2008; Stone et al., 2001; Toews and Allen, 2009). Among these, dynamical downscaling or regional climate model (RCM) is of increasing attention because it can simulate regional climatic features through parameterized physical atmospheric processes. Nevertheless, the spatial resolution of RCMs still exceeds the scales of small prairie watersheds. A viable solution is to apply statistical downscaling approaches to RCM outputs (Fowler et al., 2007; Wilby et al., 2000). For example, Diez et al. (2005) used a two-step standard analogue technique to improve the performance of the Rossby Centre Climate Atmospheric model for downscaling seasonal precipitation over Spain. Hellstrom and Chen (2003) downscaled the RCM projection of precipitation in Sweden with a multiple regression model. Wood et al. (2004) applied three statistical methods to RCM outputs for producing inputs required by hydrological modeling. Such integrated downscaling methods were able to improve RCM projections through incorporating the present climate normals that were often available with high spatial resolution.
However, few investigations have effectively examined the uncertainties in integrated downscaling and related impact modeling. Firstly, while the comparisons are common among RCMs or among statistical downscaling methods, few attempts have been conducted to explore differences among integrated downscaling methods. Uncertainties
are derived from not only the structure of RCMs but also the formulations of statistical downscaling tools. The combined effects of these uncertainties on impact models have not been clearly understood. Secondly, precipitation amount is commonly downscaled in impact studies, but precipitation occurrence is rarely considered. Changing length of wet spells may have important effects on moisture balance and runoff generation, especially for semi-arid regions where potential evaporation often exceeds precipitation. Exclusion of precipitation occurrence change may lead to an impaired interpretation of RCM outputs, but incorporating this information may also introduce additional uncertainty. Thirdly, the impacts of the above uncertainties are seldom examined together with hydrological modeling. Different hydrological systems possess different degrees of sensitivity to climate change; within one system, the responses are also different among hydrological components. Uncertainties in climate change projections will impose complicated influences on the studied hydrological system. It is desired that these influences be explored through a hydrological model that can effectively utilize the downscaling outputs and simulate the watershed behaviour at a fine scale.
Small prairie watersheds provide favourable sites for exploring these knowledge gaps in downscaling-based impact studies. Each watershed constitutes an independent hydrological system where it is relatively simple to characterize drainage features and differentiate climate change from other driving forces on the hydrological system. Therefore, this study aims to explore the uncertainties of climate change impacts on the hydrology of a small prairie watershed through: (1) developing downscaled climate scenarios by integrating different RCMs and stochastic weather generators with a specific
consideration on precipitation occurrence and (2) conducting distributed hydrological modeling driven by downscaled climate scenarios to examine key hydrological processes.
2. The study system
2.1 Study area
The Assiniboia watershed is located in southern-central Saskatchewan, Canada (Figure 1). It is a typical small watershed in the prairie pothole region. It has a gross drainage area of 49.6 km2, and elevation ranges from 677 m to 771 m with an average slope of 3%. The majority of land is developed for agriculture. Soil is dominated by Brown Chernozemic soils formed in a mixture of variable, clayey lacustrine materials and clay loam glacial till. Because the Rocky Mountains block moisture-bearing winds from the Pacific, a pronounced semi-arid climate prevails, featured by long and cold winter, short and warm summer, and strong winds. Annual mean temperature is 3.9 ºC, and monthly mean temperatures are -13.1 ºC in January and 18.6 ºC in July, respectively. Annual precipitation is 393.4 mm with 25% falling as snow, while annual potential evapotranspiration is 1135.5 mm. The period of May-July accounts for 48% of the annual rainfall, and summer storms are often severe. Snow accumulation on the ground generally starts in November, and the melt of snowpack occurs from March to April. Runoff is over 80% derived from snowmelt and shows great interannual variations.
The Assiniboia watershed is a non-contribution drainage area although it is classified as a part of the Missouri River basin. To adapt the persistent prairie droughts, two reservoirs were consecutively built based on natural wetlands. At the water level of its emergency spillway, the Old Willows Reservoir has a storage capacity of 0.86 million m3 with a surface area of 21.5 ha, and the downstream Willows Reservoir has a storage capacity of 6.75 million m3 with a surface area of 43.2 ha. The Old Willows Reservoir receives water yield from 82% of the watershed area and releases water into the Willows Reservoir during the spring runoff peak period. The Willows Reservoir has rarely reached its full capacity (even in spring) and has negligible outflow to the downstream area in a normal year. Therefore, the Assiniboia watershed generally behaves as an isolated hydrological region in the Canadian Prairies.
&&&&&&&&&&&&&&&& Place Figure 1 here.
&&&&&&&&&&&&&&&&
2.2 Geographic and hydro-climatic data
Soil data was digitized from 1:100,000 soil map of Rural Municipality No. 72. Data on land use was derived from the vector map of GeoBase and was updated based on survey records of the local agricultural agency. A National 1:50,000 digital elevation model was used to determine surface slope; it was improved through a hydrological correction method (Zhang and Huang, 2009) for establishing a reasonable drainage structure.
Weather data from the Assiniboia Airport station was provided by Meteorological Service of Canada. It consisted of daily series of minimum and maximum temperatures, precipitation, humidity, and wind speed for the period of 1973-2009. Solar radiation was estimated based on the empirical equations recommended by FAO (1998). Daily inflow of the Old Willows Reservoir (1976-2003) was provided by the Prairie Farm Rehabilitation Administration (PFRA) of Agriculture and Agri-Food Canada; and the weekly water level of the Willows Reservoir (1978-2008) was obtained from the Town of Assiniboia.
2.3 Data of regional climate models
Two RCMs were employed in this study. PRECIS (Providing Regional Climates for Impacts Studies) is a regional climate modeling system developed by the Hadley Centre of UK (Jones et al., 2004). It allows the HadRM3P model to be run on a personal computer and has been applied in many countries (Akhtar et al., 2009; Marengo et al., 2009; Yang et al., 2010). Canadian Regional Climate Model (CRCM) is developed and operated by a consortium of Canadian institutions (Caya and Laprise, 1999). It can be set up to run on a domain covering any part of the globe, but its experiments have focused on North America (de Elia et al., 2008; Mailhot et al., 2007; Music and Caya, 2007). To our present knowledge, PRECIS and CRCM are the only two RCMs that have been applied to a Canadian domain. However, considerable disagreements existed between their projections for both present and future climates of Canada, which introduced large uncertainties in assessing climate change impacts; for example, see reports of two
projects implemented for Ontario recently (Bourdages and Huard, 2010; CSEE, 2010).
Simulation results of PRECIS and CRCM were obtained from the North American Regional Climate Change Assessment Program (NARCCAP) (Mearns et al., 2009). The RCMs were nested within GCMs for the baseline period (1971-2000) and the future period (2041-2070). The PRECIS run was driven by HADCM3, while the CRCM run was driven by CGCM3. The area of integration covered the conterminous United States and most of Canada, and has a spatial resolution of 50 km. The GCMs had been forced with the SRES A2 emissions scenario for the 21st century. The A2 emission scenario was selected due to its position at the higher end of the SRES emissions scenarios which can facilitate the impacts and adaptation studies. The story line of the A2 emission is characterized by heterogeneity. Self reliance and local identities are emphasized, population increases continuously, economic development is regionally oriented, and economic and technological improvements are relatively slow compared to the other story lines (Nakicenovic et al., 2000). More details about these GCM-RCM combinations can be obtained at the website of NARCCAP (http://www.narccap.ucar.edu/about/index.html).
3. Methodology
To ensure that the predictive elements from RCMs are realistic for a small watershed, statistical downscaling methods such as stochastic weather generator (SWG) are required to link the regional- and local-scale processes. SWG first predicts the occurrence and amount of daily precipitation. Estimations of other climatic variables are generated depending on the wet or dry status of the day. SWG is efficient in reproducing the local climate with similar climate normals to that of the long-time observation. Because SWG does not rely on a correlation between predictants and predictors, the information on climate change from RCM simulations can be incorporated in a flexible manner.
Two SWGs are employed in this study. WXGEN (Williams, 1995) uses a first-order Markov chain model to define the day as dry or wet. The daily precipitation amount is estimated based on a skewed or exponential distribution. Daily maximum and minimum temperatures are then generated based on the weekly stationary generating process. LARS-WG (Semenov and Barrow, 1997) is based on the series approach, aiming to overcome the limitations of the Markov chain model in simulating the maximum dry spell. The precipitation occurrence is modelled as alternate wet and dry series. Length of each series and precipitation amount are chosen randomly from monthly semi-empirical distributions. Daily minimum and maximum temperatures are generated through stochastic processes with daily means and standard deviations (SD) conditioned on the precipitation status of that day.
Future climate is projected through SWG by adjusting the baseline normals with monthly shift terms, which are absolute or relative changes between two simulated climate states.
Shift terms of temperature include means and standard deviations of daily maximum and minimum temperatures for each month. For shift terms of precipitation amount, both SWGs use the monthly total precipitation, while LARS-WG also uses the standard deviation and skew coefficient of daily precipitation for each month. For shift terms of precipitation occurrence, WXGEN incorporates the probabilities of a wet day following a dry day (Pw/d) or a wet day (Pw/w), and the average number of days of precipitation; while
LARS-WG uses the relative changes in the lengths of wet and dry spells.
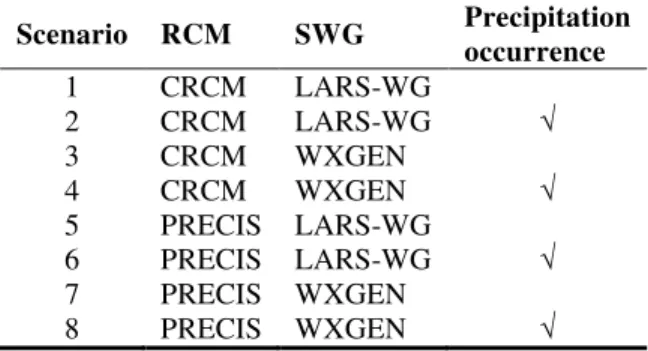
In this study, uncertainties in the downscaling process are mainly derived from three sources: 1) the differences between RCMs, 2) the differences between SWGs, and 3) the differences for whether precipitation occurrence changes are incorporated. Eight scenarios of future climate are designed, e.g., the combinations among two RCMs, two weather generators, and two types of shift terms (Table 1). The shifts terms are calculated from the RCMs outputs for the periods of 1971-2000 and 2041-2070. The precipitation threshold of a wet day is defined as 0.01 mm that is consistent with the data quality of station observation. In each scenario, the weather generator is driven by different random seeds to generate 20 synthetic weather series; each weather series consists of 30-year daily series of minimum temperature, maximum temperature and precipitation, and is fed into the hydrological model independently.
&&&&&&&&&&&&&&&& Place Table 1 here.
3.2 Hydrological modeling
The SWAT model (Arnold et al., 1998) is used in this study to examine hydrological processes driven by synthetic weather. It is a continuous, spatially-distributed simulator of hydrological system at the watershed scale. The watershed is divided into hydrological response units (HRU) defined by unique combinations of soil, land use and slope. Surface runoff is generated using a modified curve number (CN) method. HRU outflows are summed within subwatersheds and then routed through the channel network to the watershed outlet. A reservoir is considered as an impoundment located at the main channel. Reservoir water balance takes into consideration the inflow, outflow, precipitation and evaporation at the surface area, and bottom seepage. For an uncontrolled reservoir, water is released whenever the reservoir volume is greater than the principal spillway volume.
The calibration of SWAT is achieved through a two-step composite scheme. Before the calibration, sensitivity analysis is conducted to reduce the number of parameters involved in calibration. In the first step, parameters related to the snowmelt process are calibrated based on observations of early spring only. In the second step, other parameters are added into the pool to fit a rainfall-runoff process in the whole hydrological year. In both steps, manual calibration is first undertaken to obtain initial ranges of parameter values, followed by automatic calibration for locating the best solution.
Three goodness-of-fit measures are used for evaluating the simulation performance of SWAT. The Nash-Sutcliffe efficiency (NS) is a normalized statistic that determines the relative magnitude of the residual variance compared to the measured data variance (Nash and Sutcliffe, 1970):
2 2 ( ) 1 ( ) Q Q NS Q Q ∧ − − = − −
∑
∑
(1) where Q ∧is the simulated flow, and Q
−
is the average of observed flow Q . NSE takes values between -∞ and 1, with NS = 1 indicating a perfect fit. NS has been widely used, which facilitates the comparison among studies. For the same reason, the Pearson’s correlation coefficient (R) is also calculated. R ranges between 0 and 1, with r = 1 indicating a perfect agreement. The Percent Bias (PBIAS) is used to measure the average tendency of the simulated data to be larger or smaller than their observed counterparts:
(Q Q) *100 PBIAS Q ∧ − =
∑
∑
(2)The optimal value of PBIAS is zero, with positive (negative) values indicating model underestimation (overestimation) bias.
4. Results
4.1 Calibration and validation of hydrological model
was close to the low end of the calibration range, revealing that the snowpack temperature was relatively stable against the influence of the current day temperature. SWAT performance was also sensitive to two snowmelt parameters, SMFMX and SMFMN. Their diverse calibrated values suggested strong seasonal variations. Particularly, the large value of SMFMX was expected because snowmelt in the Canadian Prairies could occur as late as in April. Calibrated SMTMP was slightly above 0 ºC, favoring a late start of the melting process. During the second calibration step, sensitive parameters included CN2, SOL_AWC, SOL_K and SURLAG. Compared with their initial values for major land uses, CN generally decreased, while SOL_AWC and SOL_K generally increased, facilitating reduced surface runoff and enhanced soil storage. The calibrated SURLAG was close to the upper bound, indicating a very low capacity of surface storage.
Figure 2 compares observed and simulated mean monthly inflows of the Old Willows Reservoir. The calibration period (1978-1992) and validation period (1997-2003) were designed to cover a wide spectrum of prairie hydrological conditions including two multi-year droughts (e.g., 1980-1989 and 1999-2002). In the calibration period, SWAT showed good performance in the snowmelt season, but yielded underestimations in the dry season, with NS = 0.73, R = 0.76 and PBIAS = 10.2. In the validation period, SWAT demonstrated accepted predictability, with NS = 0.60, R = 0.72 and PBIAS = 16.8. According to the general ratings recommended by Moriasi et al. (2007) for hydrological simulations, the performance of SWAT at the Assiniboia watershed was good or satisfactory.
&&&&&&&&&&&&&&&& Place Table 2 & Figure 2 here. &&&&&&&&&&&&&&&&
4.2 Projections of climate change
The simulation results of CRCM and PRECIS are presented in Figure 3. Both RCMs were able to reproduce seasonal variations of temperature for the baseline period. However, CRCM tended to underestimate temperatures with the maximum deviation for February (4.2 ºC), while PRECIS yielded overestimation bias particularly in winter (6.9 ºC) and late-summer (3.7 ºC). In terms of precipitation, CRCM reproduced seasonal patterns with moderate overestimation bias for summer rainfall (0.38 mm/day higher). In the PREIS projection, the temporal pattern of precipitation was one month earlier than observation, and the annual precipitation was overestimated by 14%. For the future period, both RCMs predicted warmer weather, with high increments in winter and late-summer and intensified monthly variation in spring and late-summer. As a comparison, the precipitation projections showed significant discrepancies. CRCM estimated a wetter climate, with increased precipitation by 26% in winter and by 10% in summer. PRECIS predicted increased winter precipitation and greatly reduced summer rainfall (by 30%), while annual precipitation was close to the baseline condition. In terms of precipitation occurrence, both RCMs predicted longer wet spells for winter and less frequent rainfall in late-summer, but showed disagreement for the period of April through June. Based on the
performance of RCM for the baseline period, however, it was doubtful whether their projections on the future period can be directly utilized in regional impact studies, especially for hydrological issues at small scale.
&&&&&&&&&&& Place Figure 3 here. &&&&&&&&&&&
The bias of RCM projections can be largely avoided through using monthly shifts based on the differences between two simulated climate states. The applied monthly shifts are presented in Tables 3 and 4, and temperature and precipitation downscaled by SWGs are shown in Figure 4. Both SWGs had similar results in temperature downscaling, but LARS-WG generated more precipitation than WXGEN did (except for May). This difference was amplified when precipitation occurrence changes were incorporated. Changes in Pw/d and Pw/w had only slight effects on WXGEN results, but LARS-WG was
sensitive to any altered length of wet and dry spells. This was particularly evident for the greatly reduced July precipitation (by 30%) in the PRECIS projection. WXGEN reproduced this change exactly when only precipitation amount shifts were used, and slightly overestimated it (32%) when precipitation occurrence shifts were included. As a comparison, LARS-WG generated a 22% decrease using amount shifts only, and 16% when occurrence shifts were incorporated. A similar disagreement was also identified for March. July and March are crucial periods of prairie hydrology, because July has over 23% of the annual precipitation and March is the major snowmelt period. Such diverse
translations of RCM-derived climate change information introduce considerable uncertainties into studies concerning impacts on water resources planning and management.
&&&&&&&&&&&&&&&&&&&&&& Place Figure 4, Table 3 and Table 4 here. &&&&&&&&&&&&&&&&&&&&&&
4.3 Hydrological responses to climate change
4.3.1 Water yield
Water yield is the total amount of water that reaches the channel system of the watershed, consisting of surface runoff and lateral flow. It significantly relates to the availability of surface water. Increased or intensified precipitation facilitates the increasing of water yield. Warm weather temperature in winter and spring months also speeds the snowmelt process that strongly contributes to the water yield. Overall, the Assiniboia watershed was projected to experience slightly decreased annual water yield in 2050s. The absolute changes of monthly water yield in different scenarios are presented in Figure 5. In the CRCM scenarios, water yield increases up to 5 mm in February, but largely decreases in March due to diminished snowmelt runoff. LARS-WG favours higher water yield and is more sensitive to the changed precipitation occurrence that can further enhance the water yield. In July, for example, LARS-WG results in increased water yield when precipitation
occurrence shifts -are used. In PRECIS scenarios, large uncertainty lay in March. While WXGEN results in reduced water yield, LARS-WG yields an opposite situation. This disagreement is mainly due to the fact that LARS-WG generates 17% more precipitation in March than WXGEN did (Figure 4b). Another reason can be that LARS-WG favoured the snow accumulation before March. Although both weather generators estimated a warmer and wetter winter compared to the baseline, the maximum daily temperature generated by LARS-WG has less variations, suggesting less rainfall and snowmelt in the mid-winter; as a result, there was enhanced snowpack available for snowmelt in March.
&&&&&&&&&&&&&&&& Place Figure 5 here.
&&&&&&&&&&&&&&&&
4.3.2 Evapotranspiration
The mean annual evapotranspiration (ET) was projected to be slightly increased in the 2050s. The absolute changes of monthly ET are presented in Figure 6. Comparing with the baseline condition, Assiniboia experienced decreased ET during April through July, and the same or slightly increased ET for other months. This temporal pattern of ET changes was consistent with that of precipitation changes (Figure 4). LARS-WG generally resulted in larger ET changes than WXGEN did, except for December and January. When precipitation occurrence shifts were incorporated, ET further increased through LARS-WG, but remained the same magnitude through WXGEN. For example,
in the CRCM scenarios, the intensified rainfall caused the monthly ET to increase 4.3 mm, 8.0 mm and 8.1 mm for May, June and July, respectively through LARS-WG. Figures 4 to 6 also suggest that the sensitivity of LARS-WG to precipitation occurrence changes had consistent effects on simulated runoff and soil moisture at the watershed level.
&&&&&&&&&&&&&&&& Place Figure 6 here.
&&&&&&&&&&&&&&&&
4.3.3 Reservoir storage
The relative changes of monthly reservoir storage are plotted in Figure 7. Overall, storage decreases in both reservoirs through the year, especially in spring and summer. The Old Willows Reservoir is more sensitive to climate change impact. Its storage variation generally matches the fluctuation of water yield (Figure 5), suggesting a negligible transmission loss through the channel system. Storage changes of the Willows Reservoir are less significant due to the regulation of its upstream counterpart. Different downscaling approaches results in diverse projections, particularly for the Old Willows Reservoir. In terms of RCM, the magnitude of storage changes was continually decreasing from spring (18%) to fall (4%) in the CRCM scenarios, but such a seasonal pattern was not clear in the PRECIS scenarios. In terms of SWG, LARS-WG generally led to more reservoir storage than WXGEN did. The uncertainties in the results lay
particularly in two sensitive periods. For July-August in the CRCM scenarios, LARS-WG generated positive changes (as high as 8%), while WXGEN had negative estimations (as much as -7%). For March in the PRECIS scenarios, the storage increased by up to 10% through LARS-WG and decreased by up to 11% through WXGEN. When precipitation occurrence shifts were included, intensified precipitation caused enhanced reservoir storage through LARS-WG, but had insignificant effects through WXGEN.
The two reservoirs are at the core of water resource management in the Assiniboia watershed. The impacts of climate change on reservoir performance are important community economy and health issues. The simulated reservoir storage changes have significant implications on community water supply. For example, the estimated storage change for July ranged from -9% to 8%, indicating a possible water level change of over one meter. As the reservoir storage reaches its lowest level in summer, such uncertain predictions can cause difficulties in making decisions such as whether the inlet of the water treatment plant should be relocated.
&&&&&&&&&&&&&&&& Place Figure 7 here.
&&&&&&&&&&&&&&&&
In climate change impact studies, it was common to change the mean and variance of precipitation amount based on the monthly shifts predicted by GCMs/RCMs, but the structure of precipitation occurrence was unchanged. An important reason for the exclusion of precipitation occurrence was that daily-scale GCMs/RCMs data was not available or not reliable enough (Toews and Allen, 2009). Such exclusion was assumed to be acceptable for cold regions where the most important hydrological features were linked to snow accumulation and snowmelt (Minville et al., 2008). However, the results of this study demonstrated that the effects of changed precipitation occurrence were complicated and important to climate downscaling and hydrological modeling in the Canadian Prairies. We found that using precipitation occurrence shifts in SWGs not only changed spell length and transition probability, but also led to additional changes in monthly mean precipitation and mean temperature; this was consistent with the findings by Katz (1996). These effects were then translated into great variations in hydrological processes (e.g., further augmented ET in summer as shown in Figure 6b). The profound influences of precipitation occurrence on climatic and hydrological variables were mainly due to its unique role in the stochastic weather generation process. Monthly precipitation amount was associated with precipitation occurrence through the number of wet days. In LARS-WG, daily temperatures were considered as stochastic processes with their means and standard deviations conditioned on the wet or dry status of the day through separated Fourier series; in WXGEN, the daily maximum temperature values were conditioned to the precipitation status by separated cosine functions (Semenov et al., 1998). The change in precipitation occurrence thus brought unanticipated disturbance into the downscaling that was additional to the pre-defined monthly shifts, and resulted in more uncertainties in
hydrological modeling driven by downscaled climate. On the other hand, the information on precipitation occurrence was indeed a valuable component of the RCM outputs, because it could improve our understanding on the effects of regional-scale forcings (such as torography and land cover) on precipitation formation and distribution. Therefore, A balance is desired between the information loss and the additional uncertainty for effectively utilizing the changes in precipitation projected by RCMs.
There were several limitations of the integrated downscaling approaches presented in this study. Firstly, there was a loss of trend information that was possibly contained in the raw RCM outputs. Because RCM simulations were continuous processes, climatic variability for one year was not only driven by the boundary conditions given by the GCM on that year, but also conditioned to variations of previous time steps. The tendency hidden in the interannual variability of climatic variables, if there was any, could not be fully reflected through monthly shifts that were only the averaged differences between simulation results of two 30-yr time slices. Furthermore, SWG treated each year as an independent period. All of the years were equally plausible “realisations” of the same climate normal, but their sequences did not form a reasonable time series. However, this limitation was of minor importance to the present study, because the performance of current RCMs on time series simulation was not effectively validated yet and the estimation of multi-year averages would be more meaningful than the forecast of a single year for most impact studies. Another limitation of this study was the use of only one emission scenario. The A2 emission scenario used in this study was one of the scenarios recommended by IPCC for inter-comparison studies. IPCC provided 40 scenarios under four large families, but
RCM outputs were only available for a few of them through several continent-scale inter-comparison projects such as the ENSEMNBLES Project, the PRUDENCE Project in Europe and the NARCCAP Project in North America (Christensen et al., 2008; Fischer and Schar, 2010; Fowler et al., 2007). This was mainly due to the lack of boundary data from GCMs and the extensive computation cost of RCM runs. In terms of methodology, the present integrated downscaling approach should have no difficulties in incorporating more emission scenarios in future studies.
6. Conclusions
This study used multiple integrated downscaling methods coupled with distributed hydrological modeling to examine the hydrological responses of small prairie wetlands to climate change. Compared to baseline conditions, annual water yield and ET predicted for the 2050s were largely unchanged, while annual reservoir storage was generally reduced. However, projected hydrological regimes were less consistent at a monthly level, particularly for March and July. These uncertainties in the simulated hydrological responses were obtained from the implementation of different integrated downscaling methods, reflecting our imperfect knowledge of the future climate. Overall, we were able to identify a warming temperature trend from climatic projections, but had less confidence in the future pattern of precipitation at both the monthly and daily scales. Uncertainties in integrated downscaling were primarily obtained from the choice of RCM, and were then amplified through the incorporation of different weather generators. Each combination of RCM and weather generator constituted a plausible solution of projecting
future climate at the regional scale, but none of them was superior to the others. Therefore, results of any impact study based on only one RCM and one weather generator should be interpreted with caution, and the multi-model framework should be used for generating a comprehensive vision of future climate. Furthermore, this study demonstrated that the incorporation of precipitation occurrence change contributed to a full translation of RCM outputs, but at the same time introduced additional uncertainty. A balance is therefore desired between the information loss and the additional uncertainty in order to effectively utilize RCM outputs for regional impact studies.
This study provided insights into the challenges that climate change could impose on water resources management in terms of extreme hydro-climatic events. On one hand, the findings of this study can benefit the assessment of long-term events such as drought. Most existing drought indexes use monthly precipitation and temperature as basic inputs, and some indexes may employ a simple accounting of hydrological balance. The projected variations in climatic and hydrological variables from this study are directly useful for exploring the characteristics of prairie hydrological and meteorological droughts in the 2050s. On the other hand, this study can also facilitate the assessment of short-term events such as storms and floods. Most existing impact studies tend to focus on the change in precipitation amounts only; for example, see Toews and Allen (2009). We found that projections on future precipitation occurrence were uncertain and had considerable impacts on hydrological modeling. Information of precipitation time series allows strong links between the climatic models and the hydrological models that often operate at daily or finer steps, which is important to characterize storm and flood in
prairie summers. Although this study was implemented in a small prairie watershed in southern Saskatchewan, the conclusions are generally applicable to other prairie regions because the methodology of integrated downscaling is not area-specific. To extrapolate this study to a broader geographic context, considerations of spatial patterns of climatic elements (e.g., precipitation gradient) and human interventions (e.g., water diversion for irrigation) will be needed to better explain the uncertainties in hydrological signals.
Acknowledgement
We wish to convey special thanks to Rod Sexsmith and Blaine Crowley from the Town of Assiniboia, Mervin Guillemin from the Rural Municipality No.72, and Jim Yarotski from Agriculture and Agri-Food Canada for providing data and expertise. We are grateful to the North American Regional Climate Change Assessment Program (NARCCAP) for providing the RCM data used in this paper. NARCCAP is funded by the National Science Foundation (NSF), the US Department of Energy (DoE), the National Oceanic and Atmospheric Administration (NOAA), and the US Environmental Protection Agency Office of Research and Development (EPA). This research was supported by the Canadian Water Network under the Networks of Centers of Excellence (NCE), and the Natural Science and Engineering Research Council of Canada.
References 1
2
Akhtar, M., Ahmad, N. and Booij, M.J., 2009. Use of regional climate model simulations 3
as input for hydrological models for the Hindukush-Karakorum-Himalaya region. 4
Hydrology and Earth System Sciences, 13(7): 1075-1089. 5
Allen, R.G., Pereira, L.S., Raes, D. and Smith, M., 1998. Crop evapotranspiration - 6
Guidelines for computing crop water requirements Rome. 7
Arnold, J.G., Srinivasan, R., Muttiah, R.S. and Williams, J.R., 1998. Large area 8
hydrologic modeling and assessment - Part 1: Model development. Journal of the 9
American Water Resources Association, 34(1): 73-89. 10
Bourdages, L. and Huard, D., 2010. Climate Change Scenario over Ontario Based on the 11
Canadian Regional Climate Model (CRCM4.2), Ouranos, Montreal, Quebec, 12
Canada. 13
Caya, D. and Laprise, R., 1999. A semi-implicit semi-Lagrangian regional climate model: 14
The Canadian RCM. Monthly Weather Review, 127(3): 341-362. 15
Christensen, J.H., Boberg, F., Christensen, O.B. and Lucas-Picher, P., 2008. On the need 16
for bias correction of regional climate change projections of temperature and 17
precipitation. Geophysical Research Letters, 35(20). 18
Conly, F.M. and Van der Kamp, G., 2001. Monitoring the hydrology of Canadian prairie 19
wetlands to detect the effects of climate change and land use changes. 20
Environmental Monitoring and Assessment, 67(1-2): 195-215. 21
CSEE, 2010. Regional Climate Modelling over Ontario Using UK PRECIS, University of 22
Regina, Regina, Saskatchewan, Canada. 23
de Elia, R. et al., 2008. Evaluation of uncertainties in the CRCM-simulated North 24
American climate. Climate Dynamics, 30(2-3): 113-132. 25
Diez, E., Primo, C., Garcia-Moya, J.A., Gutierrez, J.M. and Orfila, B., 2005. Statistical 26
and dynamical downscaling of precipitation over Spain from DEMETER seasonal 27
forecasts. Tellus Series a-Dynamic Meteorology and Oceanography, 57(3): 409-28
423. 29
Fang, X. and Pomeroy, J.W., 2008. Drought impacts on Canadian prairie wetland snow 30
hydrology. Hydrological Processes, 22(15): 2858-2873. 31
Ficklin, D.L., Luo, Y.Z., Luedeling, E. and Zhang, M.H., 2009. Climate change 32
sensitivity assessment of a highly agricultural watershed using SWAT. Journal of 33
Hydrology, 374(1-2): 16-29. 34
Fischer, E.M. and Schar, C., 2010. Consistent geographical patterns of changes in high-35
impact European heatwaves. Nature Geoscience, 3(6): 398-403. 36
Fowler, H.J., Blenkinsop, S. and Tebaldi, C., 2007. Linking climate change modelling to 37
impacts studies: recent advances in downscaling techniques for hydrological 38
modelling. International Journal of Climatology, 27(12): 1547-1578. 39
Franczyk, J. and Chang, H., 2009. The effects of climate change and urbanization on the 40
runoff of the Rock Creek basin in the Portland metropolitan area, Oregon, USA. 41
Hydrological Processes, 23(6): 805-815. 42
Hayashi, M., van der Kamp, G. and Rudolph, D.L., 1998. Water and solute transfer 43
between a prairie wetland and adjacent uplands, 1. Water balance. Journal of 44
Hydrology, 207(1-2): 42-55. 45
Hellstrom, C. and Chen, D.L., 2003. Statistical downscaling based on dynamically 46
downscaled predictors: Application to monthly precipitation in Sweden. Advances 47
in Atmospheric Sciences, 20(6): 951-958. 48
Huang, G.H., Cohen, S.J., Yin, Y.Y. and Bass, B., 1998. Land resources adaptation 49
planning under changing climate - a study for the Mackenzie Basin. Resources 50
Conservation and Recycling, 24(2): 95-119. 51
Huang, Y.F., Zou, Y., Huang, G.H., Maqsood, I. and Chakma, A., 2005. Flood 52
vulnerability to climate change through hydrological modeling - A case study of 53
the swift current creek watershed in western Canada. Water International, 30(1): 54
31-39. 55
Jones, R.G. et al., 2004. Generating high resolution climate change scenarios using 56
PRECIS, Met Office Hadley Centre, Exeter, UK. 57
Katz, R.W., 1996. Use of conditional stochastic models to generate climate change 58
scenarios. Climatic Change, 32(3): 237-255. 59
Mailhot, A., Duchesne, S., Caya, D. and Talbot, G., 2007. Assessment of future change in 60
intensity-duration-frequency (IDF) curves for southern Quebec using the 61
Canadian regional climate model (CRCM). Journal of Hydrology, 347(1-2): 197-62
210. 63
Marengo, J.A., Jones, R., Alves, L.M. and Valverde, M.C., 2009. Future change of 64
temperature and precipitation extremes in South America as derived from the 65
PRECIS regional climate modeling system. International Journal of Climatology, 66
29(15): 2241-2255. 67
Marshall, E. and Randhir, T., 2008. Effect of climate change on watershed system: a 68
regional analysis. Climatic Change, 89(3-4): 263-280. 69
Mearns, L. et al., 2009. A regional climate change assessment program for North 70
America. EOS, Trans. Am. Geophys. Union, 90(311). 71
Minville, M., Brissette, F. and Leconte, R., 2008. Uncertainty of the impact of climate 72
change on the hydrology of a nordic watershed. Journal of Hydrology, 358(1-2): 73
70-83. 74
Moriasi, D.N. et al., 2007. Model evaluation guidelines for systematic quantification of 75
accuracy in watershed simulations. Transactions of the Asabe, 50(3): 885-900. 76
Music, B. and Caya, D., 2007. Evaluation of the hydrological cycle over the Mississippi 77
River basin as simulated by the Canadian regional climate model (CRCM). 78
Journal of Hydrometeorology, 8(5): 969-988. 79
Nakicenovic, N., Alcamo, J. and Davis, G., 2000. Special Report on Emissions Scenarios: 80
A Special Report of Working Group III of the Intergovernmental Panel on 81
Climate Change, IPCC. 82
Nash, J.E. and Sutcliffe, J.V., 1970. River flow forecasting through conceptual models: 83
Part 1. A discussion of principles. Journal of Hydrology, 10(3): 282-290. 84
Price, J.S., Branfireun, B.A., Waddington, J.M. and Devito, K.J., 2005. Advances in 85
Canadian wetland hydrology, 1999-2003. Hydrological Processes, 19(1): 201-214. 86
Qin, X.S., Huang, G.H., Chakma, A., Nie, X.H. and Lin, Q.G., 2008. A MCDM-based 87
expert system for climate-change impact assessment and adaptation planning - A 88
case study for the Georgia Basin, Canada. Expert Systems with Applications, 89
34(3): 2164-2179. 90
Semenov, M.A. and Barrow, E.M., 1997. Use of a stochastic weather generator in the 91
development of climate change scenarios. Climatic Change, 35(4): 397-414. 92
Semenov, M.A., Brooks, R.J., Barrow, E.M. and Richardson, C.W., 1998. Comparison of 93
the WGEN and LARS-WG stochastic weather generators for diverse climates. 94
Climate Research, 10(2): 95-107. 95
Somura, H. et al., 2009. Impact of climate change on the Hii River basin and salinity in 96
Lake Shinji: a case study using the SWAT model and a regression curve. 97
Hydrological Processes, 23(13): 1887-1900. 98
Stone, M.C. et al., 2001. Impacts of climate change on Missouri River Basin water yield. 99
Journal of the American Water Resources Association, 37(5): 1119-1129. 100
Su, M., Stolte, W.J. and van der Kamp, G., 2000. Modelling Canadian prairie wetland 101
hydrology using a semi-distributed streamflow model. Hydrological Processes, 102
14(14): 2405-2422. 103
Toews, M.W. and Allen, D.M., 2009. Evaluating different GCMs for predicting spatial 104
recharge in an irrigated arid region. Journal of Hydrology, 374(3-4): 265-281. 105
van der Kamp, G., Hayashi, M. and Gallen, D., 2003. Comparing the hydrology of 106
grassed and cultivated catchments in the semi-arid Canadian prairies. 107
Hydrological Processes, 17(3): 559-575. 108
Voldseth, R.A., Johnson, W.C., Gilmanov, T., Guntenspergen, G.R. and Millett, B.V., 109
2007. Model estimation of land-use effects on water levels of northern prairie 110
wetlands. Ecological Applications, 17(2): 527-540. 111
Voldseth, R.A., Johnson, W.C., Guntenspergen, G.R., Gilmanov, T. and Millett, B.V., 112
2009. ADAPTATION OF FARMING PRACTICES COULD BUFFER 113
EFFECTS OF CLIMATE CHANGE ON NORTHERN PRAIRIE WETLANDS. 114
Wetlands, 29(2): 635-647. 115
Wilby, R.L. et al., 2000. Hydrological responses to dynamically and statistically 116
downscaled climate model output. Geophysical Research Letters, 27(8): 1199-117
1202. 118
Williams, J.R., 1995. The EPIC Model, Computer Models of Watershed Hydrology. 119
Water Resources Publications, Highlands Ranch, CO, pp. 909-1000. 120
Woo, M.K. and Rowsell, R.D., 1993. HYDROLOGY OF A PRAIRIE SLOUGH. Journal 121
of Hydrology, 146(1-4): 175-207. 122
Wood, A.W., Leung, L.R., Sridhar, V. and Lettenmaier, D.P., 2004. Hydrologic 123
implications of dynamical and statistical approaches to downscaling climate 124
model outputs. Climatic Change, 62(1-3): 189-216. 125
Yang, H.L., Xu, Y.L., Zhang, L., Pan, J. and Li, X., 2010. Projected change in heat waves 126
over China using the PRECIS climate model. Climate Research, 42(1): 79-88. 127
Zhang, H. and Huang, G.H., 2009. Building channel networks for flat regions in digital 128
elevation models. Hydrological Processes, 23(20): 2879-2887. 129
130 131 132
Figure Captions
133 134
Figure 1. The (a) topography, (b) land use and (c) soil of the Assiniboia watershed. Ad: 135
Brown Chernozemic soils formed in clay loam glacial till; HwEx: a mixture of Regosolic 136
and Chernozemic soils and bedrock outcrops formed in various deposits and bedrock 137
materials; Bm: a mixture of Gleysolic and Regosolic soils formed in clayey alluvial 138
materials; Ww: Brown Chernozemic soils formed in variable, clayey lacustrine materials; 139
AdWw: Brown Chernozemic soils formed in a mixture of clay loam glacial till and 140
variable, clayey lacustrine materials. 141
142
Figure 2. Comparison of simulated and observed monthly inflows of the Old Willows 143
Reservoir (1978-2003). 144
145
Figure 3. Comparison of simulated and observed climate normals for the baseline period 146
(1961-1990). 147
148
Figure 4. Downscaled temperature and precipitation based on the outputs of (a) CRCM 149
and (b) PRECIS. (Note: the exclusion and inclusion of precipitation occurrence shifts are 150
denoted by A and B, respectively.) 151
152
Figure 5. Absolute changes of mean monthly water yields under the downscaled 153
projections of (a) CRCM and (b) PRECIS. (Note: the exclusion and inclusion of 154
precipitation occurrence shifts are denoted by A and B, respectively.) 155
156
Figure 6. Absolute changes of mean monthly evapotranspiration under the downscaled 157
projections of (a) CRCM and (b) PRECIS. (Note: the exclusion and inclusion of 158
precipitation occurrence shifts are denoted by A and B, respectively.) 159
160
Figure 7. Relative changes of monthly reservoir storage under the downscaled projections 161
of (a) CRCM and (b) PRECIS. The values for January, February and December are 162
excluded because the hydrological model can hardly analyze the water balance when the 163
reservoir is persistently frozen. (Note: the exclusion and inclusion of precipitation 164
occurrence shifts are denoted by A and B, respectively.) 165
Table 1. Scenarios of future climate (2041 - 2070) for downscaling studies. Scenario RCM SWG Precipitation occurrence 1 CRCM LARS-WG 2 CRCM LARS-WG √ 3 CRCM WXGEN 4 CRCM WXGEN √ 5 PRECIS LARS-WG 6 PRECIS LARS-WG √ 7 PRECIS WXGEN 8 PRECIS WXGEN √
Table 2. Calibrated SWAT parameters
Parameter Definition Initial value Calibration Range Calibrated value
TIMP Snowpack temperature lag factor 1 0.01 to 1 0.39
SMFMX Melt factor for snow on June 21 [mm H2O/ºC-day] 4.5 5.5 to 7.5 7.09
SMFMN Melt factor for snow on December 21 [mm H2O/ºC-day] 4.5 0.5 to 3.5 1.74
SFTMP Snowfall temperature [ºC] 1 -1.5 to1.5 -0.28
SMTMP Snow melt base temperature [ºC] 0.5 -0.5 to 1.5 1.03
CN2 Initial SCS CN II value 81-85 ± 20% -18.9% to 5.2%
ALPHA_BF Baseflow alpha factor [days] 0.048 0 to1 0.005
SOL_AWC Available water capacity [mm H2O /mm soil] 0.14-0.18 ± 25% -0.6% to 18.2%
SOL_K Saturated hydraulic conductivity [mm/hr] 6.8-32.9 ± 25% 10.4% to 23.9%
GW_REVP Groundwater "revap" coefficient 0.02 ± 50% -38.8%
SURLAG Surface runoff lag time [days] 4 0-10 8.3
Table 3. Monthly shifts based on CRCM projections for the periods of 1961-1990 and 2041-2070. Month Maximum Temperature (ºC) Minimum Temperature (ºC) Monthly Precipitation (mm) Daily Precipitation (mm) Number of Rain Days P(W/W) P(W/D) Length of Wet Spell* Length of Dry Spell*
Mean SD* Mean SD* Mean SD* SD* Skewness*
Jan 3.52 -0.03 4.12 -0.05 0.26 0.30 0.21 0.08 1.90 0.06 0.01 0.06 -0.07 Feb 3.98 0.00 5.09 0.06 0.05 0.92 0.34 1.26 0.23 0.03 -0.02 0.22 0.08 Mar 2.62 -0.13 4.36 -0.22 0.13 0.29 0.41 0.88 0.10 0.01 -0.01 0.05 0.00 Apr 1.44 -0.06 1.27 -0.26 0.11 0.34 0.21 0.16 1.10 0.06 -0.02 0.10 0.01 May 1.18 0.05 1.78 0.05 0.10 0.36 0.04 -0.20 1.27 0.08 -0.03 0.22 0.04 Jun 2.35 0.09 2.26 -0.02 -0.02 -0.20 -0.11 -0.38 0.43 0.02 -0.01 0.24 -0.07 Jul 3.13 0.08 3.25 0.04 0.09 0.24 -0.01 -0.42 -0.37 -0.02 0.01 -0.17 0.04 Aug 3.63 0.05 3.15 -0.01 0.06 0.52 0.15 -0.09 -1.53 -0.08 0.03 -0.18 0.09 Sep 3.07 0.05 2.87 0.14 -0.05 -0.22 0.09 0.28 -0.53 -0.01 -0.01 -0.02 0.09 Oct 3.28 0.08 2.12 0.08 0.03 0.80 0.09 0.06 -0.83 -0.05 0.02 -0.06 0.01 Nov 1.36 -0.06 2.32 -0.12 0.12 0.47 0.07 -0.08 1.43 0.08 -0.03 0.17 -0.02 Dec 2.45 0.07 3.65 0.07 0.11 0.07 0.08 -0.12 0.83 0.02 0.00 0.01 0.05 * Relatively variation.
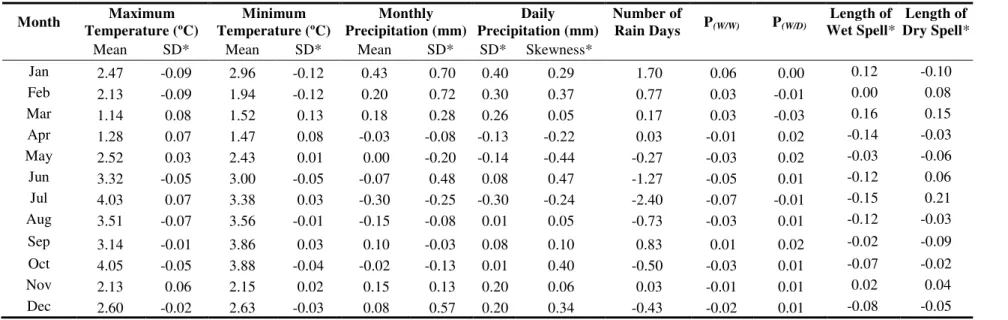
Table 4. Monthly shifts based on PRECIS projections for the periods of 1961-1990 and 2041-2070. * Relatively variation. Month Maximum Temperature (ºC) Minimum Temperature (ºC) Monthly Precipitation (mm) Daily Precipitation (mm) Number of Rain Days P(W/W) P(W/D) Length of Wet Spell* Length of Dry Spell*
Mean SD* Mean SD* Mean SD* SD* Skewness*
Jan 2.47 -0.09 2.96 -0.12 0.43 0.70 0.40 0.29 1.70 0.06 0.00 0.12 -0.10 Feb 2.13 -0.09 1.94 -0.12 0.20 0.72 0.30 0.37 0.77 0.03 -0.01 0.00 0.08 Mar 1.14 0.08 1.52 0.13 0.18 0.28 0.26 0.05 0.17 0.03 -0.03 0.16 0.15 Apr 1.28 0.07 1.47 0.08 -0.03 -0.08 -0.13 -0.22 0.03 -0.01 0.02 -0.14 -0.03 May 2.52 0.03 2.43 0.01 0.00 -0.20 -0.14 -0.44 -0.27 -0.03 0.02 -0.03 -0.06 Jun 3.32 -0.05 3.00 -0.05 -0.07 0.48 0.08 0.47 -1.27 -0.05 0.01 -0.12 0.06 Jul 4.03 0.07 3.38 0.03 -0.30 -0.25 -0.30 -0.24 -2.40 -0.07 -0.01 -0.15 0.21 Aug 3.51 -0.07 3.56 -0.01 -0.15 -0.08 0.01 0.05 -0.73 -0.03 0.01 -0.12 -0.03 Sep 3.14 -0.01 3.86 0.03 0.10 -0.03 0.08 0.10 0.83 0.01 0.02 -0.02 -0.09 Oct 4.05 -0.05 3.88 -0.04 -0.02 -0.13 0.01 0.40 -0.50 -0.03 0.01 -0.07 -0.02 Nov 2.13 0.06 2.15 0.02 0.15 0.13 0.20 0.06 0.03 -0.01 0.01 0.02 0.04 Dec 2.60 -0.02 2.63 -0.03 0.08 0.57 0.20 0.34 -0.43 -0.02 0.01 -0.08 -0.05
Figure Captions
Figure 1. The (a) topography, (b) land use and (c) soil of the Assiniboia watershed. Ad: Brown Chernozemic soils formed in clay loam glacial till; HwEx: a mixture of Regosolic and Chernozemic soils and bedrock outcrops formed in various deposits and bedrock materials; Bm: a mixture of Gleysolic and Regosolic soils formed in clayey alluvial materials; Ww: Brown Chernozemic soils formed in variable, clayey lacustrine materials; AdWw: Brown Chernozemic soils formed in a mixture of clay loam glacial till and variable, clayey lacustrine materials.
Figure 2. Comparison of simulated and observed monthly inflows of the Old Willows Reservoir (1978-2003).
Figure 3. Comparison of simulated and observed climate normals for the baseline period (1961-1990).
Figure 4. Downscaled temperature and precipitation based on the outputs of (a) CRCM and (b) PRECIS. (Note: the exclusion and inclusion of precipitation occurrence shifts are denoted by A and B, respectively.)
Figure 5. Absolute changes of mean monthly water yields under the downscaled projections of (a) CRCM and (b) PRECIS. (Note: the exclusion and inclusion of precipitation occurrence shifts are denoted by A and B, respectively.)
Figure 6. Absolute changes of mean monthly evapotranspiration under the downscaled projections of (a) CRCM and (b) PRECIS. (Note: the exclusion and inclusion of precipitation occurrence shifts are denoted by A and B, respectively.)
Figure 7. Relative changes of monthly reservoir storage under the downscaled projections of (a) CRCM and (b) PRECIS. The values for January, February and December are excluded because the hydrological model can hardly analyze the water balance when the reservoir is persistently frozen. (Note: the exclusion and inclusion of precipitation occurrence shifts are denoted by A and B, respectively.)