Publisher’s version / Version de l'éditeur:
Vous avez des questions? Nous pouvons vous aider. Pour communiquer directement avec un auteur, consultez la première page de la revue dans laquelle son article a été publié afin de trouver ses coordonnées. Si vous n’arrivez pas à les repérer, communiquez avec nous à PublicationsArchive-ArchivesPublications@nrc-cnrc.gc.ca.
Questions? Contact the NRC Publications Archive team at
PublicationsArchive-ArchivesPublications@nrc-cnrc.gc.ca. If you wish to email the authors directly, please see the first page of the publication for their contact information.
https://publications-cnrc.canada.ca/fra/droits
L’accès à ce site Web et l’utilisation de son contenu sont assujettis aux conditions présentées dans le site LISEZ CES CONDITIONS ATTENTIVEMENT AVANT D’UTILISER CE SITE WEB.
Research Report (National Research Council of Canada. Institute for Research in Construction), 2005-07-01
READ THESE TERMS AND CONDITIONS CAREFULLY BEFORE USING THIS WEBSITE.
https://nrc-publications.canada.ca/eng/copyright
NRC Publications Archive Record / Notice des Archives des publications du CNRC :
https://nrc-publications.canada.ca/eng/view/object/?id=80ad0f2f-bc5a-4848-8a11-80d38cc83c73 https://publications-cnrc.canada.ca/fra/voir/objet/?id=80ad0f2f-bc5a-4848-8a11-80d38cc83c73
NRC Publications Archive
Archives des publications du CNRC
For the publisher’s version, please access the DOI link below./ Pour consulter la version de l’éditeur, utilisez le lien DOI ci-dessous.
https://doi.org/10.4224/20378403
Access and use of this website and the material on it are subject to the Terms and Conditions set forth at Experimental Studies on the Fire Resistance of Hollow Steel Columns Filled with High-Strength Concrete
EXPERIMENTAL STUDIES ON THE FIRE RESISTANCE OF HOLLOW STEEL COLUMNS FILLED WITH HIGH-STRENGTH CONCRETE
V.K.R. Kodur and J.C. Latour
Research Report No. XXX
July 2005
Fire Research Program
Institute for Research in Construction National Research Council Canada
EXPERIMENTAL STUDIES ON THE FIRE RESISTANCE OF HOLLOW STEEL COLUMNS FILLED WITH HIGH-STRENGTH CONCRETE
by
EXPERIMENTAL STUDIES ON THE FIRE RESISTANCE OF HOLLOW STEEL COLUMNS FILLED WITH HIGH-STRENGTH CONCRETE
ABSTRACT
Experiments were carried out to determine the fire resistance of hollow steel columns filled with high strength concrete (HSC). The results of eight full-scale fire resistance experiments are described in this report. The main study variables were the column dimensions, load intensity and concrete reinforcement. These studies were conducted as part of a research program aimed at determining the fire performance of HSC-filled hollow steel columns.
EXPERIMENTAL STUDIES ON THE FIRE RESISTANCE OF HOLLOW STEEL COLUMNS FILLED WITH HIGH-STRENGTH CONCRETE
1. INTRODUCTION
Steel hollow structural section (HSS) columns are very efficient structurally in carrying compression loads and moments and are widely used around the world in the construction of framed structures in office and industrial buildings. Often these sections are filled with concrete to enhance the load-bearing capacity. The two components of the composite column complement each other ideally, in that the steel casing confines the concrete laterally allowing it to develop its optimum compressive strength, while the concrete, in turn, enhances resistance to elastic local buckling of the steel wall.
Another advantage of concrete filling is that it also increases the fire resistance of the column without the need for external fire protection for the steel. This increases usable space in the building. Properly designed concrete-filled columns can lead economically to the realization of architectural and structural design with visible steel without any restrictions on fire safety [1, 2].
In recent years, high strength concrete (HSC) has become an attractive alternative to traditional normal strength concrete (NSC), since it further increases the load-carrying capacity of HSS columns [3, 4]. As well, the high stiffness of HSC prevents elastic local buckling in the steel wall while the confinement within the steel HSS, enhances the ductility, which sometimes is a major concern for HSC. These advantages have led to the increased use of HSC-filled HSS columns [5].
The benefits from the use of HSC filling can be maximised if the external fire protection is eliminated. The enhancement of fire resistance of HSS columns, leading to the use of unprotected concrete-filled HSS columns, has been established for NSC filling (concrete strength below 55 MPa) by a number of studies [2, 6, 7]. However, there is little information available in the literature on the fire performance of HSS columns filled with HSC (strength above 55 MPa). Further, the behaviour of HSC at elevated temperatures is significantly different from that of NSC [4, 8].
To develop test data on HSC-filled HSS columns, fire resistance experiments were carried out on HSC-filled steel columns. In this report, results of the fire resistance experiments of HSS columns filled with HSC concrete are presented for three types of concrete filling (plain, bar reinforced and steel fibre reinforced).
2. TEST SPECIMENS
2.1 Dimensions
All columns were 3810 mm long from end plate to end plate and were of various cross sectional sizes. The outside diameter, D, of the circular columns ranged from 203.2 mm to 406.4 mm while the square columns were of 203.2 mm sides. The wall thickness (t) ranged from 4.78 mm to 12.70 mm. The dimensions of each column are listed in Table 1. Six columns had a circular cross-section; the remaining two columns had square cross section. The HSS columns were filled with one of the three types of concrete, namely plain concrete (PC), bar reinforced concrete (RC) and steel fibre reinforced concrete (FC).
2.2 Materials
2.2.1 Steel
Steel hollow structural sections (HSS) meeting the requirements of CSA Standard G40.20-M81 [9], Class H, were used. The sections were made with Grade 300W steel, which had a minimum yield strength of 300 MPa. The sections were supplied by Stelco Inc. The end plates were constructed using mild steel.
2.2.2 Concrete
Five batches of concrete mix were supplied by Dufferin Concrete, from Ottawa. RC-filled HSS columns C-62, C-70 and SQ-14 were cast from the first batch, while the two FC-RC-filled HSS columns C-36 and SQ-11 were cast from the second batch of concrete. The remaining three columns were each cast from individual batches. The mixes were made with general purpose Type 10 and Type 30 Portland cement, carbonate stone and silica based sand. In columns C-46 and C-47, silica fume was added to the mix in order to achieve a higher concrete strength. RIBTEC1 steel fibre’s of XOREX type, supplied by Ribbon Technology Corporation [10], were used as reinforcement in Batches 2 and 3. The fibre’s, which were 50 mm long and 0.9 mm equivalent diameter, had an aspect ratio of 57. The percentage of steel fibre’s in the concrete mix was 1.8% by mass. Superplasticizer, Mighty 150 and Daracem 1001, and retarding admixtures, Daratard 171, were added to some mixes to improve workability. Batch quantities of the concrete and the columns fabricated from each batch are given in Table 1. The 28-day cylinder compressive strengths ranged from 68.4 to 90.5 MPa.
2.3 Fabrication
2.3.1 Steel Column
The hollow steel sections were fabricated by cutting the supplied sections to 3797 mm in length. Steel end plates were then welded to both section extremities, with special attention being given to the centering and perpendicularity of the end plates. The total column length was 3810 mm including end plates.
The hollow steel sections and end plates were joined by a fillet weld added around the outside diameter of the hollow steel section. AWS 5.18 Type E705-6 welding rods were used for both welds. Figures 1 and 2 shows elevation and cross-sectional details of a typical column.
Before assembly, a hole was cut in each plate to provide an opening through which the concrete was poured. The hole was approximately 25 mm smaller in diameter than the inside diameter of the section. This construction provided a 13 mm lip to transfer the load from the steel plate to the concrete filling. The end plate connection detail is shown in Figure 3.
Five small holes were drilled in the wall of the steel sections. Two pairs, 15.9 mm in diameter, located 457 mm from each end of the columns, were provided as vent holes for the water vapour produced during the experiment. The fifth hole, 25 mm in diameter, located near the top end plate, was used for entry of thermocouple wires.
2.3.2 Reinforcement
For the RC-filled HSS columns C-62, C-70 and SQ-14, the reinforcing bars were tied together to form a steel cage, which was placed inside the column. Deformed bars, meeting the
1
Certain commercial products are identified in this paper in order to adequately specify the experimental details. In no case does such identification imply recommendation or endorsement by the National Research Council of Canada, nor does it imply that the product or material identified is the best available for the purpose.
CSA Standard G40.20-M81 [9] with minimum yield strength of 400 MPa, were used for the main reinforcing and tie bars. The diameter of the main reinforcing bars was 19.5 mm. The diameter of the ties was 6.4 mm.
The main reinforcing bars were tied together to complete the steel cage. The main bars were cut 10 mm shorter than the column length. The steel cage was then placed into the column with special care to ensure appropriate centering.
The longitudinal reinforcement consisted of 4-16mm main rebars, while 6.4 mm ties, provided at a spacing of 295 mm, formed the lateral reinforcement. The cover to the main reinforcing bars was 23 mm. For columns C-62 and C-70, the longitudinal reinforcement consisted of 4-16mm main rebars with a tie diameter of 6.4 mm and a spacing of 254 mm. Typical reinforcement details are shown in Figure 2.
For FC-filling, steel fibre’s, 1.77 percent by mass, were mixed with the concrete.
2.3.3 Concrete Placement
The concrete was mixed in a truck mixer. The steel fibre’s were added to the fresh concrete and mixed for approximately 5 minutes to provide uniform dispersion. The columns were put in an upright position and filled with the concrete. A concrete placement bucket and a funnel were used to deposit the concrete in the steel column. An internal vibrator was used to consolidate the concrete inside the column. The top surface of the column was finished with a small trowel. The section was sealed at both ends with plastic sheet and tape to avoid possible moisture leaks. The columns were left upright for 28 days, then stored horizontally at room temperature, with no particular curing measures being taken, until the test date. In general, six months or more elapsed between the time a column was poured and the time it was tested. However, for Column C-46, the curing period was limited to five months.
Before most tests, the moisture condition in the center of a column section was measured by inserting a Vaisala1 moisture sensor in a hole drilled in the concrete through one of the vent holes. A moisture content corresponding to approximately 55 to 85% relative humidity was measured.
2.3.4 Instrumentation
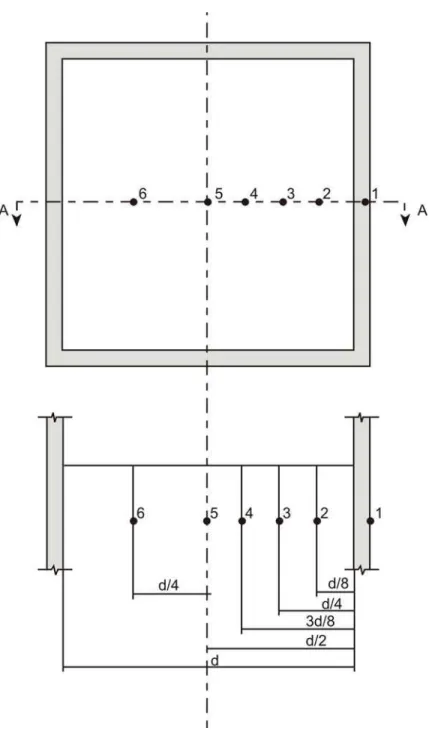
Type K chromel-alumel thermocouples, with a thickness of 0.91 mm, were used for measuring concrete temperatures at several locations across the mid-height section of the columns. The thermocouples were tied to a steel rod that was secured to a bar running along the longitudinal axis of the column. The bar was fixed at both ends of the column as shown in Figure 4. In addition, a thermocouple was attached to the steel wall of each column at mid-height. Also, an additional four thermocouples were mounted on rebars and ties in RC-filled HSS columns. The thermocouple locations in various columns are shown in Figures 5 to 8. In these figures ‘d’ represents the inside diameter of the HSS column.
3. TEST APPARATUS
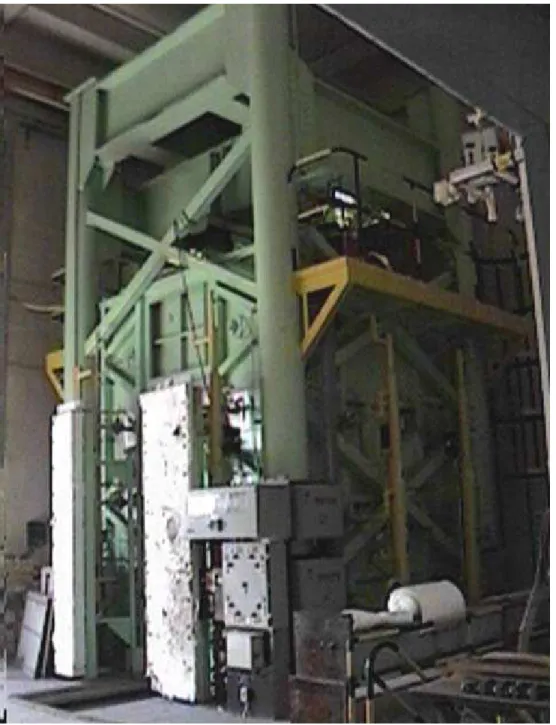
The tests were carried out by exposing the columns to heat in a furnace specially built for testing loaded columns and walls. The test furnace was designed to produce conditions to which a member might be exposed during a fire, i.e., temperatures, structural loads and heat transfer. It consisted of a steel framework supported by four steel columns, with the furnace chamber inside the framework (Figure 9). The characteristics and instrumentation of the furnace are described in detail in Reference [11]. Only a brief description of the furnace and the main components is given here.
1
3.1 Loading Device
A hydraulic jack with a capacity of 9778 kN produces a load along the axis of the test column. The jack is located at the bottom of the furnace chamber. Eccentric loads can be applied by means of hydraulic jacks, one at the top and one at the bottom of the column, located at a distance of 508 mm from the axis of the column. The capacity of the top jack is 587 kN and that of the bottom jack is 489 kN.
3.2 Furnace Chamber
The furnace chamber has a floor area of 2642 x 2642 mm and is 3048 mm high. The interior of the chamber is lined with insulating materials that efficiently transfer heat to the specimen. The ceiling and floor insulation protects the column end plates from fire. It should be noted that only 3200 mm of the column is exposed to fire.
There are 32 propane gas burners in the furnace chamber, arranged in eight columns containing four burners each. The total capacity of the burners is 4700 kW. Each burner can be adjusted individually, which allows for a high degree of temperature uniformity in the furnace chamber. The pressure in the furnace chamber is also adjustable and was set somewhat lower than atmospheric pressure.
3.3 Instrumentation
The furnace temperatures were measured with the aid of eight Type K chromel-alumel thermocouples. The thermocouple junctions were located 305 mm from the test specimen, at various heights. Two thermocouples were placed opposite each other at intervals of 610 mm along the height of the furnace chamber. The locations of their junctions and their numbering are shown in Figure 10. Thermocouples 4 and 6 were located at a height of 610 mm from the floor, Thermocouples 2 and 8 at 1220 mm, Thermocouples 3 and 5 at 1830 mm and Thermocouples 1 and 7 at 2440 mm. The temperatures measured by the thermocouples were averaged automatically and the average temperature was used to control the furnace temperature.
The loads were controlled by servo-controllers and measured with pressure transducers. The accuracy of controlling and measuring loads is about 4 kN at lower load levels and relatively better at higher loads.
The axial deformation of the test columns was determined by measuring the displacement of the jack that supports the column. The rotation of the end plates of the columns was determined by measuring the displacement of the plates at a distance of 500 mm from the center of the hinge at the top and bottom respectively. The displacements were measured using transducers with an accuracy of 0.002 mm.
4. TEST CONDITIONS AND PROCEDURES
4.1 End Conditions
All columns were tested with both ends of the column fixed, i.e. restrained against rotation and horizontal translation. For this purpose, eight 19 mm diameter bolts spaced regularly around the column, were used at each end to bolt the end plate to the loading head at the top and the hydraulic jack at the bottom.
4.2 Loading
All columns were tested under a concentric load. The applied load on the columns ranged from 24 to 52% of the factored compressive resistance of the columns (Crc) or 39 to 100% of the factored compressive resistance of the concrete core (C’r), determined according to
CSA Standard CSA/CAN-S16.1-M89 [12]. The factored compressive resistances of each column, as well as the applied loads, are given in Table 1. The factored compressive resistances of the columns were calculated using the effective length factors, K, recommended in CSA/CAN-S16.1-M89 for the given end conditions, i.e. 0.65 for fixed ends.
All loads were applied approximately 45 minutes before the start of the test and were maintained until a condition was reached at which no further increase of the axial and rotational deformations could be measured. This condition was selected as the initial condition of the column deformations. The load was maintained constant throughout the test.
4.3 Fire Exposure
The ambient temperature at the start of each test was approximately 20°C. During the test, the column was exposed to heating controlled in such a way that the average temperature in the furnace followed, as closely as possible, the CAN/ULC-S101 [13] or ASTM-E119 [14] standard temperature-time curve. This curve can be calculated using the following equation: Tf = 20 + 750 [1 -exp(-3.79553√t)] + 170.41√t
where: t = time in hours
Tf = temperature of furnace in °C
4.4 Recording of Results
The furnace, concrete, steel and reinforcement temperatures, as well as axial deformations of the columns, were recorded at one-minute intervals.
4.5 Failure Criterion
The columns were considered to have failed, and the tests were terminated, when the axial hydraulic jack, which has a maximum speed of 76 mm/min, could no longer maintain the load. Generally, the failure of the columns, which was determined by visual observation, was in compression. However, bending was observed for Column C-36, C-47 and C-62. These columns failed by buckling.
5. RESULTS AND DISCUSSION
The results of the eight column tests are summarized in Table 1, in which the column characteristics, test conditions, fire resistances and failure modes are given for each column. The furnace, concrete and steel temperatures recorded during the tests, as well as the axial deformations of the column specimens, are given in Tables A1 to A16 and plotted in Figures A1 to A8, in Appendix A. Positive axial deformation values indicate expansion of the column. Figures B1 to B8 in Appendix B show photographs of the column specimens just after the fire resistance tests.
Data from the tests (Table 1) indicate that the best fire performance can be obtained with a steel-fibre reinforced concrete filling.
The increased fire resistance of fibre-reinforced HSC-filled columns, as compared to plain HSC-filled columns or bar reinforced HSC-filled columns, can be attributed to superior mechanical properties and fire endurance of fibre-reinforced concrete. Results from the experimental studies carried out to determine mechanical properties at elevated temperatures [15, 16] indicate that the compressive strength of fibre-reinforced concrete increases with temperature up to about 400°C. The steel fibre’s prevented early cracking and also contributed to the compressive strength of concrete at elevated temperatures.
Although the data from the steel-fibre reinforced columns seems to indicate that a greater concrete core diameter enhances the fire resistance, the bar reinforced columns do not clearly follow this trend. Due to small number of test samples it is not possible to draw specific conclusions. Further research, using both experimental and numerical studies, is needed to establish design methodologies for fire resistance evaluation of HSC-filled steel columns [17]. The authors recommend such studies be carried out in order to develop design equations for incorporation in codes and standards.
The reinforcement bars do not seem to have much effect on the fire performance of the columns if compared to plain HSC-reinforced columns.
REFERENCES
1. Klingsch, W., and Wuerker, K., 1985, “New developments in fire resistance of hollow section structures.” Symposium on Hollow Structural Sections in Building Construction, ASCE, Chicago, Illinois, USA.
2. Kodur, V.K.R., and Lie, T.T. 1995, Fire Performance of Concrete-filled Hollow Steel Columns. Journal of Fire Protection Engineering, 7(3): 89-98.
3. Prion, H.G.L. and Baraka, M. 1994. Thin-Walled Tubes Filled with High Strength Concrete, Canadian Journal of Civil Engineering, 21(1): 207-218.
4. Kodur, V.K.R. 1998, "Performance of high strength concrete-filled steel columns exposed to fire" Canadian Journal of Civil Engineering , 25(6), pp. 975-981.
5. Ghosh, S.K., 1997, "High strength concrete in Regions of High Seismicity”, Proceedings, 1997 ASCE Structures Congress, Vol. 2, Portland, Oregon, U.S.A., pp. 1001-1005. 6. Lie, T.T., and Kodur, V.K.R. 1996a. Fire Resistance of Steel Columns Filled with
Bar-reinforced Concrete, ASCE Journal of Structural Engineering, 121(1): 30-36.
7. Kodur, V.R., 1999, "Performance based fire resistance design of concrete-filled steel columns" Journal of Constructional Steel Research Institute, 51, 21-36.
8. Phan, L.T. 1996. Fire Performance of High-strength Concrete: A Report of the State-of-the-Art. National Institute of Standards and Technology, Gaithersburg, MD, USA. 9. General Requirement for Rolled or Welded Structural Quality Steels – G40.20-M81,
Canadian Standards Association, Toronto, Canada, 1981.
10. RIBTEC, Carbon Steel Fibers for Concrete Reinforcement, Ribbon Technology Corporation, Gahanna, Ohio, U.S.A.
11. Lie, T.T., New Facility to Determine Fire Resistance of Columns, Canadian Journal of Civil Engineering, 7(3), 1980, pp. 551-558.
12. Limit States Design of Steel Structures, CAN/CSA-S16.1-M89, Canadian Standards Association, Toronto, Canada, 1989.
13. Standard Methods of Fire Endurance Tests of Building Construction and Materials, CAN/ULC-S101, Underwriters' Laboratories of Canada, Scarborough, Canada, 1989. 14. Standard Methods of Fire Tests on Building Construction and Materials, ASTM E119-88,
American Society for Testing and Materials, Philadelphia, PA, USA, 1990.
15. Lie, T.T. and Kodur, V.K.R., Mechanical Properties of Fibre-Reinforced Concrete at Elevated Temperatures, IRC Internal Report No. 687, National Research Council of Canada, Institute for Research in Construction, Ottawa, Ontario, 1995.
16. Lie, T.T., and Kodur, V.K.R. 1996b. Thermal and Mechanical Properties of Steel Fibre-reinforced Concrete at Elevated Temperatures, Canadian Journal of Civil Engineering, 23 (4): 511-517.
17. Kodur, V.K.R. 2004, "Solutions for enhancing the fire endurance of HSS columns filled with high strength concrete" submitted to AISC Steel Construction Journal, 37(1), 13-24.
LIST OF TABLES
Table 1. Summary of test parameters and results
Table 2. Concrete mix batch quantities for filling in HSS columns
LIST OF FIGURES
Fig. 1 Typical elevation and cross-section of circular and of square PC- and FC-filled HSS columns
Fig. 2 Typical elevation and cross-section of circular and of square RC-filled HSS columns Fig. 3 End plate connection details for a typical column
Fig. 4 Layout of thermocouple frame in a column
Fig. 5 Location and numbering of thermocouple locations in PC- and FC-filled circular HSS columns (C-36, C-46, C-47, C-69)
Fig. 6 Location and numbering of thermocouple locations in FC-filled square HSS column SQ-11
Fig. 7 Location and numbering of thermocouple locations in RC-filled circular HSS columns C-62 and C-70
Fig. 8 Location and numbering of thermocouple locations in RC-filled square HSS column SQ-14
Fig. 9 Column Test Furnace
Table 1: Summary of test parameters and results
Column No.
C Circular Column
SQ Square Column
Reinforcement
S-Fibre’s Steel Fibre’s
SF Silica Fume
Bars Reinforcement Bars X % Factored Resistance
C'r Factored compressive resistance of concrete core of the column according to CAN3-S16.1-M89 Crc Factored compressive resistance of concrete-filled HSS column according to CAN3-S16.1-M90 Failure Mode
B Buckling
C Compression
Col.
No. Reinforcement HSS Dim. Concrete Strength Factored Res. Test load C Load Intensity
Failure Mode
Fire Resistance core wall 28 day Test day C'r Crc C/C'r C/Crc
- - mm mm MPa MPa kN kN kN - - - min
C-36 S-Fibre’s 219.1 4.78 90.10 98.1 1149 1987 600 0.52 0.30 B 174 C-46 Plain concrete 273.1 6.35 90.50 82.2 2094 3827 1050 0.50 0.27 C 48 C-47 Plain concrete 273.1 6.35 82.40 107.0 2679 4408 1050 0.39 0.24 B 51 C-62 Bars 2.3 % 219.1 4.78 81.70 not measured 1073 1912 900 0.84 0.47 B 43 C-69 S-Fibre’s 406.4 6.35 68.40 76.2 3693 6118 3200 0.87 0.52 C 259 C-70 Bars 2.5 % 406.4 12.70 81.70 93.2 4005 8685 4000 1.00 0.46 C 75 SQ-11 S-Fibre’s 203.2 6.35 90.10 99.5 1236 2777 900 0.73 0.32 C 128 SQ-14 Bars 2.2 % 203.2 6.35 81.70 not measured 1152 2693 1150 1.00 0.43 C 89
Table 2: Concrete mix batch quantities for filling in HSS columns
No. Column No. Unit
C-62 C-70 SQ-14 C-36 SQ-11 C-69 C-46 C-47 Batch 1 2 3 4 5 1 Cement Type 10 kg/m3 500 500 500 - - Type 30 kg/m3 - - - 500 500 2 Silica Fume kg/m3 50 50 50 30 30 3 Sand kg/m3 700 700 700 700 700 4 Gravel 1/2'' kg/m3 - - - 440 440 3/8'' kg/m3 1100 1100 1100 330 330 1/4'' kg/m3 - - - 330 330 5 Water kg/m3 140 140 140 135 135 6 Superplasticizer l/m3 8 8 8 - - 7 Retarder l/m3 1.2 1.2 1.2 - - - Water / (Cement +SF) - 2.6 2.6 2.6 2.5 2.5 8 Steel Fibre’s kg/m3 - 45 45 - - 9 28 Day Compressive Strength MPa 81.7 90.1 68.4 90.5 82.4
Fig. 1 Typical elevation and cross-section of circular and of square PC- and FC-filled HSS columns
Fig. 2 Typical elevation and cross-section of circular and of square RC-filled HSS columns (C-62, C-70, SQ-14)
Fig. 5 Location and numbering of thermocouple locations in PC- and FC-filled circular HSS columns (C-36, C-46, C-47, C-69)
Fig. 6 Location and numbering of thermocouple locations in FC-filled square HSS column SQ-11
Fig. 7 Location and numbering of thermocouple locations in RC-filled circular HSS columns C-62 and C-70
Fig. 8 Location and numbering of thermocouple locations in RC-filled square HSS column SQ-14
APPENDIX A
TEMPERATURES AND AXIAL DEFORMATIONS OF COLUMNS
List of Tables
Table. A.1 Temperatures for Column C-36 Table. A.2 Axial Deformation for Column C-36 Table. A.3 Temperatures for Column C-46 Table. A.4 Axial Deformation for Column C-46 Table. A.5 Temperatures for Column C-47 Table. A.6 Axial Deformation for Column C-47 Table. A.7 Temperatures for Column C-62 Table. A.8 Axial Deformation for Column C-62 Table. A.9 Temperatures for Column C-69 Table. A.10 Axial Deformation for Column C-69 Table. A.11 Temperatures for Column C-70 Table. A.12 Axial Deformation for Column C-70 Table. A.13 Temperatures for Column SQ-11 Table. A.14 Axial Deformation for Column SQ-11 Table. A.15 Temperatures for Column SQ-14 Table. A.16 Axial Deformation for Column SQ-14
List of Figures
Fig. A.1 Temperatures and Axial Deformation for Column C-36 Fig. A.2 Temperatures and Axial Deformation for Column C-46
Fig. A.3 Temperatures and Axial Deformation for Column C-47 Fig. A.4 Temperatures and Axial Deformation for Column C-62 Fig. A.5 Temperatures and Axial Deformation for Column C-69 Fig. A.6 Temperatures and Axial Deformation for Column C-70
Fig. A.7 Temperatures and Axial Deformation for Column for Column SQ-11 Fig. A.8 Temperatures and Axial Deformation for Column for Column SQ-14
Table A.1: Temperatures in concrete for Column C-36 Note: °F = (°C x 9/5) + 32 Time Std. Furn. Temp Avg. Furn. Temp
Temperatures (°C) at Thermocouple Number
(see Figure 5 for thermocouple locations)
(min) (°C) (°C) 1 2 3 4 5 6 7 8 9 10 0 20 50 28 18 18 18 18 *** *** *** *** *** 2 426 201 97 19 18 18 18 *** *** *** *** *** 4 533 439 189 23 19 18 18 *** *** *** *** *** 6 598 648 245 31 22 19 19 *** *** *** *** *** 8 645 683 294 45 28 21 20 *** *** *** *** *** 10 680 688 344 65 37 25 24 *** *** *** *** *** 12 709 712 390 81 47 31 29 *** *** *** *** *** 14 732 721 403 93 60 38 34 *** *** *** *** *** 16 752 748 459 107 74 46 42 *** *** *** *** *** 18 770 765 499 121 91 65 57 *** *** *** *** *** 20 785 778 571 136 109 106 104 *** *** *** *** *** 22 798 799 605 149 126 111 111 *** *** *** *** *** 24 810 805 632 163 134 114 114 *** *** *** *** *** 26 821 820 646 179 145 120 119 *** *** *** *** *** 28 830 825 665 196 156 126 125 *** *** *** *** *** 30 839 836 676 214 166 130 130 *** *** *** *** *** 32 848 846 690 234 176 134 134 *** *** *** *** *** 34 855 851 715 252 186 137 138 *** *** *** *** *** 36 862 855 731 270 193 140 139 *** *** *** *** *** 38 869 856 740 287 200 143 139 *** *** *** *** *** 40 875 853 746 303 210 148 145 *** *** *** *** *** 42 881 874 764 318 221 153 151 *** *** *** *** *** 44 887 885 783 333 233 158 155 *** *** *** *** *** 46 892 891 799 347 244 164 159 *** *** *** *** *** 48 897 897 811 361 256 170 165 *** *** *** *** *** 50 902 901 822 375 268 178 171 *** *** *** *** *** 52 907 904 830 389 280 186 177 *** *** *** *** *** 54 911 910 838 402 292 196 185 *** *** *** *** *** 56 915 913 847 415 304 205 193 *** *** *** *** ***
Table A.1: Temperatures in concrete for Column C-36 (cont’d) Note: °F = (°C x 9/5) + 32 Time Std. Furn. Temp Avg. Furn. Temp
Temperatures (°C) at Thermocouple Number
(see Figure 5 for thermocouple locations)
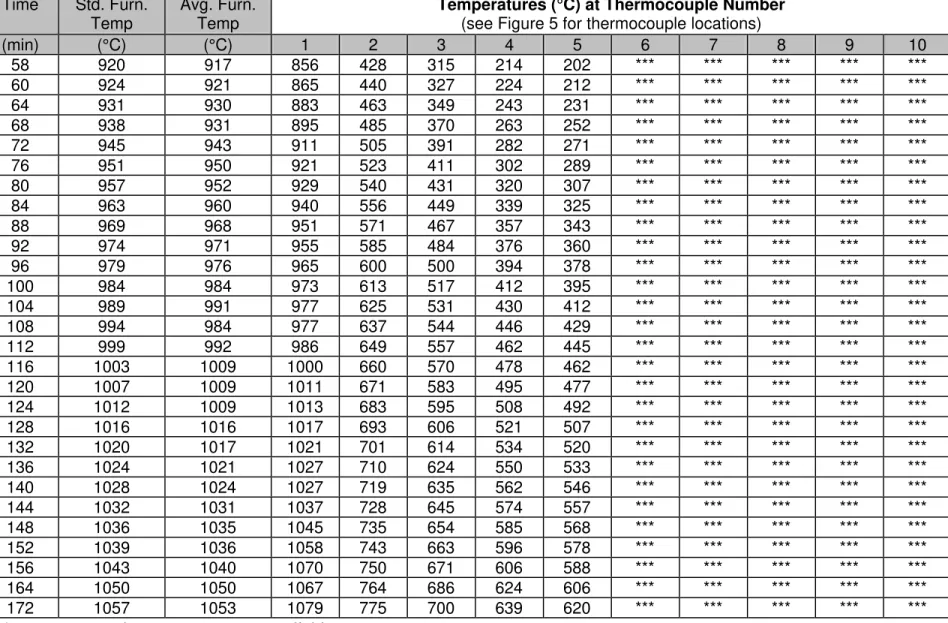
(min) (°C) (°C) 1 2 3 4 5 6 7 8 9 10 58 920 917 856 428 315 214 202 *** *** *** *** *** 60 924 921 865 440 327 224 212 *** *** *** *** *** 64 931 930 883 463 349 243 231 *** *** *** *** *** 68 938 931 895 485 370 263 252 *** *** *** *** *** 72 945 943 911 505 391 282 271 *** *** *** *** *** 76 951 950 921 523 411 302 289 *** *** *** *** *** 80 957 952 929 540 431 320 307 *** *** *** *** *** 84 963 960 940 556 449 339 325 *** *** *** *** *** 88 969 968 951 571 467 357 343 *** *** *** *** *** 92 974 971 955 585 484 376 360 *** *** *** *** *** 96 979 976 965 600 500 394 378 *** *** *** *** *** 100 984 984 973 613 517 412 395 *** *** *** *** *** 104 989 991 977 625 531 430 412 *** *** *** *** *** 108 994 984 977 637 544 446 429 *** *** *** *** *** 112 999 992 986 649 557 462 445 *** *** *** *** *** 116 1003 1009 1000 660 570 478 462 *** *** *** *** *** 120 1007 1009 1011 671 583 495 477 *** *** *** *** *** 124 1012 1009 1013 683 595 508 492 *** *** *** *** *** 128 1016 1016 1017 693 606 521 507 *** *** *** *** *** 132 1020 1017 1021 701 614 534 520 *** *** *** *** *** 136 1024 1021 1027 710 624 550 533 *** *** *** *** *** 140 1028 1024 1027 719 635 562 546 *** *** *** *** *** 144 1032 1031 1037 728 645 574 557 *** *** *** *** *** 148 1036 1035 1045 735 654 585 568 *** *** *** *** *** 152 1039 1036 1058 743 663 596 578 *** *** *** *** *** 156 1043 1040 1070 750 671 606 588 *** *** *** *** *** 164 1050 1050 1067 764 686 624 606 *** *** *** *** *** 172 1057 1053 1079 775 700 639 620 *** *** *** *** ***
*** = not measured or measurement not reliable Note: The test was terminated at 2 hours and 54 minutes
Table A.2: Axial deformations for Column C-36 Note: 1” = 25.4 mm Time Axial Deformation (min) (mm) 0 0.000 2 0.162 4 1.242 6 7.595 8 11.470 10 13.840 12 15.200 14 15.420 16 14.660 18 8.703 20 6.810 22 6.039 24 5.433 26 4.910 28 4.555 30 4.229 32 3.845 34 3.267 36 2.882 38 2.577 40 2.287 42 2.110 44 1.759 46 1.485 48 1.175 50 0.899 52 0.688 54 0.469 56 0.244 58 0.020 60 -0.183 64 -0.645 68 -1.173 72 -1.705 6 -2.340 80 -2.972 84 -3.664 88 -4.347 92 -5.154
Table A.2: Axial deformations for Column C-36 (cont’d) Note: 1” = 25.4 mm Time Axial Deformation (min) (mm) 96 -6.021 100 -6.952 104 -7.980 108 -9.080 112 -10.200 116 -11.360 120 -12.640 124 -13.980 128 -15.300 132 -16.660 136 -18.070 140 -19.520 144 -20.990 148 -22.500 152 -24.070 156 -25.680 164 -29.480 172 -34.840
Table A.3: Temperatures in concrete for Column C-46 Note: °F = (°C x 9/5) + 32 Time Std. Furn. Temp Avg. Furn. Temp
Temperatures (°C) at Thermocouple Number
(see Figure 5 for thermocouple locations)
(min) (°C) (°C) 1 2 3 4 5 6 7 8 9 10 0 20 56 22 15 16 15 16 *** *** *** *** *** 2 426 424 125 15 16 15 16 *** *** *** *** *** 4 533 595 220 17 16 15 15 *** *** *** *** *** 6 598 610 271 22 16 15 15 *** *** *** *** *** 8 645 653 300 28 17 15 15 *** *** *** *** *** 10 680 678 357 35 18 15 16 *** *** *** *** *** 12 709 698 343 47 24 17 17 *** *** *** *** *** 14 732 709 443 62 32 23 25 *** *** *** *** *** 16 752 753 490 80 42 30 34 *** *** *** *** *** 18 770 772 506 93 53 39 41 *** *** *** *** *** 20 785 788 537 95 60 43 42 *** *** *** *** *** 22 798 796 585 96 64 48 44 *** *** *** *** *** 24 810 804 618 99 67 49 46 *** *** *** *** *** 26 821 818 650 108 71 52 48 *** *** *** *** *** 28 830 828 672 113 81 55 51 *** *** *** *** *** 30 839 840 692 116 103 60 55 *** *** *** *** *** 32 848 850 710 116 112 72 69 *** *** *** *** *** 34 855 857 726 130 115 103 101 *** *** *** *** *** 36 862 858 734 142 117 115 113 *** *** *** *** *** 38 869 865 746 154 113 112 110 *** *** *** *** *** 40 875 873 764 164 112 111 110 *** *** *** *** *** 42 881 881 779 173 113 112 110 *** *** *** *** *** 44 887 888 793 184 114 113 112 *** *** *** *** *** 46 892 895 805 195 116 114 113 *** *** *** *** *** 48 897 849 808 207 123 116 115 *** *** *** *** ***
*** = not measured or measurement not reliable Note: The test was terminated at 48 minutes
Table A.4: Axial deformations for Column C-46 Note: 1” = 25.4 mm Time Axial Deformation (min) (mm) 0 0.00 2 0.78 4 2.75 6 5.88 8 8.40 10 10.64 12 12.26 14 12.86 16 12.66 18 7.63 20 5.51 22 4.40 24 3.77 26 3.34 28 2.96 30 2.63 32 2.28 34 1.92 36 1.31 38 -3.81 40 -5.91 42 -8.07 44 -10.38 46 -14.13 48 -23.61
Table A.5: Temperatures in concrete for Column C-47 Note: °F = (°C x 9/5) + 32 Time Std. Furn. Temp Avg. Furn. Temp
Temperatures (°C) at Thermocouple Number
(see Figure 5 for thermocouple locations)
(min) (°C) (°C) 1 2 3 4 5 6 7 8 9 10 0 20 48 25 20 20 20 20 20 *** *** *** *** 2 426 315 94 20 20 20 20 20 *** *** *** *** 4 533 592 212 22 20 20 20 20 *** *** *** *** 6 598 625 308 29 20 20 20 20 *** *** *** *** 8 645 651 381 41 20 20 20 20 *** *** *** *** 10 680 672 434 56 20 20 20 20 *** *** *** *** 12 709 703 478 70 21 20 21 21 *** *** *** *** 14 732 703 511 83 23 21 22 23 *** *** *** *** 16 752 730 551 95 25 23 25 25 *** *** *** *** 18 770 756 591 108 30 25 29 29 *** *** *** *** 20 785 766 619 123 38 31 39 34 *** *** *** *** 22 798 780 640 138 52 37 43 43 *** *** *** *** 24 810 815 671 151 65 44 47 52 *** *** *** *** 26 821 822 695 160 71 49 49 60 *** *** *** *** 28 830 844 717 169 83 55 64 71 *** *** *** *** 30 839 846 734 178 96 75 92 79 *** *** *** *** 32 848 847 737 188 101 90 102 86 *** *** *** *** 34 855 850 743 196 103 95 102 93 *** *** *** *** 36 862 860 758 205 105 99 104 98 *** *** *** *** 38 869 868 774 213 107 103 105 103 *** *** *** *** 40 875 872 773 216 109 105 107 106 *** *** *** *** 42 881 880 789 241 111 107 108 110 *** *** *** *** 44 887 890 800 257 114 109 109 113 *** *** *** *** 46 892 894 807 271 118 111 111 116 *** *** *** *** 48 897 897 820 283 123 112 112 119 *** *** *** *** 50 902 894 831 293 124 114 112 122 *** *** *** ***
*** = not measured or measurement not reliable Note: The test was terminated at 51 minutes
Table A.6: Axial deformations for Column C-47 Note: 1” = 25.4 mm Time Axial Deformation (min) (mm) 0 0.000 2 0.046 4 2.705 6 6.440 8 8.950 10 10.930 12 12.440 14 12.670 16 11.120 18 6.932 20 5.471 22 4.519 24 3.766 26 3.069 28 2.653 30 2.225 32 1.723 34 1.314 36 0.965 38 0.639 40 -1.303 42 -2.866 44 -4.117 46 -5.516 48 -8.543 50 -24.160
Table A.7: Temperatures in concrete for Column C-62 Note: °F = (°C x 9/5) + 32 Time Std. Furn. Temp Avg. Furn. Temp
Temperatures (°C) at Thermocouple Number
(see Figure 7 for thermocouple locations)
(min) (°C) (°C) 1 2 3 4 5 6 7 8 9 10 0 20 51 22 *** 22 22 22 22 22 22 22 31 2 426 426 27 *** 22 22 22 22 22 22 23 198 4 533 582 46 *** 22 22 24 27 22 22 29 249 6 598 630 64 *** 23 22 29 36 22 23 38 335 8 645 668 83 100 25 23 38 48 24 25 51 379 10 680 697 104 49 29 25 49 59 28 28 63 413 12 709 719 124 60 34 28 60 73 32 33 77 489 14 732 730 148 72 40 32 73 88 38 39 93 542 16 752 752 171 85 48 38 87 103 45 47 108 573 18 770 763 187 100 57 45 118 117 54 56 121 595 20 785 781 205 113 66 53 125 126 64 66 129 628 22 798 792 220 125 77 61 128 134 75 78 139 656 24 810 808 236 135 87 70 137 143 86 89 149 681 26 821 819 260 143 97 78 146 154 96 99 160 706 28 830 829 284 152 106 87 155 165 106 109 173 727 30 839 838 308 160 114 95 164 178 117 120 186 738 32 848 841 330 168 123 104 173 192 129 131 200 753 34 855 847 350 177 130 112 173 206 133 134 216 767 36 862 854 371 188 137 120 182 221 134 136 231 782 38 869 875 390 201 144 127 198 236 135 139 247 794 40 875 870 408 215 149 134 213 251 139 142 262 808 42 881 889 426 228 155 138 229 267 312 148 278 819
*** = not measured or measurement not reliable Note: The test was terminated at 43 minutes
Table A.8: Axial deformations for Column C-62 Note: 1” = 25.4 mm Time Axial Deformation (min) (mm) 0 0.000 2 0.943 4 3.307 6 4.913 8 5.646 10 5.731 12 4.889 14 3.692 16 3.014 18 2.430 20 2.048 22 1.702 24 1.349 26 0.932 28 0.383 30 -0.859 32 -2.813 34 -4.829 36 -7.212 38 -9.808 40 -13.320 42 -26.990
Table A.9: Temperatures in concrete for Column C-69 Note: °F = (°C x 9/5) + 32 Time Std. Furn. Temp Avg. Furn. Temp
Temperatures (°C) at Thermocouple Number
(see Figure 5 for thermocouple locations).
(min) (°C) (°C) 1 2 3 4 5 6 7 8 9 10 0 20 51 29 15 16 16 16 16 *** *** *** *** 2 426 445 162 15 16 16 16 16 *** *** *** *** 4 533 564 268 15 16 16 16 16 *** *** *** *** 6 598 622 344 15 16 16 16 16 *** *** *** *** 8 645 656 409 15 16 16 16 16 *** *** *** *** 10 680 692 473 15 16 16 16 16 *** *** *** *** 12 709 719 523 16 16 16 16 16 *** *** *** *** 14 732 725 556 16 16 16 16 16 *** *** *** *** 16 752 749 594 16 16 16 16 17 *** *** *** *** 18 770 771 615 17 16 16 16 17 *** *** *** *** 20 785 784 644 18 16 16 16 18 *** *** *** *** 22 798 799 675 19 16 16 16 18 *** *** *** *** 24 810 802 701 21 16 16 16 19 *** *** *** *** 26 821 820 724 22 17 16 16 20 *** *** *** *** 28 830 820 737 24 17 17 17 22 *** *** *** *** 30 839 835 751 26 18 17 17 23 *** *** *** *** 32 848 844 760 28 19 17 17 25 *** *** *** *** 34 855 854 773 31 20 18 17 26 *** *** *** *** 36 862 862 785 33 21 19 18 28 *** *** *** *** 38 869 865 795 36 23 19 18 31 *** *** *** *** 40 875 873 807 39 24 20 19 33 *** *** *** *** 42 881 874 816 42 26 21 20 35 *** *** *** *** 44 887 884 828 45 29 23 21 38 *** *** *** *** 46 892 893 839 49 31 24 22 41 *** *** *** *** 48 897 897 847 53 34 26 24 44 *** *** *** *** 50 902 891 853 56 37 28 25 47 *** *** *** *** 52 907 902 864 60 40 32 27 50 *** *** *** *** 54 911 908 871 64 43 35 29 54 *** *** *** *** 56 915 916 880 68 46 40 31 59 *** *** *** ***
Table A.9: Temperatures in concrete for Column C-69 (cont’d) Note: °F = (°C x 9/5) + 32 Time Std. Furn. Temp Avg. Furn. Temp
Temperatures (°C) at Thermocouple Number
(see Figure 5 for thermocouple locations)
(min) (°C) (°C) 1 2 3 4 5 6 7 8 9 10 58 920 919 887 72 50 45 34 64 *** *** *** *** 60 924 918 893 76 53 51 36 71 *** *** *** *** 64 931 932 906 85 61 64 40 92 *** *** *** *** 68 938 939 913 93 69 74 48 108 *** *** *** *** 72 945 943 922 102 77 82 57 120 *** *** *** *** 76 951 955 931 110 85 90 67 127 *** *** *** *** 80 957 948 931 119 92 96 80 132 *** *** *** *** 84 963 964 944 127 100 102 93 138 *** *** *** *** 88 969 975 952 135 110 109 118 145 *** *** *** *** 92 974 995 952 142 120 115 134 150 *** *** *** *** 96 979 978 944 147 131 122 136 153 *** *** *** *** 100 984 830 955 152 138 128 139 155 *** *** *** *** 108 994 826 952 159 144 142 140 152 *** *** *** *** 116 1003 842 964 165 143 141 140 151 *** *** *** *** 124 1012 844 973 171 142 138 138 154 *** *** *** *** 132 1020 1022 1007 180 144 135 134 159 *** *** *** *** 140 1028 1018 998 191 146 133 131 168 *** *** *** *** 148 1036 1035 1014 205 151 129 128 178 *** *** *** *** 156 1043 1041 1021 220 158 126 125 192 *** *** *** *** 164 1050 1048 1031 234 167 124 122 205 *** *** *** *** 172 1057 1054 1055 249 177 123 120 218 *** *** *** *** 180 1064 1062 1088 263 188 130 118 231 *** *** *** *** 188 1071 1067 1102 277 200 138 121 245 *** *** *** *** 196 1077 1076 1244 292 212 149 128 258 *** *** *** *** 204 1084 1079 1184 305 225 161 137 271 *** *** *** *** 220 1096 1090 1099 333 250 190 164 298 *** *** *** *** 236 1108 1105 897 360 277 220 197 325 *** *** *** *** 252 1119 1117 996 386 304 250 228 352 *** *** *** ***
*** = not measured or measurement not reliable
Table A.10: Axial deformations for Column C-69 Note: 1” = 25.4 mm Time Axial Deformation (min) (mm) 0 0.00 2 0.60 4 0.84 6 0.84 8 0.84 10 0.84 12 0.84 14 0.72 16 0.49 18 0.24 20 0.08 22 -0.05 24 -0.20 26 -0.32 28 -0.43 30 -0.57 32 -0.80 34 -0.97 36 -1.10 38 -1.20 40 -1.28 42 -1.40 44 -1.48 46 -1.56 48 -1.64 50 -1.74 52 -1.77 54 -1.87 56 -1.94 58 -2.00 60 -2.10 64 -2.29 68 -2.56 72 -2.86 76 -3.16 80 -3.53 84 -3.88 88 -4.25
Table A.10: Axial deformations for Column C-69 (cont’d) Note: 1” = 25.4 mm Time Axial Deformation (min) (mm) 92 -4.70 96 -5.17 100 -5.55 108 -6.56 116 -7.34 124 -8.14 132 -8.84 140 -9.75 148 -10.41 156 -11.19 164 -11.99 172 -12.88 180 -13.73 188 -14.43 196 -15.34 204 -16.29 220 -18.40 236 -20.87 252 -24.12
Table A.11: Temperatures in concrete for Column C-70 Note: °F = (°C x 9/5) + 32 Time Std. Furn. Temp Avg. Furn. Temp
Temperatures (°C) at Thermocouple Number
(see Figure 7 for thermocouple locations)
(min) (°C) (°C) 1 2 3 4 5 6 7 8 9 10 0 20 55 17 17 17 17 16 17 17 17 17 25 2 426 421 17 17 17 17 16 17 17 17 17 104 4 533 560 17 17 17 17 16 17 17 17 17 168 6 598 602 17 17 17 17 16 17 17 17 17 227 8 645 637 17 17 17 17 16 17 17 17 17 289 10 680 670 18 18 17 17 16 17 17 18 18 348 12 709 695 20 18 18 17 16 17 17 19 20 402 14 732 699 23 20 19 17 16 19 18 21 22 445 16 752 732 27 22 20 18 16 42 26 23 25 489 18 770 771 36 25 22 18 16 77 54 26 28 534 20 785 785 47 28 24 19 17 84 68 29 32 574 22 798 795 53 33 27 21 17 92 73 32 36 605 24 810 808 59 39 31 23 18 99 83 36 41 629 26 821 820 67 46 35 26 19 110 95 41 46 654 28 830 826 74 54 41 28 20 114 103 46 51 679 30 839 834 82 62 47 31 21 112 106 51 57 701 32 848 845 92 67 54 37 23 108 103 57 62 720 34 855 856 99 73 62 41 25 107 102 63 68 736 36 862 858 108 81 68 51 27 107 103 70 75 745 38 869 869 111 91 78 94 29 108 104 77 83 751 40 875 874 113 102 88 106 31 108 104 85 91 761 42 881 880 114 107 103 107 34 109 105 93 100 774 44 887 885 113 111 110 110 36 111 107 105 111 783 46 892 892 111 113 109 108 42 109 107 108 112 793 48 897 897 111 113 109 108 45 108 106 109 113 805 50 902 898 113 114 109 108 48 108 106 110 114 814 52 907 903 118 116 109 108 51 108 106 111 116 823 54 911 906 125 118 110 109 54 109 107 112 118 832
Table A.11: Temperatures in concrete for Column C-70 (cont’d) Note: °F = (°C x 9/5) + 32 Time Std. Furn. Temp Avg. Furn. Temp
Temperatures (°C) at Thermocouple Number
(see Figure 7 for thermocouple locations)
(min) (°C) (°C) 1 2 3 4 5 6 7 8 9 10 56 915 913 131 120 110 109 57 109 109 113 120 837 58 920 903 136 122 111 109 65 109 109 115 122 842 60 924 918 142 121 112 109 69 109 109 117 125 854 62 927 926 148 122 113 108 72 110 110 108 130 865 64 931 932 153 123 115 108 72 110 110 108 135 875 66 935 937 159 126 116 109 75 113 111 109 124 884 68 938 930 165 129 117 109 80 114 111 115 146 888 70 942 936 171 132 118 109 84 117 113 110 151 894 72 945 961 177 136 121 110 97 121 117 110 156 900 74 948 942 185 135 125 111 97 126 121 111 161 903
*** = not measured or measurement not reliable Note: The test was terminated at 1 hour and 15 minutes
Table A.12: Axial deformations for Column C-70 Note: 1” = 25.4 mm Time Axial Deformation (min) (mm) 0 0.000 2 0.200 4 1.182 6 1.998 8 2.625 10 2.961 12 3.039 14 3.039 16 2.757 18 2.022 20 1.340 22 0.740 24 0.327 26 0.050 28 -0.247 30 -0.522 32 -0.741 34 -0.950 36 -1.252 38 -1.630 40 -1.936 42 -2.173 44 -5.048 46 -7.368 48 -8.738 50 -9.870 52 -10.880 54 -11.830 56 -12.750 58 -13.590 60 -14.740 62 -16.240 64 -17.990 66 -20.030 68 -22.090 70 -24.250 72 -26.910 74 -30.000
Table A.13: Temperatures in concrete for Column SQ-11 Note: °F = (°C x 9/5) + 32 Time Std. Furn. Temp Avg. Furn. Temp
Temperatures (°C) at Thermocouple Number
(see Figure 6 for thermocouple locations)
(min) (°C) (°C) 1 2 3 4 5 6 7 8 9 10 0 20 50 27 21 21 21 21 21 *** *** *** *** 2 426 419 139 25 21 21 21 21 *** *** *** *** 4 533 585 234 37 22 21 21 21 *** *** *** *** 6 598 637 307 53 23 21 21 22 *** *** *** *** 8 645 654 353 70 29 24 28 29 *** *** *** *** 10 680 677 398 90 39 31 36 39 *** *** *** *** 12 709 697 441 108 49 40 43 48 *** *** *** *** 14 732 729 484 126 59 47 49 58 *** *** *** *** 16 752 742 521 143 71 54 53 68 *** *** *** *** 18 770 761 552 147 89 61 56 77 *** *** *** *** 20 785 783 598 153 100 69 61 85 *** *** *** *** 22 798 794 621 139 105 76 67 91 *** *** *** *** 24 810 807 634 141 107 83 77 97 *** *** *** *** 26 821 824 653 157 110 90 91 104 *** *** *** *** 28 830 825 672 168 110 96 103 110 *** *** *** *** 30 839 831 691 172 112 101 106 117 *** *** *** *** 32 848 844 710 174 115 105 111 124 *** *** *** *** 34 855 847 725 175 119 109 118 132 *** *** *** *** 36 862 858 738 185 122 114 127 139 *** *** *** *** 38 869 848 739 193 119 119 133 145 *** *** *** *** 40 875 854 746 203 121 124 133 151 *** *** *** *** 42 881 890 766 220 127 127 133 155 *** *** *** *** 44 887 885 784 241 132 129 133 158 *** *** *** *** 46 892 894 800 261 135 131 133 160 *** *** *** *** 48 897 892 809 281 140 131 130 162 *** *** *** *** 50 902 900 820 299 144 130 125 166 *** *** *** *** 52 907 899 828 318 148 130 126 169 *** *** *** *** 54 911 919 839 336 154 130 127 173 *** *** *** ***
Table A.13: Temperatures in concrete for Column SQ-11 (cont'd) Note: °F = (°C x 9/5) + 32 Time Std. Furn. Temp Avg. Furn. Temp
Temperatures (°C) at Thermocouple Number
(see Figure 6 for thermocouple locations)
(min) (°C) (°C) 1 2 3 4 5 6 7 8 9 10 56 915 915 847 353 159 132 129 178 *** *** *** *** 58 920 918 855 370 165 135 130 183 *** *** *** *** 60 924 924 864 386 172 137 132 190 *** *** *** *** 64 931 938 876 417 188 142 135 207 *** *** *** *** 68 938 934 884 447 205 149 141 225 *** *** *** *** 72 945 936 895 473 223 157 150 246 *** *** *** *** 76 951 957 901 499 244 169 161 266 *** *** *** *** 80 957 948 908 522 265 186 176 286 *** *** *** *** 84 963 957 917 543 286 207 194 305 *** *** *** *** 88 969 969 929 562 307 229 215 324 *** *** *** *** 92 974 976 942 580 329 251 237 343 *** *** *** *** 96 979 997 954 596 350 273 258 362 *** *** *** *** 100 984 1023 970 611 370 293 278 380 *** *** *** *** 104 989 993 969 626 390 314 298 398 *** *** *** *** 108 994 976 960 638 409 333 317 415 *** *** *** *** 112 999 990 967 646 427 352 336 433 *** *** *** *** 116 1003 1004 977 656 445 370 354 449 *** *** *** *** 120 1007 1008 977 665 461 388 371 465 *** *** *** *** 124 1012 1013 983 675 477 405 389 481 *** *** *** *** 128 1016 1013 988 684 492 421 405 496 *** *** *** ***
*** = not measured or measurement not reliable Note: The test was terminated at 2 hours and 8 minutes
Table A.14: Axial deformations for Column SQ-11 Note: 1” = 25.4 mm Time Axial Deformation (min) (mm) 0 -0.04 2 1.17 4 5.39 6 8.89 8 11.29 10 13.36 12 14.98 14 15.86 16 16.08 18 14.76 20 10.07 22 6.84 24 5.14 26 3.83 28 2.80 30 2.02 32 1.34 34 0.58 36 -0.17 38 -0.84 40 -1.39 42 -1.89 44 -2.44 46 -2.94 48 -3.43 50 -3.89 52 -4.35 54 -4.78 56 -5.25 58 -5.74 60 -6.23 64 -7.31 68 -8.44 72 -9.59 76 -10.81 80 -12.15 84 -13.55 88 -15.07 92 -16.77
Table A.14: Axial deformations for Column SQ-11 (cont’d) Note: 1” = 25.4 mm Time Axial Deformation (min) (mm) 96 -18.62 100 -20.65 104 -22.83 108 -25.00 112 -27.17 116 -29.63 120 -32.18 124 -35.07 128 -38.44
Table A.15: Temperatures in concrete for Column SQ-14 Note: °F = (°C x 9/5) + 32 Time Std. Furn. Temp Avg. Furn. Temp
Temperatures (°C) at Thermocouple Number
(see Figure 8 for thermocouple locations)
(min) (°C) (°C) 1 2 3 4 5 6 7 8 9 10 0 20 62 22 20 20 20 23 20 20 20 20 39 2 426 455 12 34 23 20 23 20 20 22 22 175 4 533 578 *** 59 36 20 20 23 22 32 34 247 6 598 630 *** 80 49 20 15 29 28 49 52 311 8 645 655 *** 102 63 21 8 38 37 68 71 362 10 680 700 *** 107 77 24 *** 50 48 87 91 419 12 709 726 *** 129 90 27 *** 63 60 107 111 461 14 732 741 *** 149 105 31 *** 79 74 123 128 477 16 752 751 *** 168 121 35 *** 105 98 142 147 486 18 770 776 *** 189 136 41 *** 115 111 160 164 471 20 785 799 *** 209 151 47 *** 127 124 171 176 510 22 798 808 *** 212 154 53 *** 136 134 183 192 530 24 810 826 *** 229 163 60 *** 146 141 200 213 559 26 821 828 *** 248 178 67 *** 133 122 228 239 595 28 830 825 *** 266 192 73 *** 134 120 252 264 622 30 839 839 *** 284 205 79 *** 136 119 276 289 652 32 848 842 *** 301 218 86 *** 145 121 298 313 677 34 855 853 *** 318 231 93 *** 163 138 321 335 704 36 862 863 *** 335 244 100 *** 189 167 342 357 726 38 869 874 *** 351 258 108 *** 213 196 363 379 743 40 875 883 *** 368 271 116 *** 234 218 383 400 754 42 881 887 *** 384 283 124 *** 254 238 403 420 767 44 887 891 *** 400 295 131 *** 272 256 423 440 785 46 892 901 *** 415 309 138 *** 288 272 441 459 802 48 897 892 *** 431 324 143 *** 304 288 460 477 812 50 902 913 *** 447 339 147 *** 320 303 477 495 827 52 907 900 *** 462 354 151 *** 335 318 494 512 834 54 911 913 *** 478 369 155 *** 350 333 511 529 846
Table A.15: Temperatures in concrete for Column SQ-14 (cont'd) Note: °F = (°C x 9/5) + 32 Time Std. Furn. Temp Avg. Furn. Temp
Temperatures (°C) at Thermocouple Number
(see Figure 8 for thermocouple locations)
(min) (°C) (°C) 1 2 3 4 5 6 7 8 9 10 56 915 920 *** 493 383 158 *** 365 347 527 544 854 58 920 927 *** 507 397 162 *** 379 362 542 559 862 60 924 930 *** 521 411 165 *** 393 376 556 573 869 62 927 933 *** 535 424 168 *** 407 390 570 587 875 64 931 934 *** 547 437 171 *** 420 403 583 599 880 66 935 925 *** 560 449 176 *** 434 417 595 611 882 68 938 929 *** 571 461 183 *** 447 430 606 622 888 70 942 939 *** 583 473 192 *** 459 443 617 632 895 72 945 935 *** 594 484 203 *** 471 456 628 642 898 74 948 945 *** 604 495 214 *** 483 468 638 652 907 76 951 938 *** 614 506 225 *** 495 480 648 661 910 78 954 949 *** 624 517 237 *** 506 492 657 670 915 80 957 961 *** 634 529 249 *** 517 503 666 678 922 82 960 959 *** 643 539 261 *** 527 513 674 686 924 84 963 959 *** 652 551 274 *** 538 524 682 694 928 86 966 967 *** 661 561 286 *** 547 534 690 701 933 88 969 972 *** 669 572 300 *** 557 544 697 708 938
*** = not measured or measurement not reliable Note: The test was terminated at 1 hour and 29 minutes
Table A.16: Axial deformations for Column SQ-14 Note: 1” = 25.4 mm Time Axial Deformation (min) (mm) 0 0.00 2 0.95 4 2.97 6 5.08 8 7.65 10 9.99 12 10.88 14 11.04 16 10.06 18 5.01 20 3.56 22 2.85 24 2.28 26 1.67 28 1.05 30 0.48 32 -0.18 34 -0.85 36 -1.57 38 -2.22 40 -2.80 42 -3.35 44 -3.88 46 -4.36 48 -4.88 50 -5.35 52 -5.85 54 -6.41 56 -6.97 58 -7.56 60 -8.16 62 -8.83 64 -9.51 66 -10.20 68 -10.92 70 -11.68 72 -12.47 74 -13.11 76 -13.91
Table A.16: Axial deformations for Column SQ-14 (cont’d) Note: 1” = 25.4 mm Time Axial Deformation (min) (mm) 78 -14.76 80 -15.68 82 -16.74 84 -18.00 86 -19.49 88 -21.81
Fig. A.1: Temperatures and Axial Deformations for Column C-36 Time (min) 0 20 40 60 80 100 120 140 160 180 200 T em p er atur e ( °C) 0 200 400 600 800 1000 1200 Std. Furn. Temp Thermocouple No. 1 Thermocouple No. 2 Thermocouple No. 3 Thermocouple No. 4 Thermocouple No. 5 Time (min) 0 20 40 60 80 100 120 140 160 180 200 A xia l D e fo rm a tio n ( m m ) -50 -40 -30 -20 -10 0 10 20
Fig. A.2: Temperatures and Axial Deformations for Column C-46 Time (min) 0 10 20 30 40 50 60 T em per at ur e ( °C) 0 200 400 600 800 1000 1200 Std. Furn. Temp Thermocouple No. 2 Thermocouple No. 3 Thermocouple No. 4 Thermocouple No. 5 Thermocouple No. 8 Time (min) 0 10 20 30 40 50 60 A xia l D e fo rm a tio n ( m m ) -30 -20 -10 0 10 20
Fig. A.3: Temperatures and Axial Deformations for Column C-47 Time (min) 0 10 20 30 40 50 60 T em p er atur e ( °C) 0 200 400 600 800 1000 1200 Std. Furn. Temp Thermocouple No. 1 Thermocouple No. 2 Thermocouple No. 3 Thermocouple No. 4 Thermocouple No. 5 Thermocouple No. 6 Time (min) 0 10 20 30 40 50 60 A xia l D e fo rm a tio n ( m m ) -50 -40 -30 -20 -10 0 10 20
Fig. A.4: Temperatures and Axial Deformations for Column C-62 Time (min) 0 10 20 30 40 50 T em p er atur e ( °C) 0 200 400 600 800 1000 1200 Std. Furn. Temp Thermocouple No. 1 Thermocouple No. 2 Thermocouple No. 3 Thermocouple No. 4 Thermocouple No. 5 Thermocouple No. 6 Thermocouple No. 7 Thermocouple No. 8 Thermocouple No. 9 Thermocouple No. 10 Time (min) 0 10 20 30 40 50 A xia l D e fo rm a tio n ( m m ) -50 -40 -30 -20 -10 0 10
Fig. A.5: Temperatures and Axial Deformations for Column C-69 Time (min) 0 50 100 150 200 250 300 T em per at ur e ( °C) 0 200 400 600 800 1000 1200 Std. Furn. Temp Thermocouple No. 1 Thermocouple No. 2 Thermocouple No. 3 Thermocouple No. 4 Thermocouple No. 5 Thermocouple No. 6 Time (min) 0 50 100 150 200 250 300 A xia l D e fo rm a tio n ( m m ) -30 -25 -20 -15 -10 -5 0 5
Fig. A.6: Temperatures and Axial Deformations for Column C-70 Time (min) 0 20 40 60 80 T em p er atur e ( °C) 0 200 400 600 800 1000 1200 Std. Furn. Temp Thermocouple No. 1 Thermocouple No. 2 Thermocouple No. 3 Thermocouple No. 4 Thermocouple No. 5 Thermocouple No. 6 Thermocouple No. 7 Thermocouple No. 8 Thermocouple No. 9 Thermocouple No. 10 Time (min) 0 20 40 60 80 A xia l D e fo rm a tio n ( m m ) -35 -30 -25 -20 -15 -10 -5 0 5
Fig. A.7: Temperatures and Axial Deformations for Column SQ-11 Time (min) 0 20 40 60 80 100 120 140 T em per at ur e ( °C) 0 200 400 600 800 1000 1200 Std. Furn. Temp Thermocouple No. 1 Thermocouple No. 2 Thermocouple No. 3 Thermocouple No. 4 Thermocouple No. 5 Thermocouple No. 6 Time (min) 0 20 40 60 80 100 120 140 A xia l D e fo rm a tio n ( m m ) -50 -40 -30 -20 -10 0 10 20
Fig. A.8: Temperatures and Axial Deformations for Column SQ-14 Time (min) 0 20 40 60 80 100 T em per at ur e ( °C) 0 200 400 600 800 1000 1200 Std. Furn. Temp Thermocouple No. 2 Thermocouple No. 3 Thermocouple No. 4 Thermocouple No. 6 Thermocouple No. 7 Thermocouple No. 8 Thermocouple No. 9 Thermocouple No. 10 Time (min) 0 20 40 60 80 100 A xia l D e fo rm a tio n ( m m ) -40 -30 -20 -10 0 10 20
APPENDIX B
VIEW OF COLUMN SPECIMENS AFTER FIRE TEST
List of Figures
Fig. B.1 View of Column C-36 after Fire Endurance Test Fig. B.2 View of Column C-46 after Fire Endurance Test Fig. B.3 View of Column C-47 after Fire Endurance Test Fig. B.4 View of Column C-62 after Fire Endurance Test Fig. B.5 View of Column C-69 after Fire Endurance Test Fig. B.6 View of Column C-70 after Fire Endurance Test Fig. B.7 View of Column SQ-11 after Fire Endurance Test Fig. B.8 View of Column SQ-14 after Fire Endurance Test