Publisher’s version / Version de l'éditeur:
Vous avez des questions? Nous pouvons vous aider. Pour communiquer directement avec un auteur, consultez la première page de la revue dans laquelle son article a été publié afin de trouver ses coordonnées. Si vous n’arrivez pas à les repérer, communiquez avec nous à PublicationsArchive-ArchivesPublications@nrc-cnrc.gc.ca.
Questions? Contact the NRC Publications Archive team at
PublicationsArchive-ArchivesPublications@nrc-cnrc.gc.ca. If you wish to email the authors directly, please see the first page of the publication for their contact information.
https://publications-cnrc.canada.ca/fra/droits
L’accès à ce site Web et l’utilisation de son contenu sont assujettis aux conditions présentées dans le site LISEZ CES CONDITIONS ATTENTIVEMENT AVANT D’UTILISER CE SITE WEB.
12th Symposium for Building Physics [Proceedings], pp. 1-9, 2007-03-29
READ THESE TERMS AND CONDITIONS CAREFULLY BEFORE USING THIS WEBSITE.
https://nrc-publications.canada.ca/eng/copyright
NRC Publications Archive Record / Notice des Archives des publications du CNRC :
https://nrc-publications.canada.ca/eng/view/object/?id=b06f36a8-dca0-42ab-b6df-ac6b2763e6e1 https://publications-cnrc.canada.ca/fra/voir/objet/?id=b06f36a8-dca0-42ab-b6df-ac6b2763e6e1
NRC Publications Archive
Archives des publications du CNRC
This publication could be one of several versions: author’s original, accepted manuscript or the publisher’s version. / La version de cette publication peut être l’une des suivantes : la version prépublication de l’auteur, la version acceptée du manuscrit ou la version de l’éditeur.
Access and use of this website and the material on it are subject to the Terms and Conditions set forth at
Method to determine the dynamic thermal resistance of compressed air foam
http://irc.nrc-cnrc.gc.ca
M e t h o d t o d e t e r m i n e t h e d y n a m i c t h e r m a l
r e s i s t a n c e o f c o m p r e s s e d a i r f o a m
N R C C - 4 9 2 2 2
M a r e f , W . ; O ’ C o n n o r , T . ; E l m a h d y , A . H . ;
S w i n t o n , M .
A version of this document is published in / Une version de ce document se trouve dans: 12th Symposium for Building Physics, Dresden, Germany, March 29-31, 2007, pp. 1-9
The material in this document is covered by the provisions of the Copyright Act, by Canadian laws, policies, regulations and international agreements. Such provisions serve to identify the information source and, in specific instances, to prohibit reproduction of materials without
written permission. For more information visit http://laws.justice.gc.ca/en/showtdm/cs/C-42
Les renseignements dans ce document sont protégés par la Loi sur le droit d'auteur, par les lois, les politiques et les règlements du Canada et des accords internationaux. Ces dispositions permettent d'identifier la source de l'information et, dans certains cas, d'interdire la copie de
Method to determine the dynamic thermal resistance of compressed
air foam
W. Maref, T. O’Connor, A.H. Elmahdy, M. Swinton Institute for Research In Construction,
National Research Council Canada
wahid.maref@nrc-cnrc.gc.ca
ABSTRACT
Compressed air foams have been developed in recent years for a number of uses, including fire suppression and dynamic insulation for transparent or translucent enclosures. In its thermal insulation role, the product has been developed to be deployed at night and removed during the daytime, to maximize the use of daylight for greenhouse applications while potentially reducing heat loss at night. Standard test methods for the thermal resistance of products are currently based on the assumption that the thermal resistance of the material is constant over the duration of the test – an assumption that cannot be made with compressed air foams. A manufacturer of such foams approached the Institute for Research in Construction (IRC) to develop a technique to evaluate the dynamic thermal resistance of foams that are intended to be deployed on a temporary basis over a fraction of a day. As a result, IRC entered into an experimental program to develop an appropriate method for determining the thermal resistance of dynamic foam insulation under controlled laboratory conditions. This was done by building a special wall specimen to house the foam insulation, making provisions for foaming of the wall specimen during the test, deploying instrumentation in such a way as to capture the dynamic behaviour of the foam, while shedding some understanding of the spatial variations in the delivered foam insulation. The resulting method is an adaptation of a standard ASTM test method for Guarded Hot Box testing, modified to derive a time-integrated thermal resistance over a specified test period. This project resulted in the development of a test protocol to determine the apparent thermal resistance of dynamic foam material. In addition to applying the technique to the manufacturer’s proprietary foams, the method was applied to proprietary compressed air foam developed by IRC for other purposes, to assess the dynamic thermal properties of that foam. The results of the latter are reported in this paper.
INTRODUCTION
The quest for effective insulating techniques for greenhouses has spanned the better part of three decades in Canada. The main challenge for innovators in the field is that insulation techniques need to be either transparent or moveable, to maximize insulation at night and maximize available solar radiation during the day, needed for superior plant growth. An early example of a system designed for this application consisted of the use of polystyrene beads aerodynamically entrained to be collected between 2 sheets of polyethylene that formed the envelope of the greenhouse. The beads would then be entrained back into a storage area during the day. This approach had to be abandoned, when failure (bursting) of the polyethylene envelope resulted in a local environmental disaster involving the scattering of beads to the surrounding areas, in such
quantities that defied proper cleanup. A more recent innovation has emerged along these lines involving the site manufacturing of a temporary layer of surfactant-based foam between the translucent layers of a greenhouse envelope. The temporary surfactant foam is intended to collapse back into liquid form and can be collected and re-used.
Researchers of the Institute for Research in Construction (IRC) were asked by the proponents of such a system, to develop a technique to measure the R-value of such an insulation system, knowing that the R-value would likely vary with time. Existing R-value measurement standards are designed for steady state measurement, which would not apply for this product. This project consisted of developing a measurement technique to determine the dynamic thermal resistance value of surfactant-based foam insulation under controlled laboratory conditions. For the purposes of this paper, the technique developed is documented here, but an alternative foam product was used to illustrate the measurement technique. This was done to protect the proprietary interests of the foam developer. The in-house surfactant-based foam product, originally developed for fire suppression purposes, was tested as a thermal resistant barrier and as a part of a wall system devised, built and evaluated in the IRC Guarded Hot Box under non-standard conditions.
The challenges facing the researchers were significant and complex in nature. The fact that there is no an ASTM standard test method to deal with foam insulation similar to the present case, the researchers had to resort to a real time data processing technique followed by an averaging scheme to arrive at an acceptable apparent R- value of the material under investigation.
CHALLENGES
Building science researchers and practitioners who work closely with Guarded Hot Box to determine the thermal properties of insulating material are familiar with the conditions under which the steady state is achieved. The specimen usually separates two environments (e.g., room side and weather side) and is uniform in thickness. In this project, the skin of the cavity (9.5 mm thick Lexan sheathing) was bulging under the hydrostatic pressure of the foam. This resulted in a “non-uniform” thickness of the sample. As a result, wall reinforcement had to be used to promote uniformity of wall thickness. As the cavity is being filled with foam, there has been a two-phase heat transfer that resulted in condensate running down to the collecting trough. There had to be continuous foam make up during the test until the cavity is full.
Finally, the traditional Guarded Hot Box practices had to change to accommodate the filling of the cavity with foam, collection of condensate, purging of foam after the test and many changes to data collection and processing, as will be illustrated in the rest of the paper.
OBJECTIVE
The objective of this project was to develop a test procedure to determine the dynamic thermal resistance of compressed air foam through laboratory measurements and calculations.
A second objective was to try-out the procedure using a number of proprietary foams. The one reported in this paper is a compressed air foam (CAF) - a proprietary product originally developed for fire suppression by the Institute for Research in Construction, National Research Council Canada.
TEST SET UP
The test wall was a 2.46 m X 2.46 m perimeter frame built of pine 50 mm X 150 mm (2”X6”) members (Fig. 1). The room and weather side skins were of 9.5 mm thick Lexan sheathing clad over the perimeter frame. A sloped collection trough was built and installed at the bottom of the wall in order to drain the foam condensate during testing. The compressed air foam (CAF) generating mechanism provided by IRC was set up beside the guarded box (Fig 2) and its discharge hose was fed through the top and center of the wall cavity (Fig. 3). A water spray bar fitted with diffuser nozzles was mounted inside along the top of the test wall. Its purpose was to provide for foam wash out after the completion of tests. Due to the substantial hydrostatic pressure (and resulting wall bulge) created by the foam in the wall, three cables were horizontally mounted on both sides of the wall and tensioned (Fig. 6). Foam condensate drainage was achieved by providing a 25 mm diameter drain bored in the bottom of the test wall. A 25 mm diameter garden hose was used to direct the condensate to a weighed collection tank. The discharging end tip of the collection hose was fitted with a Type T thermocouple, which was used to measure the condensate temperature as it flowed into the collection tank. A 25 mm diameter vent pipe was installed at the top center of the test wall, its purpose was to vent out any excess pressure generated by the operation of the foaming mechanism (Fig. 5). The condensate was drained from the room side of the test wall and collected in a weighed tank set up outside of the guarded box (Fig. 4).
Figure 1: Instrumented test wall Figure 2: Pressurized surfactant delivery system
Figure 5: Foam inlet, relief vent & spray bar Figure 6: Reinforcing cables and turnbuckles
Figure 7 shows the CAF foaming mechanism in the Guarded Hot Box.
Figure 7 Schematic Diagram of Foaming and Test Apparatus
Pressurized Surfactant Tank (100 L)
Wall Specimen
Guarded Box Perimeter
Frame Atomizing System Supply
Gauge, Regulator and Foaming Mechanism Air
Supply
Condensate Collection and Weighing System
TEST PROCEDURE
The principal test method for determining the thermal performance of walls is ASTM C-1363 Standard. In view of maintaining test repeatability during this project, a specific test protocol was developed by IRC. Electronic data collection took place every minute. This provided 180 data points for use in the thermal evaluation of the foam. Given the dynamic nature of the foam during the testing period, it was postulated that evaluating it under steady state conditions might be an experimental challenge. Therefore, an additional data collecting method was devised and executed in concurrence with the standard method of affixing wall surface thermocouples and using the constant temperature calorimeter. Foam condensate was collected, weighed and its temperature measured at minute intervals during testing. Also were measured at fifteen-minute intervals the wall cavity discharge air temperatures.
1 Preparing the Guarded Box
Guarded Box to be set running with a roomside temperature of 20 °C and a weatherside temperature of –18 °C. Facility steady state should be achieved within 12 hours of start up: Steady state is defined as facility operating with steady temperatures ± 0.1 °C on both room and weather sides.
Given the low thermal resistance of the unfilled cavity wall, several actions must be undertaken to arrest heat transfer across the specimen and to increase heat supply on the roomside. To these ends, the weatherside of the specimen should be clad with 3” polystyrene insulation boards in order to slow heat loss and the roomside calorimeter should be supplied with auxiliary heat. A 1500-Watt heater placed against the intake of a small ventilating blower would suffice. The output of the blower should be routed to the calorimeter by means of a small flexible hose placed into to the round opening at the back of the calorimeter. It would also be advisable to set the calorimeter heat, on manual mode, to 90% of full power, which is in the order of about 135 Watts. Setting the calorimeter to full power can lead to its tripping out on overload protection.
The surfactant submitted by IRC was identified as CAF and had a referenced nomenclature as Silvex-Ex Class A Fire Control Concentrate. The measured density at test time was 22.4 kg/m3. This surfactant should be mixed with tap water at a ratio of 96 % water and 4 % surfactant.
2 Pre test wall filling
Once it has been observed that the guarded box has achieved steady state, the filling of the wall with foamed surfactant can begin. The foam is generated by means of mixing high-pressure air and pre mixed surfactant through a foaming mechanism supplied by IRC. As recommended by IRC, the air pressure supplied to the foaming mechanism should be set to about 100 psi. The surfactant supply is regulated through a two-way valve. Once the foaming begins, the time should be noted and the data acquisition system started. A decision by the experimenter will be made as to when the wall is full and is ready for testing. The experimenter will make every effort to ensure that the wall is filled. A small observation port cut through the top middle polystyrene board on the weatherside will allow the experimenter to observe the filling process. The wall will be deemed full when the experimenter removes the insulation boards on the weather side and visually observes the wall. The removal time of the boards should be recorded.
It should also be noted that foam condensate will be collected during the pre test filling. By sitting a 20-litre carboy on a scale and placing a thermocouple in the condensate mass collection and temperature will be recorded by the experimenter at fifteen-minute intervals. The experimenter will also place a thermocouple at the wall vent at the top of the wall on the roomside and note the exiting wall cavity air temperature at fifteen-minute intervals.
3 Wall Testing
Once the conditions of parts 1 and 2 described above are met, the actual testing can begin. The data acquisition system should be started and the time recorded. The test should be allowed to run at least three hours from start to finish.
• The experimenter is to ensure sure that the wall is full: The experimenter will top up the wall with foam every 30 minutes for a ten-minute period, if necessary. • The experimenter will note the mass and temperature of the collecting condensate
every 15 minutes
• The experimenter will note the wall cavity exiting air temperature at the top exit vent of the wall vent every 15 minutes.
4.Post Test Shutdown
Once the three-hour test is complete the Guarded Hot box should be shut down. Once the weatherside has achieved room temperature, the wash out of the remaining foam was performed. The particular foam reported in this experiment was ‘tenacious’ and required considerable washout. This would make recycling of the surfactant difficult, as it would be diluted by the water used for washout. As a result, this particular foam is not considered ideal for an application that would require total removal through washing, in preparation for the next sunny day.
INSTRUMENTATION
Twenty Type T (copper-constantan) thermocouples were mounted on the respective weather and room side surfaces in an area weighed layout. From these measured and collected thermocouple readings the average surface temperatures were calculated for both sides of the test wall.
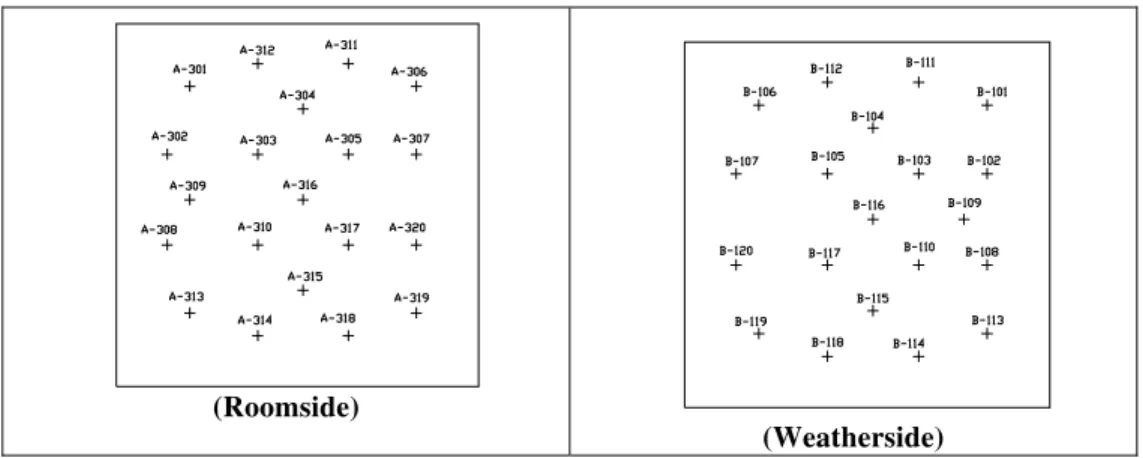
(Roomside)
(Weatherside) Figure 8: Thermocouple layout on both room and weatherside surfaces
Figure 8 is a schematic showing thermocouple locations of the test wall. On the roomside, A-301 though A-320 denotes the area weighed thermocouple layout. On the weatherside, B-101 though B-120 denotes the area weighed thermocouple locations.
Test Results
Thermal Resistance
Guarded Hot Box operating stability is defined as being the condition at which temperature and thermal stability (calorimeter heat and guard steady state) is achieved. This condition was reached at seventy-three minutes into the test run. Therefore test data analysis begins at this time and is referenced as time zero
Figure 9 shows the dynamic thermal resistance of the foam during the three-hour test. The gray plot shows the real time thermal resistance calculated every minute over the three-hour test period. The initial thermal resistance is about 1.6 RSI (m2 K/W) (R-9 ft2* h* ° F/ BTU) and slowly peaks at about 3.31 RSI (m2 K/W) (R –19 ft2* h* ° F/ BTU) at one hundred and eighty minutes. The cumulative average is shown on the black plot. It is the calculated integral of the real time plot with respect to total test time. The cumulative average is 1.94 RSI (m2 K/W) (R-11 ft2* h* ° F/ BTU). Given that the thermal resistance showed a steady increase during the three-hour test period, the experimenter decided to let the test continue for another nine-hours for a total test time of twelve hours. Figure 10 shows the dynamic thermal resistance of the foam during the twelve-hour test. The gray plot shows the real time thermal resistance calculated every minute over the three-hour test period. The initial thermal resistance is about 1.39 RSI (m2 K/W) (R-8 ft2* h* ° F/ BTU) and slowly peaks at about 6.38 RSI (m2 K/W) (R –36 ft2* h* ° F/ BTU) at three hundred and seventy three minutes. The thermal resistance then decreases in a symmetrical manner until reaching a final value of 1.63 RSI (m2 K/W) (R-9 ft2* h* ° F/ BTU) at six hundred and forty seven minutes. The cumulative average is plotted in black.
Figure 9: Wall thermal resistance plots (real time and cumulative) for CAF Surfactant Foam over a three hour test period
Figure 10: Wall thermal resistance plots (real time and cumulative) for CAF Surfactant Foam over a six hundred and forty seven minute test period.
Mass Flow and Thermal Balance
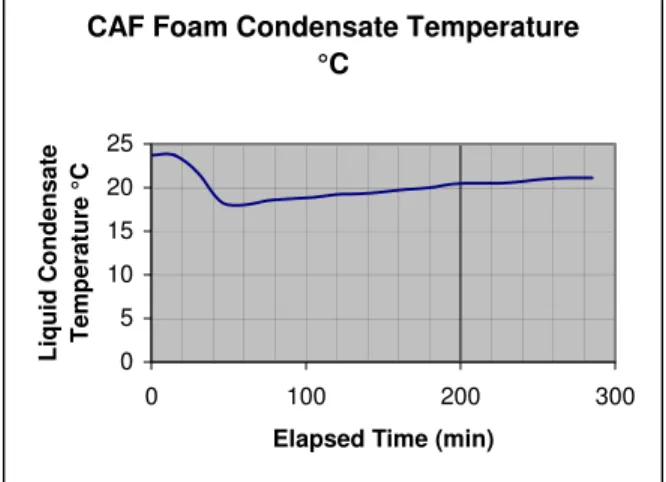
Figure 11 shows the condensate collection plot for the CAF Surfactant Foam. Figure 12 shows the concurrent condensate temperature plot. Figure 13 shows the concurrent wall venting temperature.
The thermal balance of the CAF wall system is defined as the ratio of energy lost through the flowing condensate, over the total energy supplied during the flowing time of the condensate, within the total test period of three hours. The ratio of energy lost through the condensate flowing through the test wall was calculated by:
T Cp m
Q= . Δ (1)
Where Q = heat flow (W)
m= mass flow of condensate through system (Kg/s)
Cp= Specific heat of the surfactant foam (4180 J/Kg °C @ 20 °C)*
Δ T= Difference in inlet temperature of foam and outlet temperature of condensate°C
Wall Thermal resistance Rw
0 1 2 3 4 5 6 7 8 0 100 200 300 400 500 600 700 Time (minutes)
Wall Thermal Resistance RSI
(m2.K / W ) Rw Rw cum CAF 2.38
Wall Thermal Resistance Rw
0 1 2 3 4 5 0 50 100 150 Time (minutes) Wall Therm al Resistance RSI (m2 K / W) CAF 1.94 Rw Rw cum
The total energy passed in the condensate over the three-hour test period was calculated by: ) ( . totalt Q E= (2) Q= heat flow (W)
t(total)= Condensate flow period within three hour test period (seconds)
The total heat collected through the condensate was 5.58 X 10⁴ Joules. The total heat supplied to the calorimeter during the same period was 2.13 X 10⁸ Joules. Therefore the percentage of heat lost through the condensate as a percentage of total heat supplied was 0.026 %, which is negligible.
Observations
The time required to fill the wall using this mixture was 7 minutes. The foam generator performed well and the wall filled in a uniform manner. The condensate started to flow at about 30 minutes after the start of foaming and not in any significant quantity. Figure 11 shows the condensate mass flow vs. time. Over the seventy-three minute filling stabilizing period and the one hundred and eighty minute test period, about 3.7 Kg. of condensate was collected. Figure 12 shows the temperature of the exiting condensate. At first the condensate temperature is about 23.5 °C. At the start of testing the condensate was not yet flowing and the thermocouple measured the ambient lab air temperature. As the condensate started to flow out of the collection tube, the measured temperature then began to drop, eventually to a minimum of 18.0 °C before increasing to 21.6 °C. The ambient lab air temperature seemed to influence the condensate temperature reading. Once the three-hour test was complete, the guarded box was left operating overnight because the experimenter observed that the thermal resistance was still increasing. The next morning a good portion of foam still remained in the wall: Another 4 kg of condensate had collected overnight for a total of about 7Kg. The resulting shape of the R-Value curve of the foam was quit unexpected both in symmetry and apparent peak R-Value achieved. Factors contributing to these characteristics need to be explored in more details.1
CAF Foam Condensate Collection
0 1000 2000 3000 4000 0 100 200 300
Elapsed Tim e (m in)
Collected Condensate
(grams)
Figure 11: Foam condensate collection plot for CAF Surfactant Foam over a four-hour period.
CAF Foam Condensate Temperature °C 0 5 10 15 20 25 0 100 200 300
Elapsed Time (min) Liquid Condensate Temperat
ure °
C
Figure 12: Foam condensate temperature plot for CAF Surfactant Foam over a four-hour period.
CAF Foam Venting Air Temperature °C 17 17.5 18 18.5 0 100 200 300
Elapsed Time (min)
Air Temperature °C
Figure 13: Venting air temperature plot for CAF Foam over a four-hour period.
Concluding remarks
A test procedure to determine the dynamic thermal resistance of compressed air foam was successfully developed and documented in this paper. The procedure was tried on a compressed air foam (CAF) - a proprietary foam originally developed for fire suppression by the institute for Research in Construction. The foam was used in this application to try out the technique.
A number of observations were made about the performance of the particular compressed air foam used in this experiment:
• The thermal resistance of surfactant-based temporary foam was shown to increase and then decrease in a symmetrical manner over a twelve-hour period.
• The thermal resistance of this foam peaked at a value of 6.38 (K m2
/W) (R-36) at 4.3 hours into the twelve-hour test run.
• Water spray washout was required, as the foam would not quickly degrade. This washout process was difficult in that the spray seemed to re- agitate the foam.
• The washed out foam had to be discarded due to the fact that its surfactant concentration was altered. This is a particular limitation of this foam, making it less suitable in its present form for the intended application.
The originally specified duration of the test protocol was 3 hours, which was developed before testing. This work has shown that the foam R-value changes with time, and can peak some time after the wall is filled and foaming stops. Longer test periods should thus be considered as a possible refinement to the protocol in future tests.
Reference
ASTM C-1363, Standard Test Method for Thermal Performance of Building Materials and Envelope Assemblies by Means of Hot Box Apparatus.