Publisher’s version / Version de l'éditeur:
Vous avez des questions? Nous pouvons vous aider. Pour communiquer directement avec un auteur, consultez la
première page de la revue dans laquelle son article a été publié afin de trouver ses coordonnées. Si vous n’arrivez pas à les repérer, communiquez avec nous à [email protected].
Questions? Contact the NRC Publications Archive team at
[email protected]. If you wish to email the authors directly, please see the first page of the publication for their contact information.
https://publications-cnrc.canada.ca/fra/droits
L’accès à ce site Web et l’utilisation de son contenu sont assujettis aux conditions présentées dans le site LISEZ CES CONDITIONS ATTENTIVEMENT AVANT D’UTILISER CE SITE WEB.
Encyclopedia of Data Warehousing and Mining (2nd Edition), 4, pp. 2056-2061, 2009
READ THESE TERMS AND CONDITIONS CAREFULLY BEFORE USING THIS WEBSITE.
https://nrc-publications.canada.ca/eng/copyright
NRC Publications Archive Record / Notice des Archives des publications du CNRC : https://nrc-publications.canada.ca/eng/view/object/?id=ed285602-1433-4bd0-b4c8-c67426c06f4c https://publications-cnrc.canada.ca/fra/voir/objet/?id=ed285602-1433-4bd0-b4c8-c67426c06f4c
NRC Publications Archive
Archives des publications du CNRC
Access and use of this website and the material on it are subject to the Terms and Conditions set forth at Visual data mining from visualization to visual information mining Viktor, Herna L.; Paquet, Eric
National Research Council Canada Institute for Information Technology Conseil national de recherches Canada Institut de technologie de l'information
Visual Data Mining: From Visualization to
Visual Information Mining *
Viktor, H.L., Paquet, E. 2008
* published in the Encyclopedia of Data Warehousing and Mining (2nd Edition). 2008. NRC 49882.
Copyright 2008 by
National Research Council of Canada
Permission is granted to quote short excerpts and to reproduce figures and tables from this report, provided that the source of such material is fully acknowledged.
Keyword: Visual Data Mining
Visual Data Mining from Visualization to Visual Information Mining
Dr. Herna L Viktor*
School of Information Technology and Engineering, 800 King Edward Avenue (room 5-060),
P.O. Box 450, Stn. A, Ottawa, Ontario K1N 6N5 Canada Voice: +1 613 562 5800 x2341 Fax: +1 613 562 5664 E-mail: [email protected] Dr. Eric Paquet 2
Visual Information Technology, National Research Council of Canada, Montreal Road, Building M-50,
Ottawa, Ontario, K1A 0R6 Canada
Voice: +1 613 991 5035 Fax: +1 613 952 0215
E-mail: [email protected] (* Corresponding author)
Visual Data Mining from Visualization to Visual Information Mining
Herna L Viktor, University of Ottawa, Canada Eric Paquet, National Research Council, Canada
INTRODUCTION
The current explosion of data and information, which are mainly caused by the continuous adoption of data warehouses and the extensive use of the Internet and its related technologies, has increased the urgent need for the development of techniques for intelligent data analysis. Data mining, which concerns the discovery and extraction of knowledge chunks from large data repositories, addresses this need. Data mining automates the discovery of hidden patterns and relationships that may not always be obvious. Data mining tools include classification techniques (such as decision trees, rule induction programs and neural networks) (Kou et al., 2007); clustering algorithms and association rule approaches, amongst others.
Data mining has been fruitfully used in many of domains, including marketing, medicine, finance, engineering and bioinformatics. There still are, however, a number of factors that militate against the widespread adoption and use of this new technology. This is mainly due to the fact that the results of many data mining techniques are often difficult to understand. For example, the results of a data mining effort producing 300 pages of rules will be difficult to analyze. The visual representation of the knowledge embedded in such rules will help to heighten the comprehensibility of the results. The visualization of the data itself, as well as the data mining process should go a long way towards increasing the user's understanding of and faith in the data mining process. That is, data and information visualization provide users with the ability to obtain new insights into the knowledge, as discovered from large repositories.
This paper describes a number of important visual data mining issues and introduces techniques employed to improve the understandability of the results of data mining. Firstly, the visualization of data prior to, and during, data mining is addressed. Through data visualization, the quality of the data can be assessed throughout the knowledge discovery process, which includes data preprocessing, data mining and reporting. We also discuss information visualization, i.e. how the knowledge, as discovered by a data mining tool, may be visualized throughout the data mining process. This aspect includes visualization of the results of data mining as well as the learning process. In addition, the paper shows how virtual reality and collaborative virtual environments may be used to obtain an immersive perspective of the data and the data mining process as well as how visual data mining can be used to directly mine functionality with specific applications in the emerging field of proteomics.
BACKGROUND
Human beings intuitively search for novel features, patterns, trends, outliers and relationships in data (Han and Kamber, 2006). Through visualizing the data and the concept descriptions obtained (e.g. in the form of rules), a qualitative overview of large and complex data sets can be obtained. In addition, data and rule visualization can assist in identifying regions of interest and appropriate parameters for more focused quantitative analysis. The user can thus get a "rough feeling" of the quality of the data, in terms of its correctness, adequacy, completeness, relevance, etc. The use of data and rule visualization thus greatly expands the range of models that can be understood by the user, thereby easing the so-called "accuracy versus understandability" tradeoff (Valdes and Barton, 2007).
Data mining techniques construct a model of the data through repetitive calculation to find statistically significant relationships within the data. However, the human visual perception system
can detect patterns within the data that are unknown to a data mining tool. This combination of the various strengths of the human visual system and data mining tools may subsequently lead to the discovery of novel insights and the improvement of the human’s perspective of the problem at hand. Visual data mining harnesses the power of the human vision system, making it an effective tool to comprehend data distribution, patterns, clusters and outliers in data (Blanchard et al., 2007).
Visual data mining is currently an active area of research. Examples of related commercial data mining packages include the MultiMediaMiner data mining system, See5 which forms part of the RuleQuest suite of data mining tools, Clementine developed by Integral Solutions Ltd (ISL),
Enterprise Miner developed by SAS Institute, Intelligent Miner produced by IBM, and various
other tools. Neural network tools such as NeuroSolutions and SNNS and Bayesian network tools including Hugin, TETRAD, and Bayesware Discoverer, also incorporates extensive visualization facilities. Examples of related research projects and visualization approaches include MLC++,
WEKA, AlgorithmMatrix, C4.5/See5 and NCBI GEO amongst others (Barret et al., 2007).
Visual data mining integrates data visualization and data mining and is closely related to computer graphics, multimedia systems, human computer interfaces, pattern recognition and high performance computing.
DATA AND INFORMATION VISUALIZATION Data Visualization
Data visualization provides a powerful mechanism to aid the user during both data preprocessing and the actual data mining. Through the visualization of the original data, the user can browse to get a “feel” for the properties of that data. For example, large samples can be visualized and analyzed (Barret et al., 2007). In particular, visualization may be used for outlier detection, which highlights surprises in the data, i.e. data instances that do not comply with the
general behavior or model of the data (Sun et al., 2007). In addition, the user is aided in selecting the appropriate data through a visual interface. Data transformation is an important data preprocessing step. During data transformation, visualizing the data can help the user to ensure the correctness of the transformation. That is, the user may determine whether the two views (original versus transformed) of the data are equivalent. Visualization may also be used to assist users when integrating data sources, assisting them to see relationships within the different formats.
Data visualization techniques are classified in respect of three aspects. Firstly, their focus, i.e. symbolic versus geometric; secondly their stimulus (2D versus 3D); and lastly, their display (static or dynamic). In addition, data in a data repository can be viewed as different levels of granularity or abstraction, or as different combinations of attributes or dimensions. The data can be presented in various visual formats, including box plots, scatter plots, 3D-cubes, data distribution charts, curves, volume visualization, surfaces or link graphs, amongst others (Gardia-Osorio and Fyfe, 2008).
For instance, 3D-cubes are used in relationship diagrams, where the data are compared as totals of different categories. In surface charts, the data points are visualized by drawing a line between them. The area defined by the line, together with the lower portion of the chart, is subsequently filled. Link or line graphs display the relationships between data points through fitting a connecting line (Guo et al., 2007). They are normally used for 2D data where the X value is not repeated.
Advanced visualization techniques may greatly expand the range of models that can be understood by domain experts, thereby easing the so-called accuracy-versus-understandability trade-off. However, due to the so-called "curse of dimensionality", which refers to the problems associated with working with numerous dimensions, highly accurate models are usually less understandable, and vice versa. In a data mining system, the aim of data visualization is to obtain an
initial understanding of the data and the quality thereof. The actual accurate assessment of the data and the discovery of new knowledge are the tasks of the data mining tools. Therefore, the visual display should preferably be highly understandable, possibly at the cost of accuracy.
The use of one or more of the above-mentioned data visualization techniques thus helps the user to obtain an initial model of the data, in order to detect possible outliers and to obtain an intuitive assessment of the quality of the data used for data mining. The visualization of the data mining process and results is discussed next.
Information Visualization
It is crucial to be aware of what users require for exploring data sets, small and large. The driving force behind visualizing data mining models can be broken down into two key areas, namely understanding and trust. Understanding means more than just comprehension; it also involves context. If the user can understand what has been discovered in the context of the business issue, he will trust the data and the underlying model and thus put it to use. Visualizing a model also allows a user to discuss and explain the logic behind the model to others. In this way, the overall trust in the model increases and subsequent actions taken as a result are justifiable (Blanchard et al., 2007). Visualization thus aids us to determine whether the data mining process is of high economic utility, i.e. it is adding value especially when considering large-scale real-world data mining projects (Hilderman, 2006).
The art of information visualization can be seen as the combination of three well defined and understood disciplines, namely cognitive science, graphics art and information graphics. A number of important factors have to be kept in mind when visualizing both the execution of the data mining algorithm (process visualization), e.g. the construction of a decision tree, and displaying the results thereof (result visualization). The visualization approach should provide an easy understanding of
the domain knowledge, explore visual parameters and produce useful outputs. Salient features should be encoded graphically and the interactive process should prove useful to the user (Jankun-Kelly et al., 2007).
The format of knowledge extracted during the mining process depends on the type of data mining task and its complexity. Examples include classification rules, association rules, temporal sequences, casual graphs and tail trees (Klemela, 2007). Visualization of these data mining results involves the presentation of the results or knowledge obtained from data mining in visual forms, such as decision trees, association rules, clusters, outliers and generalized rules (Hruschka et al., 2007). For example, the Silicon Graphics (SGI) MineSet (MLC++) and the Blue Martini Software toolsets use connectivity diagrams to visualize decision trees, and simple Bayesian and decision table classifiers (Erbacher and Teerling, 2006). Other examples include the Iris Explorer system that offers techniques ranging from simple graphs to multidimensional animation (NAG, 2007); and SpectraMiner, an interactive data mining and visualization software for single particle mass spectroscopy (Zelenyuk et. al., 2006).
Visual Data Mining and Virtual Reality
Three-dimensional visualization has the potential to show far more information than two-dimensional visualization, while retaining its simplicity. This visualization technique quickly reveals the quantity and relative strength of relationships between elements, helping to focus attention on important data entities and rules. It therefore aids both the data preprocessing and data mining processes.
Many techniques are available to visualize data in three dimensions. For example, it is very common to represent data by glyphs. A glyph can be defined as a three-dimensional object suitable
for representing data or subsets of data. The object is chosen in order to facilitate both the visualization and the data mining process. The glyph must be self-explanatory and unambiguous.
Three-dimensional visualization can be made more efficient by the use of virtual reality (VR). A virtual environment (VE) is a three-dimensional environment characterized by the fact that it is immersive, interactive, illustrative and intuitive. The fact that the environment is immersive is of great importance in data mining. In traditional visualization, the human subject looks at the data from outside, while in a VR environment the user is part of the data world. This means that the user can utilize all his senses in order to navigate and understand the data. This also implies that the representation is more intuitive. VR is particularly well adapted to representing the scale and the topology of various sets of data. That becomes even more evident when stereo visualization is utilized, since stereo vision allows the analyst to have a real depth perception. This depth perception is important in order to estimate the relative distances and scales between the glyphs. Such estimation can be difficult without stereo vision if the scene does not correspond to the paradigms our brain is used to processing. In certain cases, the depth perception can be enhanced by the use of metaphors.
In addition, we mention some non standard visualization techniques; for example iconic displays, dense pixel displays and stacked displays (Keim, 2002). The iconic display maps the attributes of a multidimensional data set to the features or parameters of an iconic representation e.g. color icons, sick figure icons and star icons. A dense pixel display maps each dimension value to a colored pixel and groups the pixels belonging to each dimensions into adjacent areas. Stack displays are utilized to represent data which have a hierarchical partition by embedding coordinate systems inside each other.
Irrespectively of the representation chosen, the data exploration is more efficient by making use of the interaction and distortion techniques. In the case of the interaction technique, one can
modify in real time the visualization scheme. Also, we may combine, relate and group various visual elements in order to facilitate the exploration of the data. As of the case of the distortion technique, it is based on the concept of multiresolution: a subset of the data is shown at high resolution while others are shown at low level. Such a technique can be either manual or automatic and is called, accordingly, interactive or dynamic.
Collaborative Virtual Environments (CVEs) can be considered as a major breakthrough in data mining (Jamieson et al., 2007). By analogy, they can be considered as the equivalent of collaborative agents in visualization. Traditionally, one or more analysts perform visualization at a unique site. This operational model does not reflect the fact that many enterprises are distributed worldwide and so are their operations, data and specialists. It is consequently impossible for those enterprises to centralize all their data mining operations in a single center. Not only must they collaborate on the data mining process, which can be carried out automatically to a certain extent by distributed and collaborative agents, but they must also collaborate on the visualization and the visual data mining aspects.
FUTURE TRENDS
Visual Data Mining and Proteomics; when Visual Appearance Becomes Functionality
Visual data mining is not limited to data visualization per se. In some specific cases, the visual appearance of the data is related to their effective functionality and visual data mining becomes synonym of function mining; a highly attractive feature for many practical applications. In this section, such an approach is applied to the emerging field of proteomics and computer aided drug design.
Protein function analysis is an important research issue in molecular biology, bioinformatics and pharmaceutics. A protein’s function is often dependent on the shape (visual appearance) and
physical properties of the so-called active sites (local subparts) of the molecular surface. Current research suggests that, if two proteins have similar active sites, the function of the two proteins may be closely related. This observation is of importance for many reasons.
Consider a protein which has shown to be successful in a prescription drug developed to treat a terminal illness. However, this protein has serious contra-indications and causes severe adverse effects in a certain subset of the population. Suppose a protein with similar visual structure and functionality, but without these serious adverse effects, can be found. The subsequent modification of the harmful drug has obvious benefits.
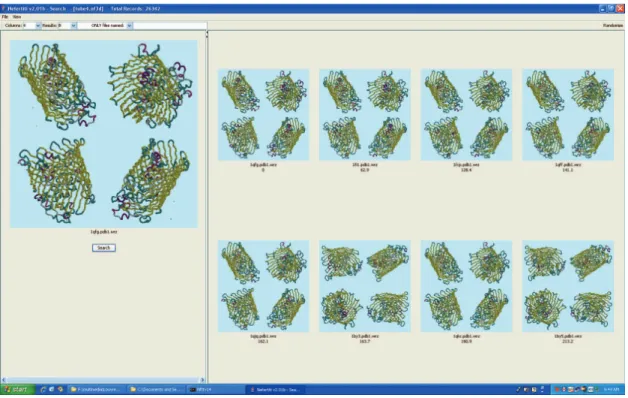
Figure 1: The CAPRI Visual Data Mining System for Proteins
For instance, the Content-based Analysis of Protein Structure for Retrieval and Indexing (CAPRI) visual data mining system addresses this issue (Paquet and Viktor, 2007). CAPRI is able to utilize the 3D structure of a protein, in order to find the k most similar structures.
The results against more than 26,000 protein structures as contained in the Protein Data Bank show that the system is able to accurately and efficiently retrieve similar protein structures with a very high precision-recall rate. For instance, figure 1 shows the retrieval of visually similar proteins based on their 3D shape. All proteins shown belong to the same family. Through the use of the CAPRI system, domain experts are able to find similar protein structures, using a “query by prototype” approach. In this way, they are aided in the task of labeling new structures effectively, finding the families of existing proteins, identifying mutations and unexpected evolutions.
The main benefit of 3D structural indexing is that the protein functionality is related to its 3D shape. 3D shape indexing is a natural way to index the functionality with all the foreseen applications in bioinformatics, genomic, as well as for the pharmaceutical industry.
CONCLUSIONS
The ability to visualize the results of a data mining effort aids the user to understand and trust the knowledge embedded in it. Data and information visualization provide the user with the ability to get an intuitive "feel" for the data and the results, e.g. in the form of rules, that is being created. This ability can be fruitfully used in many business areas, for example for fraud detection, diagnosis in medical domains and credit screening, amongst others.
Finally, the direct mining of visual information looks very promising in proteomics for the design of new drugs with fewer side effects.
REFERENCES
Barrett T., Troup D. B., Wilhite S. E., Ledoux P., Rudnev R., Evangelista C., Kim I. F., Soboleva A., Tomashevsky M. and Edgar R. (2007). NCBI GEO: Mining Tens of Millions of Expression Profiles - Database and Tools Update, Nucleic Acids Research, 35, D760-D765. Blanchard J., Guillet F. and Briand H. (2006). Interactive Visual Exploration of Association Rules
with Rule Focusing Methodology, Knowledge and Information Systems, 13 (1), 43-75. Erbacher, R. and Teerlink, S., (2006). Improving the Computer Forensic Analysis Process through
Visualization, Communications of the ACM, 49 (2), 71 – 75.
Garcia-Osorio C. and Fyfe C. (2008). Visualizing Multi Dimensional Data, Successes and New
Directions in Data Mining, IGI Global, 236-276.
Guo D., Liao K. and Morgan M. (2007). Visualizing Patterns in a Global Terrorism Incident Database, Environment and Planning, Planning and Design, 34(5), 767-784.
Han, J., & Kamber, M. (2006). Data Mining Concepts and Techniques, 2nd Edition, San Francisco: Morgan Kaufmann.
Hilderman, R.J. (2006). Assessing the interestingness of discovered knowledge using a principled objective approach, 2nd SIGKDD Workshop on Utility-Based Data Mining (Philadelphia,
USA), 2006, 44-53.
Hruschka E. R. Jr., do Carmo N. M., de Oliveira V. A. and Bressan G. M. (2007). Markov-Blanket Based Strategy for Translating a Bayesian Classifier into a Reduced Set of Classification Rules, HIS 2007 (Kaiserslautern, Germany), 192-197.
Jamieson R., Haffegee A., Ramsamy P. and Alexandrov V. (2007). Data Forest: A Collaborative Version, ICCS 2007 (Beijing, China), SLNCS 4488, 744-751.
Jankun-Kelly T. J., Kwan-Liu M. and Gertz M. (2007). A Model and Framework for Visualization Exploration, Transactions on Visualization and Computer Graphics, 12(2), 357-369. Keim D. A. (2002). Information Visualization and Visual Data Mining, IEEE Transactions on
Visualization and Computer Sciences, 8 (1), 1-8.
Klemela J. (2007). Visualization of Multivariate Data with Tail Trees, Information Visualization, 6 (2), 109-122.
Kou G., Peng Y., Shi Y. and Chen Z. (2007). Epsilon Support Vector and Large-Scale Data Mining Problems, ICCS-2007 (Beijing, China), SLNCS 4489, 874-881.
Numerical Algorithms Group (2007). Iris Explorer, http://www.nag.co.uk/welcome_iec.asp
Paquet E. and Viktor H. L. (2007). Exploring Protein Architecture using 3D Shape-based Signatures, ECMB 2007 (Lyon, France), 1204-1208.
Sun J., Kaban A. and Raychaudhury S. (2007), Robust Visual Mining of Data with Error Information, PKDD 2007 (Warsaw, Poland), SLNCS 4702, 573-580.
Valdes J. J. and Barton A. J. (2007). Finding Relevant Attributes in High Dimensional Data: A Distributed Computing Hybrid Data Mining Strategy, Transactions on Rough Sets VI, SLNCS 4374, 366-396.
Valdes J. J., Romero E. and Gonzalez R. (2007). Data and Knowledge Visualization with Virtual Reality Spaces, IJCNN 2007 (Orlando, USA), 160-165.
Zelenyuk, A., et al. (2006). SpectraMiner, an interactive data mining and visualization software for single particle mass spectroscopy: A laboratory test case, International Journal of Mass
TERMS AND DEFINITIONS
Collaborative virtual environment. An environment that actively supports human-human communication in addition to human-machine communication and which uses a virtual environment as the user interface.
Curse of dimensionality. The problems associated with information overload, when the number of dimensions is too high to visualize.
Data visualization. The visualization of the data set through the use of a techniques such as scatter plots, 3D cubes, link graphs and surface charts.
Glyph. A three-dimensional object suitable for representing data or subsets of data.
Multimedia data mining. The application of data mining to data sets consisting of multimedia data, such as 2D images, 3D objects, video and audio. Multimedia data can be viewed as integral data records, which consist of relational data together with diverse multimedia content.
Visualization. The graphical expression of data or information.
Visual data mining. The integration of data visualization and data mining. Visual data mining is closely related to computer graphics, multimedia systems, human computer interfaces, pattern recognition and high performance computing.