Endogenous TRPV1 stimulation leads to the activation of the inositol
phospholipid pathway necessary for sustained Ca
2+
oscillations
László Pecze
⁎
, Walter Blum, Thomas Henzi, Beat Schwaller
Anatomy, Department of Medicine, University of Fribourg, Route Albert-Gockel 1, Fribourg, CH-1700, Switzerland
Sensory neuron subpopulations as well as breast and prostate cancer cells express functional transient receptor potential vanilloid type 1 (TRPV1) ion channels; however little is known how TRPV1 activation leads to biological responses. Agonist-induced activation of TRPV1 resulted in specific spatiotemporal patterns of cytoplasmic Ca2+
signals in breast and prostate cancer-derived cells. Capsaicin (CAPS; 50 μM) evoked intracellular Ca2+ oscillations
and/or intercellular Ca2+ waves in all cell lines. As evidenced in prostate cancer Du 145 cells, oscillations were
largely dependent on the expression of functional TRPV1 channels in the plasma membrane, phospholipase C activation and on the presence of extracellular Ca2+ ions. Concomitant oscillations of the mitochondrial matrix
Ca2+ concentration resulted in mitochondria energization evidenced by increased ATP production. CAPS-induced Ca2+ oscillations also occurred in a subset of sensory neurons, yet already at lower CAPS concentrations
(1 μM). Stimulation of ectopically expressed TRPV1 channels in CAPS-insensitive NIH-3T3 cells didn't provoke CAPS-triggered Ca2+ oscillations; rather it resulted in low-magnitude, long-lasting elevations of the cytosolic
Ca2+ concentration. This indicates that sole TRPV1 activation is not sufficient to generate Ca2+ oscillations.
In-stead the initial TRPV1-mediated signal leads to the activation of the inositol phospholipid pathway. This in turn suffices to generate a biologically relevant frequency-modulated Ca2+ signal.
1. Introduction
Calcium ions (Ca2+), universal signaling molecules, are widely rec-ognized to play a fundamental role in the regulation of various biologi-cal processes. Many cytosolic and mitochondrial activities are driven in a Ca2+-dependent manner. Therefore, each cell possesses sophisticated mechanisms for the precise regulation of cytoplasmic (ccyt),
endoplas-mic reticulum luminal (cER) and mitochondrial matrix (cmito) Ca2+
con-centrations. Since Ca2+regulates the cell cycle at several stages, Ca2+
signaling is importantly involved in cell-fate determination (quiescent state, proliferation or cell death). Mitogenic compounds such as platelet-derived growth factor, vasopressin, prostaglandin, bombesin or EGF evoke repetitive Ca2+transients and also induce inositol
tris-phosphate (InsP3) production[1,2]. In Swiss 3T3 cells, increases in ccyt
evoked by mitogenic compounds are essential, but not sufficient to in-duce DNA synthesis and proliferation[3]. Moreover the frequency of base-line spiking Ca2+oscillations in cultured human embryonic kidney
(HEK) cells is directly related to cell proliferation[4]. In postmitotic neu-rons, Ca2+ oscillations regulate a variety of neuronal processes
including excitability, associativity, neurotransmitter release, synaptic plasticity and gene transcription[5].
The signaling process leading to Ca2+oscillations is composed of the following steps: I) A ligand binds to its receptor coupled to heterotrimeric G proteins, II) the Gαqsubunit of a heterotrimeric G
pro-tein dissociates from the G propro-tein-receptor complex and activates phospholipase C, III) phospholipase C hydrolyzes phosphatidylinositol 4,5-bisphosphate (PIP2) to inositol 1,4,5-trisphosphate (InsP3), which
then releases Ca2+from intracellular stores via binding to the inositol
trisphosphate receptor (InsP3R)[6]and diacylglycerol (DAG), which
ac-tivates protein kinase C (PKC) and IV) activation of InsP3R by InsP3leads
to the quantal release of Ca2+ions from the endoplasmic reticulum[7].
The shape of the Ca2+signal is correlated with the InsP
3concentration,
i.e. the stimulation intensity: weak activation results in single Ca2+
spikes, increasing the stimulation leads to slow base-line spiking oscilla-tions, followed by fast base-line spiking oscillaoscilla-tions, sinusoidal Ca2+ oscillations andfinally non-oscillating signal-plateau Ca2+responses
[8]. Of note, Ca2+oscillations occur within a certain range of agonist
stimulation. Ryanodine receptors have structural and functional simi-larity to InsP3R, but show no sensitivity to InsP3[9]. One of the functions
of ryanodine receptors is to amplify the InsP3-mediated release of Ca2+
[10]. The unique bell-shaped dependence of InsP3R and ryanodine
re-ceptors on ccytallow for the repetitive release of Ca2+ions from the
en-doplasmic reticulum[11]. This is what is observable as Ca2+oscillations.
⁎ Corresponding author at: Anatomy, Department of Medicine, University of Fribourg, Route Albert-Gockel 1, CH-1700 Fribourg, Switzerland.
E-mail address:[email protected](L. Pecze).
http://doc.rero.ch
Published in "Biochimica et Biophysica Acta (BBA) - Molecular Cell Research 1863(12): 2905–2915, 2016"
which should be cited to refer to this work.
The transient receptor potential cation channel subfamily V member 1 (TRPV1) triggers intracellular signaling mechanisms by an increase of ccyt, when it is activated by multiple pain-inducing stimuli including
heat, acids and pungent compounds[12]. TRPV1 is activated by selective potent natural agonists such as capsaicin (CAPS) and resiniferatoxin (RTX), pungent compounds found in chili pepper and in a tropical plant called Euphorbia resinifera, respectively[13]. Upregulation of TRPV1 channels in neoplastic breast and prostate tissue compared to normal tissue has been reported before[14,15], but little is known about the channel's physiological function and the likely pathological consequences in these neoplasms. Virtually all pharmacological and molecular methods used to examine the function of these channels re-sulted in a decrease of cell viability. These methods included molecular up- or downregulation of the channels and activation or inhibition of channels with natural exogenous agonists or synthetic antagonists [16,17]. The activation of these channels leads to an increase in ccytin
breast and prostate cell lines, but the previously published studies pre-sented only the average of evoked Ca2+cytoplasmic signals within the
entire cell populations[17–19]. This method blurs the spatiotemporal character of individual intracellular Ca2+signals, which is essential to
understand how TRPV1-mediated stimuli influence the cell behavior at the single cell level.
In this study, spatiotemporal recordings of ccyt and cmito were
collected and analyzed; moreover selected mitochondrial functions (membrane potential, ATP production) were analyzed as well. The re-sults revealed the connection between TRPV1 channels and the inositol phospholipid pathway and moreover how TRPV1-mediated Ca2+
sig-nals are processed to biologically relevant frequency-modulated Ca2+ oscillations. It is known that TRPV1 channels are modulated by phos-pholipids such as PIP2[20,21], but our results revealed that the activation of endogenous TRPV1 leads to the production of inositol tris-phosphate, thereby reducing the levels of PIP2 in the plasma membrane creating a negative feedback loop.
2. Materials and Methods
2.1. Reagents
Capsaicin (CAPS), a TRPV1 agonist and capsazepine (CapZ), a well-characterized antagonist of TRPV1 were dissolved in DMSO at a concentration of 100 mM (all from Sigma-Aldrich, St. Louis, MO). Resiniferatoxin (RTX) from the LC Laboratories (Woburn, MA) was dis-solved in ethanol at a concentration of 2 mM. 13(S)-Hydroxyoctadeca-9Z,11E–dienoic acid (13(S)-HODE), an endogenous agonist of TRPV1 was obtained from Sigma-Aldrich. Suramin from Adipogen (Liestal, Switzerland) was dissolved in double distilled water. Phospholipase C inhibitor U-73122 were from Tocris (Ellisville, MO). The compounds were further diluted with buffer solution used for Ca2+-imaging
exper-iments that contained (in mM): NaCl 138, Na2PO48, CaCl22, MgCl20.5,
KCl 2.7, KH2PO41.6; pH 7.4. Thefinal concentration of the solvents were
b0.1% in all experimental solutions. At these concentrations the solvents did not affect/modify the evoked Ca2+responses in control experiments
(data not shown). Ethylene glycol tetra acetic acid (EGTA) was dis-solved with NaOH in double distilled water at basic pH (pHN 8.0) and then the pH was adjusted to 7.4 with HCl. The nuclear stain Hoechst 33,342, the mitochondrial marker MitoTracker Red CMXRos and the plasma membrane marker CellMask™-Orange were purchased from Thermo Fisher Scientific Inc. (Waltham, MA).
2.2. Plasmids and cell lines
The cDNA of the human TRPV1 channel (hTRPV1) was amplified from RNA isolated from human trigeminal ganglion tissue as previously described[22]. The pGFP-TRPV1 plasmid resulting in a GFP-TRPV1 fusion protein, as well as the plasmid pTRPV1 encoding full-length TRPV1 were used in this study. The plasmid encoding InsP3
5-phosphatase (pIRES-InsP3–5P-GFP) was a kind gift from Christophe Erneux, IRIBHM, Bruxelles[23]. The BFP-KDEL plasmid for ER visualiza-tion was a gift from Gia Voeltz; Addgene plasmid #49,150. The mCherry-hCdt1 plasmid was a kind gift of Prof. H. Miyoshi (Riken, Japan). This plasmid was used to label nuclei in red color. The control plasmid pEGFP-C1 coding for EGFP was from Clontech (Palo Alto, CA). In order to generate lentivirus encoding the red Ca2+indicator
CAR-GECO1 (the CMV-CAR-CAR-GECO1 plasmid was a gift from Robert Campbell; Addgene plasmid #45,493), a fragment encoding CAR-GECO1 was cloned into lentiviral expression vector pLVTHM (pLVTHM was a gift from Didier Trono; Addgene plasmid # 12,247)). The GFP cassette in pLVTHM was replaced with cDNAs coding for the respective Ca2+ indicator proteins. Briefly, the required cDNA fragment coding for full-length CAR-GECO1 was synthesized by PCR using the primers FW_PmeI_Car-Geco1 (5′- CTT TGT TTA AAC ATG GTC GAC TCA TCA CGT-3′) and RV_NdeI_Car-Geco1 (5′-ATT CCA TAT GCT ACT TCG CTG TCA TCA T-3′). The amplicon was digested with PmeI and NdeI and inserted into the unique sites of the pLVTHM vector to produce the final pLV-CAR-GECO1 plasmid. The lentivirus was produced by the cal-cium phosphate transfection method using HEK 293 cells and three plasmids: one of the expression plasmids (e.g. pLV-CAR-GECO1 or pLV-mito-CAR-GECO1), the envelope plasmid (pMD2G–VSVG Addgene plasmid #12,259) and the packaging plasmid (psPAX2, Addgene plas-mid #12,260). Viral containing supernatants were collected after 48 h and 72 h,filtered, aliquoted and frozen at −80 °C, as described before [24]. Human prostate (PC-3, LNCaP, Du 145) and breast (MCF7, BT-474, MDA-MB-231) cancer cell lines and HEK 293 cells of human em-bryonic kidney origin were purchased from ATCC (Manassas, VA, USA). Non-transfected NIH-3T3 and rat TRPV1-expressing NIH-3T3 mu-rinefibroblast cells (NIH-3T3rTRPV1) were a kind gift from Dr. Zoltan
Olah, University of Miskolc, Hungary. In NIH-3T3rTRPV1cells, the
metal-lothionein promoter is used to drive the expression of full-length rat TRPV1 with a short 12 amino acidε-tag[25]. Cells were cultivated in DMEM containing 10% fetal calf serum and antibiotics (penicillin and streptomycin) at 37 °C/5% CO2. DRG primary cultures were prepared
from E15 rat embryos as previously described[22]. DRG cell cultures were maintained in DMEM containing 5% horse serum and 100 ng/ml nerve growth factor (Sigma-Aldrich) to promote neuronal survival and differentiation. After 2 days in vitro primary DRG cultures were used for the experiments. Du 145 cells stably expressing the Ca2+
indi-cator protein CAR-GECO1 was generated with lentiviral infection. In some experiments, Du 145, MCF7, HEK 293 and NIH-3T3 cells were transiently transfected using the TransIT-2020 transfection reagent according to manufacturer's instructions (Myrus, Madison, WI).
2.3. Immunofluorescence staining
Cells were prepared for immunofluorescence analysis as described previously[26]. As a positive control, MCF7 cells were transiently transfected with plasmids encoding human TRPV1 cDNA. The following antibodies were used for staining: anti-TRPV1 (1:500; rabbit polyclonal, Alomone Labs #ACC-030), Cell nuclei were stained with 5μg/ml DAPI (Invitrogen) in Tris-buffered saline for 10 min, and mounted with Hydromount solution (National Diagnostics, Atlanta, GA). Images were acquired with a confocal microscope DMI6000 integrated to a Leica TCS-SP5 workstation (Leica, Wetzlar, Germany).
2.4. Ca2+imaging
Cells grown on collagen-coated glass bottom 35 mm dishes (MatTek Corp., Ashland, MA) were loaded with the cell permeable acetoxymethyl (AM)-ester form of the indicator dyes. The following dyes were used: for the cytoplasmic free Ca2+concentration (c
cyt): Fluo-4-AM (1μM; Life
Technologies, Grand Island, NY) and for the mitochondrial free Ca2+ concentration (cmito): Rhod-2-AM (1μM; Life Technologies) diluted in
cell culture media for 20 min at room temperature. After loading cells
encoded Ca2+ indicator CAR-GECO1. At the confocal microscope,
fluorescence emission was recorded at 419–474 nm (Hoechst 33342, BFP-KDEL), 510–554 nm (Fluo-4, GFP) and 584 to 683 nm (Rhod-2, CAR-GECO1, MitoTracker Red CMXRos, mCherry-hCdt1) in a sequential mode. Recordings were performed at 37 °C using Tempcontrol 37–2 dig-ital, and a Heating Stage, all from PeCon GmbH (Erbach, Germany). The drugs were added to the abovementioned solutions by pipette and remained in the solution until the end of the experiments. Fluorescence images for either ccytor cmitomeasurements were collected
simulta-neously. Circular-shaped regions of interest (ROI) were placed inside the cytoplasmic area of cells. Thefluorescence values were calculated after background subtraction (fluorescence intensity of regions without cells). Bleaching correction was carried out, when the baseline was not stable. The relativefluorescent unit (F(t)/F(0)) values were calculated for each cell;fluorescence intensities at each time point were divided by the averaged baselinefluorescence value measured during the non-treatment period. In order to gain insight into evoked Ca2+responses of
the entire cell population, the traces ofN20 randomly selected cells were averaged and standard deviations were calculated (grey traces on figures). Each experimental procedure was repeated at least two times with similar results, but only one series of experiments is reported for each case. The percentage of the responding cells was calculated in each case. The lowest and highest values are presented from the results of three independent experiments. Computerized peak recognition for frequency was realized via the Microsoft Excel 2010 environment as described before[27]; normalized recordings from 20 oscillating cells were evaluated. The oscillation frequency was determined for time window 1–5 min after CAPS administration. The LAS-AF (Leica, Wetzlar, Germany) and Prism3 (GraphPad Software, Inc., San Diego, CA) software were used for data analysis.
2.5. Measurement of mitochondrial function
Mitochondrial membrane potential (ΔΨ) measurements were per-formed using the Rhodamine 123 dye. Briefly, cells were seeded on glass-bottom Petri dishes and incubated with 10μM Rhodamine 123 for 20 min at room temperature. Cells were washed three times with DPBS buffer. During the recording using the confocal microscope, the 488 nm excitation wavelength was used to illuminate Rhodamine 123. The relative mitochondrial membrane potential (ΔΨ) for a single cell was determined according to the following calculation: thefluorescent intensity of Rhodamine 123 in the cytoplasmic region was divided by that of the nuclear region. Then, the single-cell values were normalized to the average values recorded in the non-treated period (taken as 100% value) and the average values recorded after CCCP treatment (taken as 0% value). The mean and standard deviation were calculated from at least 20 individual cell recordings. Relative ATP levels were determined using the ATP Bioluminescence Assay Kit CLS II (Roche, Basel, Switzerland). Du 145 cells were seeded into a 96-well plate (10,000 cells/well) and grown overnight at 37 °C. The medium was removed and replaced by 100μl fresh medium containing capsaicin, capsaicin/ CCCP or DMSO (equal volume as used for the treatments). After an incu-bation time of 0, 2 and 5 min, 100μl 2× passive lysis buffer (Promega, Dübendorf, Switzerland) were added. Samples (50μl) were pipetted into a black 96-well plate and 50μl luciferase reagents were added
GFP and InsP3–5 phosphatase or with plasmid encoding only GFP at
50% confluency in 24-well plates. Cells were monitored using the Live Cell Imaging System (Incucyte, EssenBioScience, Michigan, USA) by ac-quiring images every 1 h. In another experiment, cells were stained with Annexin V-Cy3 (Enzo Life Sciences, Lausen, Switzerland) to identify ap-optotic cells following the manufacturer's instruction. Brightfield and fluorescent images were collected using an inverted fluorescence mi-croscope DMI6000B (Leica).
3. Results
3.1. Intracellular localization of TRPV1 channels in cancer cell lines
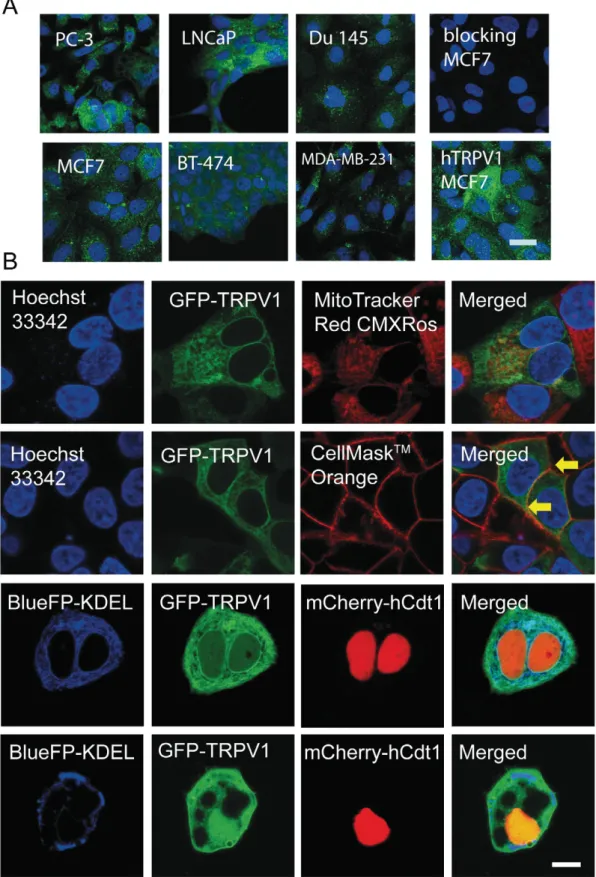
As shown previously[22]all cancer cell lines used in this study ex-press TRPV1 channels evidenced at both, mRNA and protein levels. However, protein expression levels of TRPV1 are much lower in cancer cells than in sensory neurons[22]. Immunofluorescence analysis of TRPV1 expression in prostate and breast cancer cell lines revealed rath-er homogenous, not mosaic–like expression of TRPV1 in all 6 cell lines. The immunofluorescence signal was mostly localized to intracellular membrane compartments, most prominently in the endoplasmic retic-ulum (Fig. 1A). Addition of the blocking peptides for the TRPV1 antibod-ies to the staining solutions resulted in a complete loss of the green immunofluorescence evidenced in MCF7 cells. MCF7 cells overexpress-ing either human or rat TRPV1 channels served as positive controls; strong green mosaic immunofluorescence was observed in cells overex-pressing TRPV1 distinguishing the transfected (strong green fluores-cence) from the untransfected ones (Fig. 1A, lower row, right image). The intracellular localization of TRPV1 in living MCF7 cells was visual-ized by transfection-mediated expression of GFP-labeled TRPV1 recep-tor. TRPV1 did neither co-localize with mitochondria that were loaded with MitoTracker Red CMXRos nor with cell nuclei labeled with blue Hoechst 33,342 (Fig. 1B,first row). TRPV1 was also clearly expressed on the plasma membrane evidenced by the colocalization of the plasma membrane marker CellMask™-Orange and GFP-TRPV1 (Fig. 1B, second row). Strong colocalization was evident in cells making cell/cell contacts (yellow labeling; arrows). Results from a previous study, i.e. the ability of TRPV1-expressing cells to accumulate45Ca2+ions from the
extracel-lular medium (45Ca2+ uptake assay) [22] are in support of the
colocalization study that indeed functional TRPV1 channels are present within the plasma membrane. TRPV1 showed co-localization with ER compartments, the latter visualized with bluefluorescent protein hav-ing an ER-retention signal, KDEL (Fig. 1B, third row). Nuclei of these cells were visualized with hCdt1-mCherry, a nuclear-localized protein fused to the redfluorescent protein. In some cells (approximately 10% of total cells), possibly representing early apoptotic cells, TRPV1 showed an altered intracellular localization, characterized by a rather homoge-neous cytoplasmic, as well as nuclear distribution. These cells had huge vacuolar-like intracellular vesicles and a disorganized ER structure (Fig. 1B, last row).
3.2. Analyses of the CAPS-induced changes in ccytin carcinoma cell lines
Changes in ccytwere monitored with Fluo-4. Representative ccyt
sig-nals for breast cancer cell lines exposed to CAPS (50μM) are depicted in
Fig. 1. Expression of TRPV1 channel protein in prostate and breast cancer cell lines. A. Immunohistochemical staining for TRPV1 of the 6 cancer cell lines (upper row, prostate cancer cells; lower row, breast cancer cells) showed mostly intracellular localization of TRPV1 channels, likely in ER compartments. Nuclei were counterstained with DAPI. To demonstrate specificity of IHC the TRPV1 antibody was blocked by respective specific peptides in a MCF7 sample (upper row, right). MCF7 cells ectopically expressing human TRPV1 channel were used as positive control (lower row, most right image: bar represents 25μm). B. Fluorescence images show the intracellular localization of GFP-labeled TRPV1 channels in MCF7 cells. TRPV1 doesn't not co-localize with mitochondria: TRPV1 (green), nucleus (blue), mitochondria (red) (first row). TRPV1 present on plasma membranes: TRPV1 (green), nucleus (blue), cell membrane (red) (second row). Strong colocalization at cell/cell contact sites (yellow; arrows). TRPV1 co-localizes with ER compartments in most cells: TRPV1 (green), cell nucleus (red) and ER (blue) (third row). In few cases, TRPV1 shows diffuse cytoplasmic and nuclear staining: TRPV1 (green), cell nucleus (red) and ER (blue) (last row). Bar represent 25μm.
derived cell lines responded to CAPS administration with rapid increases in ccyt often followed by intracellular Ca2+ oscillations
(Fig. 2D-F). In PC-3 (prostate) and MCF7 (breast) cancer cells, the stim-ulation with 1μM RTX or 50 μM CAPS, respectively, additionally resulted in intercellular Ca2+waves (Fig. 2G). Ca2+waves spreading through
cultured cells were either seen immediately after CAPS administration or occasionally few minutes later. In the case of MCF7 cells, the area cov-ered by the waves was sometimes restricted to only few adjacent cells, but in sporadic occasions waves spread almost over the entire cell pop-ulation in the observed area (772 × 772μm). The Ca2+
wave velocity was rather similar in both cell lines, 13.4 ± 3.2μm/s in PC-3 cells and 11.0 ± 3.3μm/s in MCF7 cells (Fig. 2G). Since LNCaP and BT-474 cells grew in aggregates (i.e. on top of each other), Ca2+waves could not be examined in our experimental setting. The percentage of the responding cells varied quite strongly between cell lines and also be-tween experiments using the same cell lines: PC-3 (56–75%), LNCaP (1–3%), Du 145 (65–72%) and breast MCF7 (5–71%), BT-474 (11–23%) and MDA-MB-231 (21–49%). A more detailed statistical analysis is pre-sented in the Supplementary Materials.
3.3. Mechanistic characterization of CAPS-evoked Ca2+oscillations in Du
145 cells
in the generation of these oscillations were investigated in more detail. Ca2+ transients in Du 145 were also elicited by 5 μM
13-S-hydroxyoctadecadienoic acid (13-HODE; Supplementary Fig. S1), an en-dogenous but weak agonist of TRPV1 resulting in 25–34% responding cells (Fig. 3A). Moreover the ultrapotent and specific TRPV1 agonist RTX (1 μM) also evoked Ca2+ signals in Du 145 cells (31–44%
responding cells;Fig. 3B). The selective and full antagonist of TRPV1 channels, CapZ (100μM), nearly completely inhibits TRPV1-mediated Ca2+signals evoked by 5μM CAPS in a heterologous expression system
[29]. Similarly, CAPS (5μM) evoked Ca2+
signals in Du 145 cells; how-ever the average signal was smaller than that evoked by 50μM CAPS (27–33% responding cells) and the oscillations immediately halted or the frequency was highly reduced after CapZ (10μM) administration (Fig. 3C). When CapZ (100μM) was administered before agonist stimu-lation, CAPS-evoked responses were strongly reduced (Fig. 3D; only ap-proximately 2–5% responding cells). CapZ also blocked around 45–60% of spontaneous Ca2+oscillations observable in 3–5% of Du 145 cells
(Supplementary Fig. S2). Ca2+oscillations were dependent on
phos-pholipase C activation, since the addition the phosphos-pholipase C inhibitor U-73122 blocked the CAPS-evoked oscillations in Du 145 cells (Fig. 3E). When cells were pre-treated with 50μM U-73122, CAPS treatment didn't induce oscillations, only single Ca2+transients were observed
in 14–22% of cells (Fig 3F) Activation of phospholipase C results in
Fig. 2. CAPS-evoked changes in the cytoplasmic free Ca2+
concentration (ccyt). A)-F) Single-cell (colored traces) and averagefluorescence recordings of the entire cell population (grey
traces) from time-lapse videos show changes in ccytafter CAPS administration. Bars represent standard deviations (s.d.). Eachfigure represents the results of one representative
experiment out of three with similar results. Experiments were repeated at least two times with similar results. BT-474 (A), MCF7 (B) and MDA-MB-231 (C) cells treated with CAPS (50μM) mostly showed immediate onset Ca2+
transients; with very brief delays similar increases were observed in neighboring cells often resulting in an intercellular Ca2+
wave (G). Only very few LNCaP cells (1–3%) responded to CAPS (D). CAPS-evoked Ca2+
waves and Ca2+
oscillations in Du 145 (E) and PC-3 (F) prostate cancer cells. G) Time-lapse image series of intercellular Ca2+
waves. The acquisition rate was set to 3 s. Blue and red colors depict lower and higherfluorescence intensities, respectively. A Ca2+
wave in PC-3 cells was evoked by administration of 1μM RTX (upper row). A larger Ca2+
wave in MCF7 cells was evoked by 50μM CAPS (lower row). Bar represents 150 μm.
consider that both activation and inhibition of phospholipase C has an effect on the phospholipid composition of the plasma membrane that subsequently influences the sensitivity of TRPV1 channels[20,21]. The importance of InsP3in the generation of Ca2+oscillations was further
verified by overexpression of the InsP3-metabolizing enzyme InsP3–5
phosphatase. When the enzyme was expressed from a GFP polycistronic construct, the GFP expression enabling the identification of transfected InsP3–5 phosphatase-producing cells, CAPS was still able to generate
small Ca2+signals in 12–14% of GFP-positive cells (Fig. 3G). However,
Ca2+oscillations completely disappeared. The non-transfected
GFP-negative neighbors showed regular oscillations (62–75% responding cells) (Fig. 3G, yellow trace). In a control experiment, cells only express-ing GFP showed oscillations indicatexpress-ing the GFP by itself had no effect on
the appearance of Ca2+oscillations (Fig. 3H). Ryanodine (50μM) caused a brief block of the CAPS-evoked Ca2+oscillations indicative of the
im-portance of ryanodine-sensitive stores for the maintenance of oscillations in these cells (Fig. 3I). Importantly, the removal of extracel-lular Ca2+strongly diminished and in most cases abolished the
CAPS-evoked TRPV1-mediated effects; while the CAPS-induced immediate in-crease in ccytwas essentially absent, spontaneous oscillations in few
cells (1–2%) were insensitive to extracellular Ca2+elimination by high
external EGTA (10 mM) (Fig. 3J). Extracellular ATP (5μM) also evoked Ca2+oscillations in 83–91% of Du 145 cells (Supplementary Fig. S3),
which were partially inhibited by 50μM suramin, a blocker of ATP-sensing purinergic receptors (Supplementary Fig. S4). Extracellular re-lease of ATP had been found to play an important role in generation of
Fig. 3. The effect of simultaneous administration of TRP agonists. A)-L) Single-cell (colored traces) and averagefluorescence (grey traces) recordings from time-lapse videos show changes in ccyt. Bars represent standard deviations (s.d.). Eachfigure represents the results of one representative experiment out of three with similar results. A) 13-HODE (5 μM), an
endogenous TRPV1 agonist, evoked weak Ca2+
responses. B) Ca2+
responses were evoked by administration of 1μM RTX, a specific potent TRPV1 agonist. C) CapZ, a TRPV1 blocker, administered after CAPS stopped or strongly decreased the frequency of CAPS-evoked Ca2+
oscillations in Du 145 cells. D) CapZ administered before CAPS strongly reduced the CAPS-evoked response E) U-73,122, a phospholipase C inhibitor, blocked the CAPS-CAPS-evoked Ca2+
oscillations. F) Cells pre-treated with 50μM U-73122f didn't showed oscillations. G) Overexpression of InsP3–5-phosphatase hydrolyzing InsP3concomitant with GFP protein expression inhibited CAPS-induced oscillations (single cell recordings in red, blue and green
color). Grey and yellow traces represents averagefluorescence recordings from cells with or without InsP3-hydrolysing enzyme from the same culture dish, respectively H) GFP
expression alone had no effect on oscillations (single cell recordings in red, blue and green color). Grey and yellow traces represents averagefluorescence recordings from cells with or without GFP from the same culture dish, respectively I) Ryanodine (50μM) transiently inhibited the Ca2+oscillations. J) In the absence of external Ca2+ions CAPS did not induce Ca2+
responses, but some spontaneous Ca2+
oscillations were still observable K) Suramin, a blocker of purinergic receptors, decreased the frequency of Ca2+
oscillations. L) Serum re-administration to Du 145 cells evoked Ca2+
oscillations similar to responses to CAPS administration. M) Time-lapse recording of Du 145 cells transfected with GFP-labeled InsP3
–5-phosphatase. Most of transfected cells show the morphological appearance of apoptosis: cell shrinkage, nuclear condensation, blebs and detachment from surface. Bar represents 20μm.
inositol phospholipid pathway[27,32]. This procedure applied to Du 145 cells resulted in the generation of similar oscillations in ccyt
(80–95% responding cells), as was observed after CAPS treatment (Fig. 3L). Cells transfected with a plasmid encoding both GFP and InsP3–5 phosphatase were monitored. After 72 h, approximately 30–
40% of transfected cells showed the morphological signs of apoptosis: cell shrinkage, nuclear condensation, membrane blebs, cell detachment from the culture plate and appearance of apoptotic bodies (Fig. 3M). These cells were also positive to Annexin V-Cy3 red staining (apoptosis indicator) (Supplementary Fig. S5, upper row). In a control experiment cells were transfected with the plasmid pEGFP-C1 encoding only GFP protein. Clearly less cells, approximately 5% of transfected cells were positive for Annexin V-Cy3 staining (Supplementary Fig. S5, lower row). Ourfinding that blocking of the Ca2+oscillations by InsP
3–5
phosphatase overexpression reduced cell viability indicates that the inositol phospholipid pathway plays an important role in the physiology of Du 145 cells.
3.4. Increase in cmitoleads to ATP production in CAPS-treated Du 145 cells
In hepatocytes and primary mesothelial cells oscillations in ccyt
acti-vate mitochondrial enzymes and also augment mitochondrial function [32,33]. Although ATP production in cancer cells is mainly based on aer-obic glycolysis, mitochondria are implicated in ATP production also in tumor cells[34]. The oscillations in ccytevoked by CAPS resulted in
con-comitant changes in the free mitochondrial matrix Ca2+concentration (cmito) (Fig. 4A). As observed before in mesothelial cells[32], the
chang-es in cmitooccurred with a small time delay compared to the ccytsignals
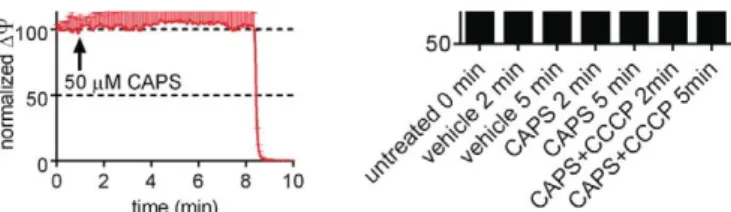
(Fig. 4A). The addition of CAPS also slightly increased the mitochondrial membrane potential (ΔΨ), however the increase was not significant (Fig. 4B). In comparison to untreated cells, CAPS treatment resulted in a small, yet significant increase in ATP production in Du 145 cells, evi-denced by a side-by-side comparison of untreated vs. CAPS-treated Du 145 cells measured 2 and 5 min after CAPS addition (Fig. 4C). Collapsing of the mitochondrial membrane potential by the uncoupler carbonyl cyanide m-chlorophenyl hydrazone (CCCP;Fig. 4B)) diminished ATP production despite the concomitant presence of the TRPV1 agonist CAPS (Fig. 4C).
3.5. CAPS treatment of DRG neurons but not of NIH-3 T3 cells ectopically expressing TRPV1 results in Ca2+oscillations
Recently, we have demonstrated that DRG neurons express higher levels of TRPV1 channels than cancer cells. Moreover, activation of sensory neurons with 20μM CAPS leads to overstimulation-based cyto-toxicity in sensory neurons with signal plateau-type responses in ccyt
[22,35]. Yet at lower CAPS concentrations in the range of 1μM approx-imately 30–40% of DRG neurons showed Ca2+oscillations (Fig. 5A).
Similar experiments were carried out in NIH-3T3 cells characterized by very low to none endogenous TRPV1 expression[25]and treatment with 50μM CAPS had no effect on ccyt(0% of responding cells) (Fig. 5B).
When these cells were transfected with plasmids coding for either human or rat TRPV1 channels, addition of CAPS (50μM) resulted in rapid signal-plateau Ca2+responses in 15–28% of cells, thus allowing
to quickly identifying the transfected (TRPV1+) subpopulation of
end of the experiment. Cells werefirst treated with a low CAPS concen-tration (50 nM), followed by 50μM CAPS several minutes later. In all responding cells one of the four following patterns were observed: Type I) In 2–3% of cells, strong signal-plateau Ca2+responses were
ob-served already after administration of 50 nM CAPS (e.g. green trace in Fig. 5C), most probably indicative of high levels of ectopic TRPV1 ex-pression. Type II) In 9–15% of cells, after a weak and prolonged Ca2+
in-crease evoked by 50 nM CAPS, ccytslowly recovered to baseline levels,
usually within 5–7 min after treatment. This was followed by strong signal-plateau responses evoked by 50μM CAPS (e.g. red trace in Fig. 5C). Type III) Cells (6–11%) didn't respond to low CAPS exposure, but displayed strong responses to high CAPS concentration (e.g. blue trace inFig. 5C). Type IV) Cells (72–85%) that didn't respond to 50 μM CAPS were assumed to comprise the TRPV1- subpopulation (e.g. orange trace inFig. 5C). Of note in all conditions, no Ca2+oscillations were
ob-servable. Essentially identical results were obtained, when cells stably overexpressed rat TRPV1. The same four behaviors towards low and high CAPS exposure were observed (Type I, Type II, Type III and Type IV responses in 24–30%, 43–52%, 17–26% and 1–5% of cells, respectively) and these cells showed neither spontaneous nor CAPS-evoked Ca2+
oscillations. (Fig. 5D). Thus, these results indicated that overexpression of TRPV1 alone is not sufficient to produce Ca2+ oscillations.
Circumventing the need for TRPV1 signaling by transient serum withdrawal followed by serum re-administration resulted in clear Ca2+ oscillations in NIH-3T3 cells (80–90% of responding cells;
Fig. 5E), which was strongly blocked by U-73122 pre-treatment (Fig. 5F). This indicated that the inositol phospholipid pathway is indeed intact in NIH-3T3 cells, but that stimulation of ectopic TRPV1 was unable to induce this activation. The reason for this may be manifold; one pos-sibility is that TRPV1 is associated with a linker protein required to indi-rectly activate the inositol phospholipid pathway. Of note, ectopic human TRPV1-expressing NIH-3 T3 cells stimulated with 50μM CAPS showed a long-lasting Ca2+ signal resembling the one evoked by the Ca2+ionophore ionomycin (Fig. 5G). The ionomycin treatment
(100% responding cells) rendered both plasma and ER membranes per-meable for Ca2+ions but also did not link the ccytincrease to the
activa-Fig. 4. CAPS-mediated cytoplasmic Ca2+
oscillations in Du 145 cells lead to increases in cmitoand ATP synthesis A) Simultaneous measurement of ccytand cmitorevealed
that oscillations in ccyt led to oscillations in cmitowith a slight time delay. A
representative recording of ccyt(green) and cmito(red) in a Du 145 cell is shown. B)
Oscillations in cmitoslightly increased the mitochondrial potential (ΔΨ), which collapsed
after administration of 100μM CCCP. Figure represents the results of one representative experiment out of three with similar results. C) Upon CAPS stimulation ATP production was significantly increased 2 and 5 min after stimulation compared to vehicle-treated cells. CAPS (50μM) administration in the presence of the uncoupler CCCP (500 μM) resulted in decreased ATP production compared to the vehicle-treated cells. Each column represents the result ofN10 independent samples (mean ± s.d.). Significant differences between samples are marked with * (pb 0.05).
TRPV1-mediated and ionomycin-induced elevations in ccytwas their
dependence on extracellular Ca2+. The ionomycin-evoked increase in
ccytdidn't differ much, whether extracellular Ca2+was high or low
(Fig. 5G) indicating that the majority of Ca2+ions leading to the
tran-sient increase in ccytwas derived from internal stores. The
TRPV1-mediated CAPS-induced Ca2+signal was significantly smaller in low ex-tracellular Ca2+conditions indicative of an essential contribution of
plasma membrane-located TRPV1 in the increase of ccyt(Fig. 5H).
How-ever, irrespective of the Ca2+source (internal store, extracellular) the robust increase in ccytwas not leading to oscillations. HEK 293 cells,
sim-ilarly to NIH-3T3 cells, are characterized by very low to none endoge-nous TRPV1 expression [36]. These cells didn't respond to CAPS treatment (Fig. 5I). Overexpression of TRPV1 channels resulted in the same four behaviors towards low and high CAPS exposure observed before in NIH-3T3 (Type I, Type II, Type III and Type IV responses in 15–38%, 15–27%, 13–21% and 18–32% of cells, respectively (Fig. 5J). However approximately 5–13% of cells showed Ca2+oscillations or
sin-gle Ca2+spikes after 50 nM CAPS stimulation. Since these oscillating
cells didn't respond to high CAPS (50μM) with constant elevated ccyt,
we presume that these cells consisted of non-transfected cells. Of note, those cells were always next neighbors of a highly sensitive TRPV1-expressing cells (Fig. 5K). Currently we can't provide a clear ex-planation for thisfinding. We hypothesize that TRPV1-expressing highly-sensitive cells might release some agonist molecule(s) that affect the oscillatory behavior of a neighboring TRPV1-negative cell.
4. Discussion
Activation of TRPV1 channels by endogenous compounds or phar-macological substances such as CAPS may lead to various biological responses in different cell types. Mild TRPV1 activation leads to prolifer-ation of airway smooth muscle cells[37]and is involved in the induction of skeletal muscle hypertrophy[38]. TRPV1 expression in sensory neu-rons is associated with pain and heat sensation[39]. Strong and persis-tent activation of TRPV1 on sensory neurons leads to the elimination of TRPV1-expressing neurons due to overstimulation-based cytotoxicity
Fig. 5. CAPS-mediated Ca2+signals in DRG sensory neurons and in NIH-3 T3 cells ectopically expressing TRPV1 A)-E) Single-cell (colored traces) and averagefluorescence (grey
traces) recordings from time-lapse videos show changes in ccyt. Bars represent standard deviations (s.d.). Eachfigure represents the results of one representative experiment out of
three with similar results. A) A subset of cultured rat DRG neurons showed Ca2+
oscillations after CAPS (1μM) treatment. B) Non-transfected NIH-3T3 cells do not respond to 50 μM CAPS. C) Ectopic expression of human TRPV1 rendered NIH-3T3 cells extremely sensitive to CAPS resulting in signals already at 50 nM CAPS and even higher ones with 50μM CAPS. No oscillations were observed. D) Similar low magnitude, long-lasting elevations of ccyt, instead of Ca2+oscillations, were observed when rat TRPV1 was ectopically overexpressed.
E) Ca2+oscillations appeared when serum was re-administered to NIH-3 T3 cells. F) U-73,122 pre-treatment significantly reduced the serum evoked response G) Ionomycin
treatment didn't result in Ca2+
oscillations and showed similar Ca2+
signals in the presence (black) or absence (red) of extracellular Ca2+
. H) In the presence of extracellular Ca2+
ions (black trace) the Ca2+response after CAPS treatment was more pronounced in TRPV1-expressing NIH-3T3 cells in comparison to control cells maintained in the absence of
extracellular Ca2+(red trace). I) Non-transfected HEK 293 cells didn't respond to 50μM CAPS. J) Low or high magnitude, long-lasting elevations of c
cyt, but not Ca2+oscillations were
usually observed when human TRPV1 was ectopically overexpressed in HEK 293 cells. K) Few likely non-transfected HEK 293 cells (green traces), mainly in the neighborhood of a highly sensitive transfected HEK 293 cell (blue curve) showed Ca2+
oscillations.
found that production of InsP3and continuous Ca2+influx across the
plasma membrane are two essential and frequency-determining factors for Ca2+oscillations.
Prostate and breast cancer cells, previously shown to express TRPV1 transcripts and TRPV1 protein [22], produced CAPS-induced Ca2+
waves and Ca2+oscillations. CAPS is a selective TRPV1 receptor agonist
with a half-maximal effective concentration for CAPS in sensory neurons in the range of 200–700 nM[42,43]; CAPS evokes Ca2+signals
at low nanomolar concentrations in heterologous expression systems. In line, NIH-3 T3 cells overexpressing TRPV1 responded to 50 nM CAPS with increases in ccyt(Figs. 5C, D). However, a concentration of
at least 5–50 μM CAPS was required to elicit Ca2+responses in the
untransfected prostate and breast cancer cells. The lower CAPS sensitiv-ity of cancer cells is likely linked to the lower TRPV1 expression levels in these cells in comparison to TRPV1-expressing sensory neurons, esti-mated to be at least 20-fold lower in the investigated cancer cell lines [22]. Of relevance, the concentrations (5μM and 50 μM) used in this study were still below the concentration, where an unspecific effect of CAPS was reported before. CAPS (250μM and higher) blocks the respi-ratory chain acting as a quinone analog[44]. CAPS-evoked responses were inhibited by administration of CapZ, a genuine and competitive TRPV1 agonist. Moreover, the ultrapotent and highly specific TRPV1 ag-onist RTX and one of the endogenous TRPV1 agag-onists, 13-HODE, also generated Ca2+signals indicating the involvement of TRPV1 channels
in the process. In sensory neurons, exposure to 1μM CAPS was sufficient
nel activation leads to InsP3production is currently unknown; however
some hypotheses can be put forward. I) Activation of phospholipase C by TRP channels is induced by Ca2+ions transported by the TRP chan-nels, as the activity of phospholipase C depends on increases in ccytas
re-ported before[45]. Since merely an increase in ccytdid not lead to Ca2+
oscillations (Fig. 5B, C, E and F), we can conclude that this process does not play a critical role in phospholipase C activation. However, the trans-port of Ca2+ions across the plasma membrane is important for the
maintenance of Ca2+oscillations and also affecting the oscillation
fre-quency[27,32]. Thus, the amount of Ca2+ions passing through TRPV1
channels sustains Ca2+oscillations and influences the oscillation
fre-quency (Fig. 3C, D). II) TRPV1 channels are associated with G proteins and upon stimulation, G proteins activate phospholipase C; an associa-tion between TRPM8, another TRP family member, and Gαqproteins
has been described before[46]. The direct connection between TRPV1 and G proteins has to be elucidated in a future study. III) Previous exper-iments in astrocytes and hepatocytes[30,31]indicate that ATP is the molecule released by the wave-initiator cells. ATP binding to purinergic receptors on neighboring cells then results in InsP3production required
for the generation of Ca2+oscillations and intercellular Ca2+waves. In
analogy, we hypothesize that TRP channel stimulation might induce ex-tracellular ATP release, followed by InsP3production in neighboring
cells resulting in Ca2+signals in those cells. In support, the purinergic
receptor blocker suramin, effective in blocking of ATP-evoked Ca2+
os-cillations, was not effective in blocking of the CAPS-induced osos-cillations,
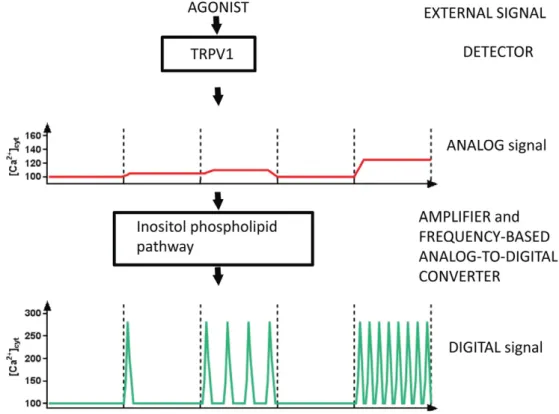
Fig. 6. Proposed model for the role of TRPV1 channels in signal transmission. The observed CAPS-evoked Ca2+signal is mainly the result of the activated phospholipid pathway
( i i l f 2+
f d l i i l ) d l fl i h 2+
i i h h h h l h l l d 2+
but reduced the Ca2+oscillation frequency and more importantly, Ca2+
wave formation.
Although in this study we focused on the effect of TRPV1 activation on the phospholipid pathway, it is known that phospholipids them-selves also modify the sensitivity and function of TRPV1 channels. Phos-phatidylinositol 4,5-bisphosphate (PIP2), a precursor molecule for the InsP3production was found to sensitize TRPV1 channels to CAPS.
Be-sides of that, also phosphatidylinositol 4-phosphate PI(4)P was found to sensitize the receptor[47]. Moreover, the depletion of PIP2 from the plasma membrane, either alone or together with PI(4)P inhibits TRPV1 channel function[47,48]. This process was shown to be involved in the mechanism of TRPV1 desensitization[47]. Thus, we propose the following negative feedback loop for TRPV1 regulation: TRPV1 channel activity leads to phospholipase C activation, which, in turn, slowly de-pletes PIP2 and PI(4)P from the membrane. This depletion then leads to the inhibition of TRPV1 receptor resulting in a halt of the Ca2+
oscillations.
To get more mechanistic insight in TRPV1-mediated Ca2+responses,
we chose Du 145 prostate cancer cells. TRPV1 was involved both in the induction and the maintenance of Ca2+oscillations, i.e. by generating
InsP3 and mediating Ca2+ influx via the plasma membrane. The
frequency of Ca2+ oscillations is implicated in regulating genes driven by pro-inflammatory transcription factors such as κB, NF-AT and Oct./OAP[49]. Ca2+oscillations were shown to activate Ras
and ERK/MAPK cascades controlling cell growth and differentiation [50]. Moreover, Ca2+oscillations induce ATP production energizing
many cellular processes[51]. In this study we also found that Ca2+
oscillations energized the mitochondria in Du 145 cells. Although the abovementioned physiological processes are associated with increased cell viability and mitogenic processes, there are only few studies reporting that CAPS increase cell proliferation of cancer cells. While CAPS (50μM) increases the proportion of cells present in the G2
phase, the proportion of G0/G1cells is decreased compared to control
(untreated) LNCaP cells [52]. Similarly Malagarie-Cazenave et al. found that CAPS induced cell proliferation in LNCaP prostate cancer cells in the same concentration range[53]. We also reported that 5– 50μM CAPS treatment slightly, but in many cases significantly increases the cell proliferation of breast and prostate cancer cells in vitro[22]. Be-sides of that, we also reported CAPS-induced invadopodium formation in MCF7 breast cancer cells[22]. Invadopodium is an amoeboid-like structure involved in tumor cell motility[54].
Endogenous agonists of TRPV1 channels such as arachidonyl acid derivatives and oxidized linoleic acid metabolites are present in the tumor milieu[55]. It has been known for a long time - even before TRP channels were discovered - that endogenous agonists of TRP channels (lipoxygenase products) promote tumor growth[56]. Howev-er, the experimental evidence that the mitogenic, growth-promoting effects of lipoxygenase products are mediated by TRPV1 has never been described before. The oxidized linoleic acid metabolite 13-S-hydroxyoctadecadienoic acid (13-HODE) was observed in human pros-tate adenocarcinoma specimens, whereas adjacent normal tissue showed no immunoreactivity for 13-HODE[57]. Similarly, a low pH in the extracellular milieu, another activator of TRPV1[58], is also associ-ated with inflammation and the cancer microenvironment[59,60]. LNCaP cells produce high amounts of 20-hydroxyeicosatetraeonic acid (20-HETE)[61], another endogenous activator of TRPV1 channels[62]. Expression of 12-lipoxygenase, the enzyme involved in generation of 12(S)-hydroxyeicosatetraeonic acid (12-HETE), was found to correlate with more malignant stages of prostate cancer[63,64]. 12-HETE is an endogenous TRPV1 ligand known to increase thefiring rate of sensory neurons via TRPV1 activation[65]. Most probably, the TRPV1 channel is the “putative G protein linked receptor[55]” involved in the proliferative effect of the lipoxygenase pathway product.
In summary, endogenous TRPV1 channels are connected with the inositol phospholipid pathway. The observed CAPS-evoked Ca2+signals
are the result of the activated phospholipid pathways and not only the Ca2+ions passing through the TRPV1 channels. Since TRPV1 chan-nels alone cannot produce Ca2+oscillations, the analog
amplitude-modulated (AM) increase in ccytis processed by inositol phospholipid
pathway. The inositol phospholipid pathway acts as an amplifier and “analog to digital converter” to generate the frequency-modulated (FM) output (Ca2+oscillations) for a given Ca2+signal produced by
TRPV1 activation (for details, see model inFig. 6). In cancer cells, one might envisage the following pathophysiological processes: increased levels of endogenous agonists present in the cancer microenvironment activate TRPV1 channels; the resulting Ca2+influx via TRP channels
to-gether with increased InsP3production induces Ca2+oscillations and
these Ca2+oscillations (FM mode) activate Ca2+signaling-dependent
transcription factors involved in cell proliferation. I.e. auto- or paracrine TRPV1 channel activation in cancer cells might promote their survival and possibly increase their proliferation rate in vivo.
Authors contributions
LP designed the study, performed Ca2+measurements, data analysis
and wrote the manuscript HT performed ATP measurements WB performed cloning and plasmid production and apoptosis assay BS per-formed data analyses and wrote the manuscript and secured funding.
Conflict of interest statement
The authors declare that they have no conflicts of interest with the contents of this article.
Transparency document
TheTransparency documentassociated with this article can be found, in online version.
Acknowledgements
The authors wish to thank Valérie Salicio and Martine Steinauer for excellent technical assistance as well bachelor students Alessio Balmelli and Chantal Bachmann for their assistance. This work has been support-ed by Swiss National Science Foundation SNSF grant # 130680 to B.S.
Appendix A. Supplementary data
Supplementary data to this article can be found online athttp://dx. doi.org/10.1016/j.bbamcr.2016.09.013.
References
[1] A.M. Dolmetsch, Nonlaser endoscopic endonasal dacryocystorhinostomy with ad-junctive mitomycin C in nasolacrimal duct obstruction in adults, Ophthalmology 117 (2010) 1037–1040.
[2] T. Ishiguro, K. Ishikawa, M. Takahashi, M. Obayashi, T. Amino, N. Sato, M. Sakamoto, H. Fujigasaki, F. Tsuruta, R. Dolmetsch, T. Arai, H. Sasaki, K. Nagashima, T. Kato, M. Yamada, H. Takahashi, Y. Hashizume, H. Mizusawa, The carboxy-terminal fragment of alpha(1A) calcium channel preferentially aggregates in the cytoplasm of human spinocerebellar ataxia type 6 Purkinje cells, Acta Neuropathol. 119 (2010) 447–464.
[3] L. Munaron, Calcium signalling and control of cell proliferation by tyrosine kinase receptors (review), Int. J. Mol. Med. 10 (2002) 671–676.
[4] R.E. Dolmetsch, R.S. Lewis, C.C. Goodnow, J.I. Healy, Differential activation of transcription factors induced by Ca2+ response amplitude and duration, Nature 386 (1997) 855–858.
[5] M.J. Berridge, Neuronal calcium signaling, Neuron 21 (1998) 13–26.
[6] K. Mikoshiba, Role of IP3 receptor signaling in cell functions and diseases, Adv. Biol. Regul. 57 (2015) 217–227.
[7] M. Yamashita,‘Quantal’ Ca(2+) release reassessed–a clue to oscillation and synchronization, FEBS Lett. 580 (2006) 4979–4983.
[8] G. Bidaux, M. Flourakis, S. Thebault, A. Zholos, B. Beck, D. Gkika, M. Roudbaraki, J.L. Bonnal, B. Mauroy, Y. Shuba, R. Skryma, N. Prevarskaya, Prostate cell differentiation status determines transient receptor potential melastatin member 8 channel subcellular localization and function, J. Clin. Invest. 117 (2007) 1647–1657.
163–173.
[14]I. Azimi, S.J. Roberts-Thomson, G.R. Monteith, Calcium influx pathways in breast cancer: opportunities for pharmacological intervention, Br. J. Pharmacol. 171 (2014) 945–960.
[15] G. Czifra, A. Varga, K. Nyeste, R. Marincsak, B.I. Toth, I. Kovacs, L. Kovacs, T. Biro, In-creased expressions of cannabinoid receptor-1 and transient receptor potential vanilloid-1 in human prostate carcinoma, J. Cancer Res. Clin. Oncol. 135 (2009) 507–514.
[16] T.T. Wu, A.A. Peters, P.T. Tan, S.J. Roberts-Thomson, G.R. Monteith, Consequences of activating the calcium-permeable ion channel TRPV1 in breast cancer cells with regulated TRPV1 expression, Cell Calcium 56 (2014) 59–67.
[17]C. Vercelli, R. Barbero, B. Cuniberti, S. Racca, G. Abbadessa, F. Piccione, G. Re, Tran-sient receptor potential vanilloid 1 expression and functionality in mcf-7 cells: a preliminary investigation, J. Breast Cancer 17 (2014) 332–338.
[18] E. Sakalli Cetin, M. Naziroglu, B. Cig, I.S. Ovey, P. Aslan Kosar, Selenium potentiates the anticancer effect of cisplatin against oxidative stress and calcium ion signaling-induced intracellular toxicity in MCF-7 breast cancer cells: involvement of the TRPV1 channel, J. Recept. Signal Transduct. Res. (2016) 1–10.
[19] B. Cig, M. Naziroglu, Investigation of the effects of distance from sources on apopto-sis, oxidative stress and cytosolic calcium accumulation via TRPV1 channels induced by mobile phones and Wi-Fi in breast cancer cells, Biochim. Biophys. Acta 1848 (2015) 2756–2765.
[20] E. Hernandez-Garcia, T. Rosenbaum, Lipid modulation of thermal transient receptor potential channels, Curr. Top. Membr. 74 (2014) 135–180.
[21] T. Rohacs, Phosphoinositide regulation of TRPV1 revisited, Pflugers Arch. 467 (2015) 1851–1869.
[22] L. Pecze, K. Josvay, W. Blum, G. Petrovics, C. Vizler, Z. Olah, B. Schwaller, Activation of endogenous TRPV1 fails to induce overstimulation-based cytotoxicity in breast and prostate cancer cells but not in pain-sensing neurons, Biochim. Biophys. Acta 1863 (2016) 2054–2064.
[23] G. Tran Van Nhieu, B. Kai Liu, J. Zhang, F. Pierre, S. Prigent, P. Sansonetti, C. Erneux, J. Kuk Kim, P.G. Suh, G. Dupont, L. Combettes, Actin-based confinement of calcium re-sponses during Shigella invasion, Nat. Commun. 4 (2013) 1567.
[24] W. Blum, B. Schwaller, Calretinin is essential for mesothelioma cell growth/survival in vitro: a potential new target for malignant mesothelioma therapy? Int. J. Cancer 133 (2013) 2077–2088.
[25]Z. Olah, T. Szabo, L. Karai, C. Hough, R.D. Fields, R.M. Caudle, P.M. Blumberg, M.J. Iadarola, Ligand-induced dynamic membrane changes and cell deletion conferred by vanilloid receptor 1, J. Biol. Chem. 276 (2001) 11021–11030.
[26] W. Blum, L. Pecze, E. Felley-Bosco, J. Worthmuller-Rodriguez, L. Wu, B. Vrugt, M. de Perrot, B. Schwaller, Establishment of immortalized murine mesothelial cells and a novel mesothelioma cell line, In Vitro Cell. Dev. Biol. Anim. (2015).
[27] L. Pecze, B. Schwaller, Characterization and modeling of Ca(2 +) oscillations in mouse primary mesothelial cells, Biochim. Biophys. Acta 1854 (2015) 632–645.
[28] R.D.C. Team, R: A Language and Environment for Statistical Computing, the R Foun-dation for Statistical Computing, 2011 (Place Published).
[29] Z. Olah, K. Josvay, L. Pecze, T. Letoha, N. Babai, D. Budai, F. Otvos, S. Szalma, C. Vizler, Anti-calmodulins and tricyclic adjuvants in pain therapy block the TRPV1 channel, PLoS One 2 (2007) e545.
[30]E. Scemes, C. Giaume, Astrocyte calcium waves: what they are and what they do, Glia 54 (2006) 716–725.
[31] Y.J. Sung, Z. Sung, C.L. Ho, M.T. Lin, J.S. Wang, S.C. Yang, Y.J. Chen, C.H. Lin, Intercel-lular calcium waves mediate preferential cell growth toward the wound edge in polarized hepatic cells, Exp. Cell Res. 287 (2003) 209–218.
[32] L. Pecze, W. Blum, B. Schwaller, Routes of Ca2+ Shuttling during Ca2+ Oscillations; Focus on the Role of Mitochondrial Ca2+ Handling and Cytosolic Ca2+ Buffers, J. Biol. Chem. (2015).
[33] G. Hajnoczky, L.D. Robb-Gaspers, M.B. Seitz, A.P. Thomas, Decoding of cytosolic calcium oscillations in the mitochondria, Cell 82 (1995) 415–424.
[34]V. Gogvadze, S. Orrenius, B. Zhivotovsky, Mitochondria in cancer cells: what is so special about them? Trends Cell Biol. 18 (2008) 165–173.
[35] L. Pecze, W. Blum, B. Schwaller, Mechanism of capsaicin receptor TRPV1-mediated toxicity in pain-sensing neurons focusing on the effects of Na(+)/Ca(2+)fluxes and the Ca(2 +)-binding protein calretinin, Biochim. Biophys. Acta 1833 (2013) 1680–1691.
[36] H. Ouadid-Ahidouch, I. Dhennin-Duthille, M. Gautier, H. Sevestre, A. Ahidouch, TRP calcium channel and breast cancer: expression, role and correlation with clinical pa-rameters, Bull. Cancer 99 (2012) 655–664.
[37] L. Zhao, X. Zhang, H. Kuang, J. Wu, Y. Guo, L. Ma, Effect of TRPV1 channel on the pro-liferation and apoptosis in asthmatic rat airway smooth muscle cells, Exp. Lung Res. 39 (2013) 283–294.
[42] M.J. Caterina, M.A. Schumacher, M. Tominaga, T.A. Rosen, J.D. Levine, D. Julius, The capsaicin receptor: a heat-activated ion channel in the pain pathway, Nature 389 (1997) 816–824.
[43]J.N. Wood, J. Winter, I.F. James, H.P. Rang, J. Yeats, S. Bevan, Capsaicin-induced ion fluxes in dorsal root ganglion cells in culture, J. Neurosci. 8 (1988) 3208–3220.
[44] A. Macho, M.A. Calzado, J. Munoz-Blanco, C. Gomez-Diaz, C. Gajate, F. Mollinedo, P. Navas, E. Munoz, Selective induction of apoptosis by capsaicin in transformed cells: the role of reactive oxygen species and calcium, Cell Death Differ. 6 (1999) 155–165.
[45] T. Rohacs, B. Thyagarajan, V. Lukacs, Phospholipase C mediated modulation of TRPV1 channels, Mol. Neurobiol. 37 (2008) 153–163.
[46] X. Zhang, S. Mak, L. Li, A. Parra, B. Denlinger, C. Belmonte, P.A. McNaughton, Direct inhibition of the cold-activated TRPM8 ion channel by Galphaq, Nat. Cell Biol. 14 (2012) 851–858.
[47]V. Lehen'kyi, N. Prevarskaya, in: M.X. Zhu (Ed.), Study of TRP Channels in Cancer Cells, TRP Channels, 2011 (Place Published).
[48] I. Dhennin-Duthille, M. Masson, E. Damiens, C. Fillebeen, G. Spik, J. Mazurier, Lactoferrin upregulates the expression of CD4 antigen through the stimulation of the mitogen-activated protein kinase in the human lymphoblastic T Jurkat cell line, J. Cell. Biochem. 79 (2000) 583–593.
[49]R.E. Dolmetsch, K. Xu, R.S. Lewis, Calcium oscillations increase the efficiency and specificity of gene expression, Nature 392 (1998) 933–936.
[50] S. Kupzig, S.A. Walker, P.J. Cullen, The frequencies of calcium oscillations are optimized for efficient calcium-mediated activation of Ras and the ERK/MAPK cascade, Proc. Natl. Acad. Sci. U. S. A. 102 (2005) 7577–7582.
[51] K. Campbell, K. Swann, Ca2+ oscillations stimulate an ATP increase during fertiliza-tion of mouse eggs, Dev. Biol. 298 (2006) 225–233.
[52]N.A. Venier, A.J. Colquhoun, N.E. Fleshner, L.H. Klotz, V. Venkateswara, Lycopene enhances the anti-proliferative and pro-apoptotic effects of capsaicin in prostate cancer in vitro, J. Cancer Ther. Res. 1 (2012).
[53] S. Malagarie-Cazenave, N. Olea-Herrero, D. Vara, I. Diaz-Laviada, Capsaicin, a compo-nent of red peppers, induces expression of androgen receptor via PI3K and MAPK pathways in prostate LNCaP cells, FEBS Lett. 583 (2009) 141–147.
[54] B.A. Saykali, M. El-Sibai, Invadopodia, regulation, and assembly in cancer cell invasion, Cell Commun. Adhes. 21 (2014) 207–212.
[55]G.P. Pidgeon, J. Lysaght, S. Krishnamoorthy, J.V. Reynolds, K. O'Byrne, D. Nie, K.V. Honn, Lipoxygenase metabolism: roles in tumor progression and survival, Cancer Metastasis Rev. 26 (2007) 503–524.
[56] R. Natarajan, J. Nadler, Role of lipoxygenases in breast cancer, Front. Biosci. 3 (1998) E81–E88.
[57]S.A. Spindler, F.H. Sarkar, W.A. Sakr, M.L. Blackburn, A.W. Bull, M. LaGattuta, R.G. Reddy, Production of 13-hydroxyoctadecadienoic acid (13-HODE) by prostate tu-mors and cell lines, Biochem. Biophys. Res. Commun. 239 (1997) 775–781.
[58] K. Kaszas, J.M. Keller, C. Coddou, S.K. Mishra, M.A. Hoon, S. Stojilkovic, K.A. Jacobson, M.J. Iadarola, Small molecule positive allosteric modulation of TRPV1 activation by vanilloids and acidic pH, J. Pharmacol. Exp. Ther. 340 (2012) 152–160.
[59]Y. Kato, S. Ozawa, C. Miyamoto, Y. Maehata, A. Suzuki, T. Maeda, Y. Baba, Acidic extracellular microenvironment and cancer, Cancer Cell Int. 13 (2013) 89.
[60]A.B. Gerry, D.S. Leake, Effect of low extracellular pH on NF-kappaB activation in macrophages, Atherosclerosis 233 (2014) 537–544.
[61]L.Y., C. Wu, J. Chen, K.H. Gotlinger, E. Ramu, J.R. Falck, M.L. Schwartzman, CYP4F isoform expression and 20-HETE synthesis in prostate cancer cells are regulated by androgen and contribute to growth, Proceedings of the 103rd Annual Meeting of the American Association for Cancer Research; 2012 Mar 31-Apr 4, Cancer Res, 72(8 Suppl), AACR, Chicago, IL. Philadelphia (PA), 2012 (Abstract nr LB-160. doi: 1538–7445.AM2012-LB-160 2012).
[62] H. Wen, J. Ostman, K.J. Bubb, C. Panayiotou, J.V. Priestley, M.D. Baker, A. Ahluwalia, 20-Hydroxyeicosatetraenoic acid (20-HETE) is a novel activator of transient recep-tor potential vanilloid 1 (TRPV1) channel, J. Biol. Chem. 287 (2012) 13868–13876.
[63] X. Gao, D.J. Grignon, T. Chbihi, A. Zacharek, Y.Q. Chen, W. Sakr, A.T. Porter, J.D. Crissman, J.E. Pontes, I.J. Powell, et al., Elevated 12-lipoxygenase mRNA expression correlates with advanced stage and poor differentiation of human prostate cancer, Urology 46 (1995) 227–237.
[64] D. Nie, G.G. Hillman, T. Geddes, K. Tang, C. Pierson, D.J. Grignon, K.V. Honn, Platelet-type 12-lipoxygenase in a human prostate carcinoma stimulates angiogenesis and tumor growth, Cancer Res. 58 (1998) 4047–4051.
[65] C. Xie, D.H. Wang, Inhibition of renin release by arachidonic acid metabolites, 12(s)-HPETE and 12-HETE: role of TRPV1 channels, Endocrinology 152 (2011) 3811–3819.