Structural and managerial cost di¤erences in
nonpro…t nursing homes
L. Di Giorgio M. Filippiniy G. Masieroz
Published in Economic Modelling (2015), 51: 289-298, http://dx.doi.org/10.1016/j.econmod.2015.08.015
Abstract
Population aging is challenging governments to …nd new solutions to …nance the increasing demand for nursing home care and slow down the increase in expenditures. In this light, many European countries are cur-rently considering reforms to increase e¢ ciency in the provision of nursing home services. One popular restructuring policy is the transformation of public organizations into private nonpro…t organizations. The underlying assumption is that private nonpro…t nursing homes are more e¢ cient than public nursing homes. However, there is limited empirical evidence to sup-port this view. This analysis aims to contribute to the evidence base on this issue by investigating the impact of the organizational form on the costs of nursing homes. We use a sample of 45 nursing homes from one Swiss canton over a 5-year period (2001-2005). The applied estimation strategy provides more accurate estimates as compared to previous studies. In par-ticular, we distinguish between cost di¤erences that are under the control of the managers from those that are not (structural). Our …ndings suggest that public nursing homes are more costly than private nursing homes, although the di¤erence is small. This cost di¤erence is mainly driven by structural rather than managerial costs. Therefore, cost-reducing policies that promote private nonpro…t nursing homes are expected to reduce costs only slightly.
Keywords: cost e¢ ciency, nursing homes, nonpro…t, ownership. JEL classi…cation: C23, I18, L20.
Institute for Health Metrics and Evaluation (IHME), University of Washington, United States; Institute of Economics (IdEP), Università della Svizzera italiana (USI), Switzerland.
yInstitute of Economics (IdEP), Università della Svizzera italiana (USI); Department of
Management, Technology and Economics, ETH Zurich, Switzerland.
zDepartment of Management, Information and Production Engineering, University of
Berg-amo, Italy; Institute of Economics (IdEP), Università della Svizzera italiana (USI), Switzer-land. Corresponding author. E-mail address: [email protected].
1
Introduction
The in‡uence of di¤erent organizational (institutional ) forms on nursing home (NH) costs is a relevant issue in most health care systems. The institutional form a¤ects the structural and managerial costs of NHs. Therefore, some institutional forms may prove to be more successful than others in providing cost-e¢ cient services. Evidence regarding the impact of institutional forms on costs can inform policy-makers regarding preferred modes of delivering services to the elderly population.
In the last decade, di¤erent restructuring policies have been implemented to control public health expenditures, such as bed downsizing in hospitals (Pia-cenza et al., 2010). In the provision of nursing home services, a focus of restruc-turing policies has been the transformation of public NHs into private nonpro…t (NFP) NHs. However, little evidence exists on di¤erences in cost e¢ ciency between institutional forms that support these policies.
This study aims to provide evidence on the impact of the institutional form on NH costs by exploring data from a region of Switzerland, the canton of Ti-cino. Because of high heterogeneity in the regulation and de…nition of nursing home services across countries, the investigation of di¤erences in cost e¢ ciency between institutional forms can be better conducted by focusing on relatively homogeneous areas. Also, the tight and heterogeneous regulation of long-term care across regions or countries generally implies a limited access to detailed and comparable data on costs of di¤erent organizational structures. Switzerland represents an ideal setting for our investigation since NH services are mostly provided by regulated nonpro…t …rms, and the country exhibits an almost per-fect balance between private and public organizations. However, Switzerland is a federal country made of 26 cantons (states) with remarkable di¤erences in terms of healthcare organization. Cantons have large autonomy in the provi-sion and regulation of nursing home care. This leads to large heterogeneity in the organization of the supply. Therefore, the focus on one Swiss canton o¤ers important advantages in terms of precision of cost data and their comparability
between institutional forms.
The literature on cost e¢ ciency of NHs has mainly focused on the e¤ect of the ownership rather than the institutional form (e.g., Chou, 2002; Santerre and Vernon, 2005; Grabowski et al., 2009). To our knowledge, only a few studies analyze the impact of the institutional form (e.g., Holmes, 1996; Vitaliano and Torren, 1994). Two of them use Swiss data (Farsi and Filippini, 2004; Farsi et al., 2008) but do not distinguish between di¤erent types of e¢ ciency.
In this study, we distinguish between structural and managerial cost di¤er-ences to explain the mixed results found in previous analyses. Managerial cost di¤erences re‡ect the ability of the managers to run a facility and can be ex-pected to vary over time. Structural di¤erences are constant features that are beyond the control of the managers, and may result from di¤erent production processes that characterize institutional forms. For instance, we think of po-litical constraints, labor contracts, governance procedures, the location of NHs, and constraints in the choice of residents. We propose an empirical strategy to investigate the presence of both types of cost di¤erences between public and private organizations.
The remainder of the paper is organized as follows: In section 2 we brie‡y discuss the related literature on structural and managerial di¤erences between NFP organizations providing nursing home services. In section 3 we de…ne di¤erent institutional forms in NH care and describe our setting. Then, in section 3.1, we sketch a theoretical model to derive hypotheses on the impact of managerial behavior and institutional aspects on cost e¢ ciency. In section 4 we present our econometric approach to compare cost e¢ ciency across di¤erent institutional forms, and we discuss the results. Section 5 is the conclusion.
2
Related literature
Kapur and Weisbrod (2000) recognize that government and private NFP …rms do di¤er in their objective functions. Theoretical work points at di¤erent rea-sons why public and private NFP organizations may di¤er. The decision-making process in NHs varies across organizational forms, for instance because of
di¤er-ent legal constraints or political pressure. Hart et al. (1997) see public managers as being constrained by some governments’ agreement to implement any cost innovation decision while managers of private NFP …rms can freely implement these decisions. In addition, these …rms are expected to face lower probability of being bailed out by public authorities or tougher punishment for poor man-agerial e¤ort. Di¤erences in the institutional form may then lead to di¤erences in NH e¢ ciency.
From an empirical perspective, the issue of the institutional form in the NH sector has been partially addressed in the economic literature. The focus has mainly been on the e¤ect of the ownership form by comparing for-pro…t to NFP organizations. Government-run organizations have typically been excluded from the analyses due to the small presence of public facilities in the US or due to the expectation that government NHs behave in a very di¤erent way than for-pro…t and NFP organizations (Grabowski et al., 2013). These studies show that for-pro…t NHs are less costly per client than NFP NHs but provide lower-quality services (Hillmer et al., 2005; Knox et al., 2002; O’Neill et al., 2003; Schlesinger and Grey, 2006). However, there is lack of empirical evidence on di¤erences between public and private NFP organizations.
To our knowledge, only a few studies empirically analyze the impact of the institutional form on the performance of NFP NHs, with mixed results. Farsi and Filippini (2004) estimate ine¢ ciency using the Schmidt and Sicklers (1984) random e¤ects (RE) model on Swiss data. The authors show that private NHs are more e¢ cient than public NHs. The study has two main drawbacks. First, ine¢ ciency is assumed to be constant over time, and cost di¤erences that change over time are captured by the error terms. Given the length of the panel, the assumption of time-invariant ine¢ ciency may not be appropriate. Second, the results can be biased in the presence of unobserved factors that remain con-stant over time since the individual e¤ects are interpreted as ine¢ ciency. To address these limitations, Farsi et al. (2008) apply a true random e¤ect model (TRE). This model allows for time-varying ine¢ ciency and controls for unob-served heterogeneity with the individual e¤ects. Therefore, time-invariant cost
di¤erences are interpreted as heterogeneity. The authors do not …nd evidence of signi…cant di¤erences between institutional forms. However, the authors only capture ine¢ ciency that varies over time. Constant ine¢ ciency is captured by the individual e¤ects rather than being included in the traditional ine¢ ciency term. This may lead to imprecise results if part of the ine¢ ciency is due to features that do not change over time.
With respect to previous Swiss studies, the novelties of this paper are two. First, we propose an empirical strategy that provides information on e¢ ciency due to structural di¤erences related to the institutional form. Second, we sketch a theoretical model to disentangle the impact of institutional aspects from the behavior of managers on cost e¢ ciency.
3
Institutional forms in nursing home care
According to the ownership type, NFP NHs are usually categorized into pub-lic and private NHs. Although these types are supposed to re‡ect di¤erences in the control of funds and the production process, the classi…cation may not e¤ectively capture di¤erences in the organizational form. A more sophisticated insight looks at the institutional form, which underlines property rights or legal constraints a¤ecting di¤erent institutions. Hence, public-law NHs are public administrative units without a separate juridical status from the local public administration and are directly integrated into it. The governing body is rep-resented by local politicians (city council), while the executive arm is left to the municipality, which delegates it to a manager. Conversely, private-law NFP NHs usually take the form of a foundation. Generally, foundations are created by individuals or private legal entities. In some cases, local governments decide to create private-law NFP NHs. Therefore, when local governments set up a foundation to provide nursing home services, this is a private-law institution owned by the government. In both of these cases the governing body is the foundation council.
These institutional types apply to Switzerland where the provision of NH services is dominated by NFP institutions regulated at cantonal (state) level.
In some cantons the provision is further decentralized at the municipality level. In this case, each NH provides care to the residents of a given area. The choice of the NH does not depend on price and quality aspects since individuals are usually assigned to the NH in the former place of residence. Therefore, NHs generally operate as local monopolies, i.e. clients have no choice of NH. Prices are subsidized by the cantonal regulator, leading to excess demand and waiting lists. In the Swiss Canton of Ticino, where we focus this analysis, around 51% of NFP NHs are private-law organizations, and 49% are public-law organizations.
3.1 A theoretical approach
We assume that low managerial e¤ort translates into low e¢ ciency levels of NH
care.1 The total costs of the NH are described by the following equation:
~
C = ~ g(e), (1)
where ~ de…nes costs that are independent of managerial e¤ort, e. ~ is a random
variable that takes value with probability qz and with probability (1 qz),
with > . The subscript z indicates the institutional form, i.e. public-law (P u) or private-law NFP (P r). ~ depends, for instance, on political constraints, labor contracts, procedures, the location of the NH, and the mix of residents which are regulated by the law. g(e) is a function that measures the impact of manager’s e¤ort on costs. This depends on the di¤erence between the bene…t of e¤ort for the NH in terms of cost reduction, (e), and the cost of remunerating manager’s e¤ort through an increase in the wage. Hence, manager’s e¤ort reduces total
cost but may imply a higher wage, wz(e). Generally, the bene…t of e¤ort for the
NH o¤sets the cost of remunerating manager’s e¤ort. Therefore, the net e¤ect of e¤ort is expected to be a reduction in costs, i.e. g(e) > 0. To simplify the
analysis, we assume g(e) = (e) wz(e) = e.2
The regulator cannot directly observe the NH-speci…c and e. The true
value of and the optimal level of e¤ort to reduce costs can be inferred from the
1This approach is inspired by the early work of Haskel and Sanchis (1995), among others.
2
The level of e¤ort e is assumed to be bound in the interval e 2 [0; emax]; where emax =
observation of total costs C reported by the NH, which are then used to de…ne the …nancial budget. Consequently, the …nancial budget is de…ned as:
B E C j C .~ (2)
The governing board of the NH has the following utility function which is separable into patients’bene…ts (s) and …rm’s pro…ts ( ):
Uz = z + (1 z)s. (3)
z 2 (0; 1) captures institutional preferences that a¤ect the relative
impor-tance of pro…ts with respect to patients’bene…ts. For example, the board of a public-law NH may value the preferences of the whole voters’community while a private-law NFP board may value those of the donors or of particular groups of interest. These organizational constraints may not be ‡exible in the short run and may not be directly controlled by the manager. They generally require actions to be approved by the board.
Pro…ts are de…ned as (e) B C(e) and the manager’s utility is given by~
the following expression:
Um= [wz(e) (e)] + mUz( (e)); (4)
where (e) is disutility of e¤ort and m 2 (0; 1) is the manager’s share of the
goals of the board. The manager’s utility is additive in e¤ort and the degree of sharing of the board’s objectives, with w0z(e) 0, w00z(e) 0, 0(e) > 0 and
00(e) > 0. For simplicity, the reservation utility is assumed to be zero so that
the participation constraint of the manager is always satis…ed for any level of the wage.
3.1.1 Cost reduction e¤ort
The optimal choice of e¤ort for the manager is obtained from the …rst-order condition to maximize Eq. (4). We …rst substitute Eq. (1) and Eq. (2) into Eq.
(3). Using Eq. (3) we then replace Uz in Eq. (4), and …nally di¤erentiate Eq.
for e we get the equilibrium level of e¤ort as:3
0(e ) = w0
z(e ) + z m. (5)
In equilibrium the marginal cost of e¤ort is equal to the marginal bene…t of e¤ort. The marginal bene…t of e¤ort can be decomposed into two parts:
the marginal e¤ect of e¤ort on wage, w0z(e ), and the “altruistic” component
z m. The latter component includes cost-reduction e¤ort due to manager’s
type ( m) and cost-reduction e¤ort due to structural di¤erences by institutional
form ( z). Higher levels of e¤ort in equilibrium derive from higher incentives in
the wage structure, higher degrees of goal sharing ( m), and weaker preferences
for patients’ bene…ts ( z). Also, P u < P r and wP u0 (e ) wP r0 (e ) if public
boards put more weight on community bene…ts rather than pro…tability and tend
to compensate managers less for their e¤ort.4 The degree to which managers
working in private-law NFP NHs share the objectives of the council is expected to be higher than, or at least equal to, that of managers working in public NHs. This statement relies on factors suggested by di¤erent authors in the literature (Rose-Ackerman, 1996; Wilson, 1989). Managers working in foundations are expected to be more likely to be driven by altruistic motives and to be punished in case of poor performance, and are less likely to follow multiple objectives with which they may not agree.
3.1.2 Structural and managerial ine¢ ciency
To analyze di¤erences in costs between NH types we can decompose deviations of NH costs from total mean costs into deviations between groups (institutional
3
Note that the NH always reveals its true type. Assume that the disutility of e¤ort takes
the form (e) = e2
2, and the manager’s wage is w(e) = + ze; hence e = z + z m.
For C > , the regulator can infer that the NH is a high-cost type. The regulator sets
Bz = E(ez) = qz( )=2 (see footnote 2) and the NH makes pro…ts provided that
qz( )=2 < z+ z m. Conversely, for C the regulator correctly infers that the NH is a
low-cost type since C = emax> . Hence, Bz = E(ez) = qz( )=2. Again NHs
make pro…ts for levels of e¤ort qz( )=2 < z+ z m.
4In the past, the public administration was not able to link the performance of the manager
directly to the level of the salary. Nowadays, the introduction of New Public Management instruments allows for this link with some restrictions.
forms) and deviations within groups. Therefore, we can decompose cost devia-tions into structural (institutional) and managerial components.
We assume that there is an equal number of public-law and private-law NHs in the market. Therefore, looking at the equilibrium level of cost reduction, we can disentangle the institutional component from the NH-speci…c managerial component:
e e = (e^ e^z) + (^ez e ) ,^ (6)
where ^e is the mean cost reduction across institutional forms and ^ezis the mean
cost reduction within the same institutional form. The term ^ez e represents^
deviations from the mean cost reduction due to institutional-speci…c features (z),
and e ^ez represents deviations from the institutional-speci…c cost reduction
because of managerial e¤ort.
Assuming (e) = e22 and wz(e) = + ze and substituting into Eq. (6) we
get:
e e^ = [( z+ z m) ( z+ z^z)] + [( z+ z^z) (^ + ^ ^)]
= z( m ^z) + [( z+ z^z) (^ + ^ ^)] , (7)
where ^ = Pz=P r;P u^z=2, ^ = Pz=P r;P u z=2, and ^ = Pz=P r;P u z=2 are
means between groups, and ^z = Pm mz is the within-group mean. If the
distribution of managerial characteristics is the same across institutional types,
then ^ = ^z. Hence, [( z+ z^z) (^ + ^ ^)] = ( z ^) + ^z( z ^) is the
di¤erence in cost reduction due to NH institutional features, and z( m ^z)
is the di¤erence in cost reduction due to NH-speci…c managerial characteristics.
Using (7) and assuming ^ = ^z, we can write total deviations from mean
costs as: ~ C C^ = ~ e ^ e^ (8) = h ~ ^z + ^z ^ i + z(^z m) + [(^ z) + ^z(^ z)] .
In the above equation, ~ ^ are deviations from average structural costs that
are average structural costs over all institutional types. These deviations can be
decomposed into a …rm-speci…c component ~ ^z and deviations from
insti-tutional form-speci…c structural costs ^z ^ , where ^z = qz +(1 qz) . The
other di¤erences in costs across NHs can be decomposed into a managerial com-ponent and another structural comcom-ponent controlled by the institutional form.
The former component is captured by z(^z m). The latter component is
de…ned by the term [(^ z) + ^z(^ z)]. Di¤erences in costs due to
insti-tutional constraints can then be separated from other NH-speci…c (managerial) aspects. Note that only part of the (structural) costs due to the institutional form are exogenous. The remaining part of the structural costs are generated by institutional aspects that a¤ect the behavior of managers.
To disentangle the managerial and the structural cost components and com-pare e¢ ciency levels between public-law and private-law NHs, we propose an empirical approach. This is based on the speci…cation of a cost function, which is then estimated on the whole population of public-law and private-law NFP NHs from the Swiss canton of Ticino. As we will discuss later in detail, the two structural components and the managerial component included in Eq. (8) are measured by di¤erent terms in the empirical cost model speci…cation.
Note that our theoretical model assumes that the regulator can observe the institutional form as well as the true type of the NH. Consequently, the regulator can assign di¤erent budgets not only to di¤erent NH types of the same institu-tional form, but also to di¤erent instituinstitu-tional forms. Hence, the structural cost component can be separated from the managerial component. The empirical approach that follows actually try to disentangle these two components. A sim-ilar approach could be applied by the regulator using available cost data. This will provide a measure of di¤erent types of ine¢ ciency and, therefore, could be used to re…ne the budget.
4
The empirical analysis
4.1 E¢ ciency measurement
In order to estimate the level of overall productive e¢ ciency it is possible to use parametric and non-parametric frontier analysis. In non-parametric approaches, like Data Envelopment Analysis (DEA), the production or cost frontier is con-sidered as a deterministic function of the observed variables. Conversely, in parametric approaches, such as Stochastic Frontier Analysis (SFA), the
produc-tion or cost frontier is estimated using econometric methods.5
The major merit of DEA is that the approach does not impose a priori parametric restrictions on the functional form of the cost frontier, nor does it rely on distributional assumptions of the error term to identify the e¢ ciency. However, DEA is deterministic and therefore does not account for measurement error. On the other hand, SFA speci…es an econometric model for the cost frontier and assigns part of the deviation from the frontier to measurement error in the data. SFA also embeds the traditional statistical properties which can be used to guide the model speci…cation, while this is not possible in DEA. Further, parametric methods are more attractive to analyze the level of cost e¢ ciency in the nursing home sector, because they allow us to deal, at least partially, with the presence of unobserved heterogeneity in the production of health care services. Finally, SFA resorts to economic theory to de…ne the cost frontier, rather than being guided by the data only. For these reasons, SFA is our preferred approach.
The underlying idea of SFA is to use the residual to gather information regarding ine¢ ciency. The residual "i captures the deviation of both
measure-ment error and ine¢ ciency. SFA focuses on techniques to separate the two components. These techniques are based on the assumption that the two error components follow di¤erent distributions: the random component is assumed to be normally distributed, while ine¢ ciency is assumed to be right-skewed. SFA models can be distinguished in models for cross-sectional data and models for
5
See, for instance, Kumbhakar and Lovell (2003) and Murillo-Zamorano (2004) for a general presentation of di¤erent methodologies.
panel data. Panel data models were …rst introduced by Pitt and Lee (1981) and Schmidt and Sickles (1984), who interpreted the …rm-speci…c e¤ect as in-e¢ ciency. In the following years models were extended to allow in-e¢ ciency to change over time (e.g., Battese and Coelli, 1992; Cornwell et al., 1990; Sickles, 2005), though ine¢ ciency and time-invariant unobserved heterogeneity could never be disentangled. Unobserved heterogeneity captures characteristics of the NHs such as location or catchment population that a¤ect their costs but are not under the control of the …rm, and therefore should not be attributed to ine¢ cient behavior.
The recently developed True Random e¤ect (TRE) and True Fixed e¤ect (TFE) models proposed by Greene (2005) are an alternative to the panel data models proposed by Pitt and Lee (1981) and Schmidt and Sickels (1984). In the TRE and TFE models the original stochastic frontier model proposed by Aigner et al. (1977) is extended by adding …xed and random individual e¤ects, respec-tively. The TRE and TFE produce values of the level of e¢ ciency that vary over time (transient). In these models the individual …xed or random e¤ects take into account all unobserved variables that are time invariant. Therefore, in these models any time-invariant (persistent) component of ine¢ ciency is com-pletely absorbed in the …rm-speci…c constant terms. When the production of health care services is characterized by a structurally ine¢ cient use of inputs, these models will produce relatively high levels of estimated cost e¢ ciency.6 For the current analysis we use TRE rather than TFE due to the convergence issues encountered with the TFE model. As we will discuss later, we are able to disen-tangle structural cost di¤erences from time-varying ine¢ ciency by introducing a dummy variable for the institutional form in our cost model.
6
Note that some scholars have recently proposed an extension of the TRE model, the generalized TRE model that allows for the possibility of estimating the level of persistent and transient e¢ ciency of an economic agent at the same time. See, for instance, Colombi et al. (2014) and Filippini and Greene (2015).
4.2 Detailing the cost function
SFA has been applied to assess the performance of very diverse industries (e.g., Castiglione and Infante, 2014; Charoenrat and Harvie, 2014; Danquah and Ouattara, 2015). Our cost function assumes that NHs transform three inputs -capital, labor and material - into a single output, measured by the number of
patient-days of nursing care.7 A similar speci…cation is used by Di Giorgio et
al. (2014) to investigate the e¤ects of a change in the payment system using a cost-regression approach.
We rule out strategic interactions among NHs and their e¤ect on the demand of residents since NHs are local monopolies. The number of patient-days can be considered a good indicator of the level of production after controlling for di¤erences in quality. The total costs function depends on output (Y ), the prices of labor, capital and material (Pl; Pk; Pm), two output characteristics
(Q1; Q2), a dummy variable (Z) which takes value equal to 1 for public NHs
and 0 otherwise, and time dummies for the years 2002-2005 ( ) which should capture technological progress in each year:8
C = f (Y; Pl; Pk; Pm; Q1; Q2; Z; ). (9)
The price of labor is calculated as the weighted average wage of di¤erent professional categories employed in the NH (doctors, nurses, administrative, and technical sta¤) to avoid multicollinearity problems that may arise with labor prices for di¤erent categories. The amount of sta¤ as well as their certi…cation is de…ned by the cantonal law as a function of residents’ case-mix. This rules out the possibility of increasing cost e¢ ciency by hiring lower certi…ed nurses.9
7Output and input prices are assumed to be exogenous. Output is exogenous because NHs
have to accept all residents in a given area. The price of labor is de…ned by labor contracts at the cantonal level, which are equal for all NHs in the sample. Also, the same amortization schedule and interest rates are applied.
8
In a non-competitive environment such as the Swiss one, there is no reason to assume that NHs minimize costs. In this case, the estimated cost function is a “behavioral cost function” (Evans, 1971) and can still be used to make a comparison among …rms. Moreover, by estimating a total costs function instead of a variable costs function we avoid the risk related to a possible high correlation between capital stock and output leading to a positive relationship between variable cost and capital stock (Filippini, 1996).
The price of capital is calculated as the sum of mortgage costs, amortization, and costs related to capital purchases divided by the capital stock, which is approximated by the number of beds. The price for material is computed by taking the remaining costs and dividing them by the number of meals provided each year. This item mainly includes costs for food and residency. Other costs included are energy, water and administrative costs.
Additionally, we control for some output characteristics that may explain
cost di¤erences across NHs.10 Q1 is an index which measures average patient
assistance by means of normal daily activities such as eating, personal care or physiological activities. This is calculated on a yearly basis by the Regional Department of Public Health (RDPH). Patients are classi…ed in one out of …ve categories according to their severity level. Each patient is assigned a value between 0 and 4, where higher values indicate more severe cases.
Q2 is the nursing sta¤ ratio, that is the ratio between the number of nurses
employed and the number of nurses that should be employed according to the
guidelines of the RDPH (optimal amount of sta¤).11 Because nursing care is
a labor-intensive service, sta¢ ng level has been recognized as a good indicator
for quality.12 Consequently, the nursing sta¤ ratio is regulated by the RDPH.
To avoid worsening quality, NHs are not allowed to deviate from the suggested
number of nurses by more than 10%. Since labor cost represents the major
cost of production (cfr. section 3.2), a small change in the nursing sta¤ ratio may a¤ect total cost considerably. For this reason, NHs with high costs may decide to decrease the proportion of workers. On the other hand, e¢ cient NHs may hire new workers or increase the working time in order to justify additional the possibility of reducing costs by hiring younger sta¤ members. Due to lack of data, we cannot rule out this strategy.
1 0
In order to estimate a cost function, either the output is assumed to be homogenous or we need to control for service intensity and patients’characteristics (Birnbaum et al., 1981).
1 1As compared to other quality indicators related to sta¤ levels, our indicator is conceptually
di¤erent. The nursing sta¤ ratio is the deviation from the optimal number of nurses that should be employed according to guidelines rather than the number of sta¤ nurses actually employed.
1 2In a recent review, Bostick et al (2006) show a positive association between sta¢ ng levels
and quality of care, and the link between sta¢ ng levels and direct indicators of quality, such as functional ability, pressure ulcers and weight loss.
costs to the regulatory authority. The endogeneity of the nursing sta¤ ratio is con…rmed by the robust Durbin-Wu-Hausman test performed using the lagged
Q2 as instrumental variable (Cameron and Trivedi, 2005). The null hypothesis
of exogenous Q2 is rejected at any standard levels of signi…cance. To address
the endogeneity problem, lagged values of the nursing sta¤ ratio are used.13
Given that Q2 is determined during the operating year (for example through
‡exible working time) while the budget is de…ned at the beginning of the year, the lagged value of Q2 is expected to be a valid instrument.14
The dummy variable Z captures structural cost di¤erences across
institu-tional forms. This variable can be assumed to be exogenous for two main
reasons. First, organizational form di¤erences are mainly driven by historical reasons. Precisely, nursing home care was initially provided by religious foun-dations. Later, increasing demand for nursing home care and lack of supply led local governments to build new NHs. Second, NHs changing institutional form are not allowed to bene…t from …nancial advantages.
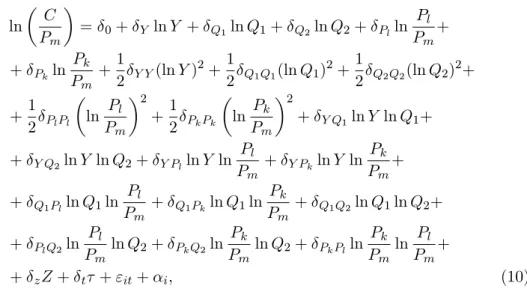
In order to impose as few restrictions as possible, we adopt a ‡exible translog functional form approximated at the median value, a less sensitive statistic to
outliers than the mean.15 Input prices and total costs are divided by the
mate-rial price in order to satisfy the homogeneity condition in input prices.16 The
1 3
This is a rather simple approach to tackle endogeneity in frontier analysis where other classical solutions, such as two-stage least-squares, are not completely satisfactory. See Greene (2010) for a detailed discussion on endogeneity issues in frontier models.
1 4
The output of the test statistic on the endogeneity of Q2 is: F (1; 44) = 11:52 (p = 0:002).
The endogeneity test is performed on the cost model with …rst order coe¢ cients. The statistics
provided give some evidence that the lagged value is a valid instrument. The …rst stage
regression summary indicates that the lagged value explains 40% of the variability in Q2.
The Stock and Yogo test at 5% level of tolerance greatly rejects the null hypothesis of weak instrument (F=80.57 >16.38). The same analysis performed on the two-years lagged value of Q2suggests that this instrument is likely to be weak.
1 5
A ‡exible translog functional form is adopted, for instance, by Rosenbaum et al. (2001) to investigate the e¤ects on costs of relocation of residents from NHs to less expensive assisted care facilities.
1 6The cost function is linear homogenous of degree 1 in input prices when a 10% increase in
stochastic translog approximation to Eq. (9) for the TRE model is: ln C Pm = 0+ Y ln Y + Q1ln Q1+ Q2ln Q2+ Plln Pl Pm + + Pkln Pk Pm +1 2 Y Y(ln Y ) 2+1 2 Q1Q1(ln Q1) 2+1 2 Q2Q2(ln Q2) 2+ +1 2 PlPl ln Pl Pm 2 +1 2 PkPk ln Pk Pm 2 + Y Q1ln Y ln Q1+ + Y Q2ln Y ln Q2+ Y Plln Y ln Pl Pm + Y Pkln Y ln Pk Pm + + Q1Plln Q1ln Pl Pm + Q1Pkln Q1ln Pk Pm + Q1Q2ln Q1ln Q2+ + PlQ2ln Pl Pm ln Q2+ PkQ2ln Pk Pm ln Q2+ PkPlln Pk Pm ln Pl Pm + + zZ + t + "it+ i; (10)
where "it= uit+ vit, with uit being the time-varying ine¢ ciency term assumed
to be an iid random variable with half-normal distribution, that is a normal
dis-tribution truncated at zero. vit is a stochastic component normally distributed,
and i is an iid random component in a random-e¤ects framework. The latter
term should capture all time-invariant unobserved factors.
Table 1 summarizes the econometric speci…cations employed in this paper. Following the estimation of the parameters, we check the concavity condition in input prices.
4.3 Data and descriptive statistics
Our study exploits an unbalanced panel data set of 50 NHs operating in a region of Switzerland (canton Ticino) over a …ve-year period (2001-2005). The focus on one Swiss canton is justi…ed by a relatively high degree of homogeneity in the data, since data imputation processes and some regulatory aspects vary across cantons. Using data from 26 cantons with large di¤erences in the organization and the regulation of health care services may undermine the comparability of the results across institutional forms. Finally, we can exploit some cantonal-speci…c information on costs that is not available at the federal level. Clearly, the period of time to study is limited. However, as compared to previous studies
on Swiss NHs (e.g., Crivelli et al., 2002), our dataset includes full information on capital costs for public NHs that was not available before.17
All NHs in the sample are medicalized institutions (skilled NHs) under the cantonal nursing home planning. The cantonal planning de…nes daily rates, the minimum necessary infrastructure, and the amount and certi…cation of sta¤ based on residents’needs to ensure high-quality standards. It also de…nes supply capacity in terms of beds, and subsidies to public-law and private-law NFP NHs. Consequently, the production process is highly homogenous and comparable across NHs.
Data are extracted from annual reports delivered to the RDPH by regulated
NHs. NHs with foyers are excluded from our sample.18 One NH shows
unrea-sonable values, hence it is also excluded from the analysis.19 The …nal sample
contains data on 45 NHs, 22 private-law NFP NHs and 21 public-law NHs,20
with a total number of observations equal to 215. The number of observations used for estimation is 210. This is due to the fact that we use the lagged value
of Q2 and for …ve NHs we do not have information for the year 2000.
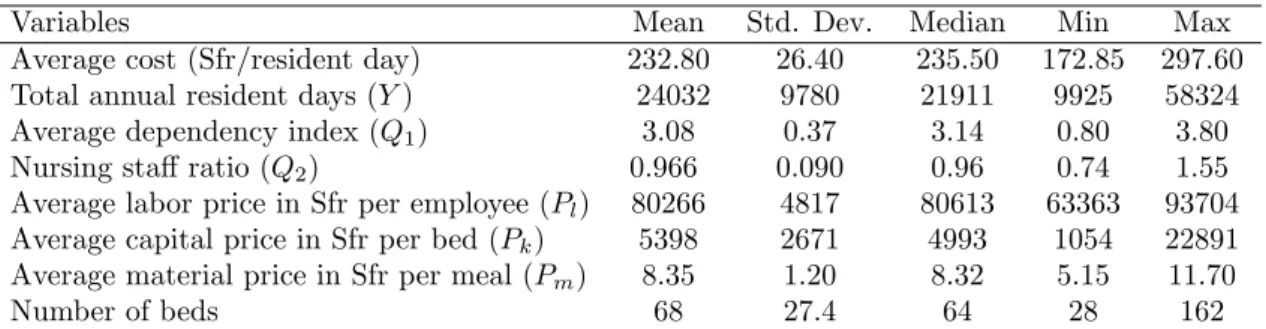
Table 2 presents the summary statistics for the main costs and input vari-ables of interest: mean, standard deviation, median, minimum and maximum values for our sample. All input prices, total cost and variable cost are in‡ated to 2005 constant currency units (Swiss francs) using the national Consumer Price Index. The average cost per resident day in the most expensive NH is almost twice the average cost of the least expensive home, with an average of about 233 Swiss francs (Sfr). This di¤erence is at least partially explained by the large heterogeneity in NHs characteristics. In particular, facilities vary in
1 7These additional data on amortization costs of public NHs have been made available just
recently.
1 8
Foyers are external residential apartments where nursing care is provided to the most “in-health” patients. Since the production process may di¤er substantially when a considerable share of patient-days is spent in foyers (> 10%), these observations are dropped.
1 9
This NH was initially a for-pro…t institution and, consequently, changed the regulation regime. Since for-pro…t NHs provide luxury residential services, their production process is hardly comparable with the production process of other NHs.
2 0
The reported number of NHs for each institutional form is the average number of homes over the whole period considered. The number of private-law NFP NHs ranges from 21 to 23, while public-law NHs vary between 20 and 22.
size. The number of beds ranges from a minimum of 28 to a maximum of 162, which leads to a high standard deviation also in the total annual resident days. Di¤erences in case-mix characteristics are also remarkable: the average patient dependency index ranges from 0:8 to 3:8, even though mean and median values are very close. As expected, the nursing sta¤ ratio is close to 1. In fact, NHs are supposed to follow the guidelines of the RDPH and to employ as many nurses as suggested. Large variations are observed for all input prices. The price of capital shows the greatest variation, mostly explained by investments made to renew the facility. The labor price shows the average yearly wage of the sta¤ and varies between Sfr 63; 000 and Sfr 94; 000. The mean price for meals is Sfr 8:40 and ranges between Sfr 5 and Sfr 12. These reasonable values support our speci…cation of material price. Labor costs represent 82% of total costs, whereas capital costs and material costs account for 6% and 12%, respectively.
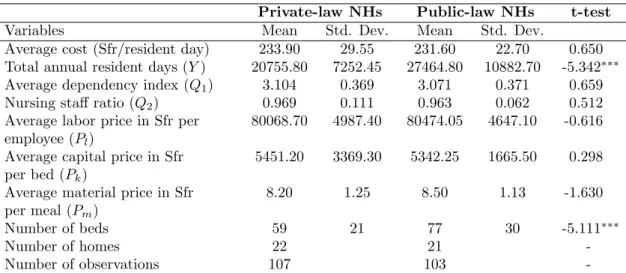
To focus on di¤erences between private-law and public-law NHs, we calculate the mean and the standard deviation of the above variables separately for each subsample (see Table 3). In the last column of Table 3, we report the results of a two-sided t-test under the null hypothesis of equal means between the two groups. The statistics show that public-law and private-law NFP NHs are similar in many aspects, which also explains the similarity in observed mean costs per resident. NHs run under di¤erent organizational forms face similar residents and input prices. The only statistically signi…cant di¤erence is found in the average number of beds. Private-law and public-law NHs have, respectively, 59 and 77 beds on average, suggesting that public NHs have decreasing average costs. Regarding output characteristics, the two groups do not show signi…cant di¤erences either in the nursing sta¤ ratio or in the case-mix. Although data do not show important di¤erences between public-law and private-law NFP NHs, unobserved factors related to costs may still result in di¤erent performance. For
example, Q2 may capture only part of quality di¤erences. Hence, NHs providing
4.4 Measuring the impact of the institutional form
In this analysis we investigate structural and managerial di¤erences between private-law and public-law NHs by means of SFA. These models estimate a benchmarking frontier against which the actual performance of the …rms in the
sample is compared.21 Our strategy to measure structural and managerial
dif-ferences relies on the literature on exogenous factors in the analysis of e¢ ciency
and considers two approaches.22 The …rst approach relies on the assumption
that the institutional form a¤ects the degree of ine¢ ciency directly, but not the production process. The underlying assumption is that performance dif-ferences are due to factors under control of the manager; for this reason they are interpreted as managerial di¤erences (Coelli et al., 1999). In this case, the performance of each NH is measured in relation to a single best practice frontier and the ine¢ ciency term is modeled as a function of exogenous factors. The second approach assumes that exogenous factors are not under control of the manager and therefore shift the production function up- or downward, leading to a direct impact on total costs. For this reason they are interpreted as structural di¤erences. By including a dummy variable for the institutional form directly into the main cost equation, we allow for two distinct best practice frontiers.23
Which approach to use depends on the features of the sector under analy-sis, on the research question, and on the assumption of the estimation model. In the present analysis, we combine these approaches to simultaneously assess structural and managerial di¤erences due to the institutional form, and apply the TRE model to take unobserved heterogeneity into account (Greene, 2005). Structural di¤erences are interpreted as a shift of the production function and
2 1
For an application of stochastic frontier models to health care institutions, see for instance Berta et al. (2010).
2 2The ideal situation to study di¤erences due to the institutional form would be to compare
institutions with the same ownership form but di¤erent institutional forms; i.e., government-run NHs versus NHs owned by the local government but government-run as foundation (public foundations). However, due to the small sample size of public foundation NHs (6:7%), we are not able to use this identi…cation strategy.
2 3A similar approach has been applied in the literature on hospital e¢ ciency in order to
study the impact of ownership (Grosskopf and Valdmanis, 1987) and size (Ozcan at al., 1998), although not combined with a TRE model.
measured by including a dummy variable in the deterministic part of the fron-tier. Managerial di¤erences are investigated by using nonparametric tests on the mean ine¢ ciency obtained from the TRE model, as in Farsi et al. (2008). We also model the time-varying ine¢ ciency in the TRE model as a function of the institutional form. However, the results obtained with di¤erent softwares (NLOGIT and STATA) are not robust and we feel compelled to not use this
approach, even though it is correct from an econometric point of view.24
We estimate TRE models with and without Mundlak correction and, for comparison purposes, we also run regressions without the institutional dummy
variable in the deterministic part of the frontier.25 Consistent estimates of
RE models rely on the assumption of no correlation between the individual e¤ects and the covariates. This means that the ine¢ ciency level is uncorrelated with input choices and output. As shown by Farsi et al. (2005), the Mundlak correction can be used in frontier models to address the bias deriving from this correlation. This correction is not used in Farsi et al. (2008). Instead, the …xed e¤ects model allows for partial correlation (Cameron and Trivedi, 2010). However, due to the low within-variation of the covariates our estimates would be imprecise (Cameron and Trivedi, 2005; Clark and Linzer, 2014). Moreover, the …xed e¤ects model does not allow us to estimate the coe¢ cient of time-invariant factors, such as the institutional form. Note that stochastic frontier models are robust with respect to distributional assumptions of the error components when generating comparisons of group mean ine¢ ciencies (Folland and Ho‡er, 2001).
4.5 Results
Table 4 reports the results of our two approaches (Model 1 and Model 2 es-timated using NLOGIT Version 5). Model 1 estimates a single benchmarking frontier, while Model 2 includes the dummy for the institutional form in the
2 4Detailed information is available upon request.
2 5We use an ad-hoc Mundlak formulation which consists of including the mean values of
those variables that lead to a rejection of the Hausman test. This approach was developed to save degree of freedom in the presence of small sample size. The p-value of the Hausman test after including the Mundlak correction is 0:0613. The variables included are lnQ1, lnPl,
deterministic part of the frontier. Models 1b and 2b incorporate the Mundlak correction.
All the …rst-order coe¢ cients are highly signi…cant and positive, as well as some of the interaction terms which support the translog functional form. The estimated coe¢ cients are very robust across the two model speci…cations. More
severe patients are more costly to treat (Q1) and higher sta¢ ng levels also
lead to higher costs. The coe¢ cient of Q1 loses signi…cance when its mean is
included in the Mundlak speci…cation. This is due to the fact that the mean captures the majority of the variation. The Mundlak coe¢ cients are all highly statistically signi…cant, with signi…cance levels between 1% and 5%. A rising trend is observed in year dummy coe¢ cients, which suggests that technological progress or unobserved factors (e.g. quality improvements) lead to higher costs each year.
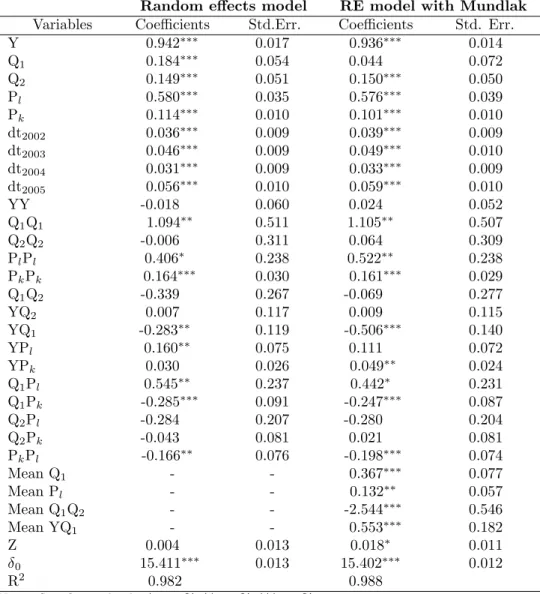
The main result of interest is the e¤ect of the institutional form. The e¤ect of structural di¤erences on costs is shown in Model 2. When we do not correct for correlated ine¢ ciency, we do not …nd evidence of cost di¤erences between public-law and private-public-law NHs. However, after correcting for the bias, the dummy is statistically signi…cant at 1% level and shows that public-law NHs are more costly by 2%. This …nding is con…rmed also with traditional regression models (Table 5), although the level of signi…cance decreases at 10%.26
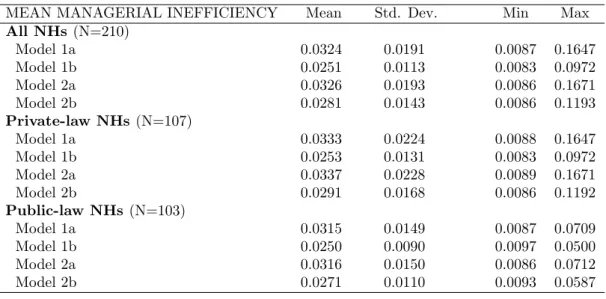
To investigate managerial di¤erences across institutional forms, we apply the Kruskal-Wallis test on the estimated ine¢ ciency scores, which are presented in Table 6 for all NHs, and separately for public-law and private-law organi-zations. Mean ine¢ ciency is about 3%, both for public-law and private-law NHs and across all model speci…cations, and reaches up to 17%. The results from the Kruskal-Wallis test con…rm that there are no systematic di¤erences by institutional form in mean ine¢ ciency (see Table 7). These results suggest that di¤erences in costs across institutional forms are mainly due to structural di¤erences rather than managerial performance.
2 6
A model with ownership type (private vs. public) instead of institutional form was also considered. The results showed that ownership type does not a¤ect total costs.
In the last rows of Table 4, we provide the estimated constant ( 0), the
standard deviation of the individual e¤ects ( ), the standard deviation of the
error term ( ), and the ratio ( ) between the standard deviation of the ine¢
-ciencies ( u) and the standard deviation of the stochastic term ( v). Note that
all these components are highly signi…cant. Since the value of de…nes the
rel-ative contribution of the ine¢ ciency term with respect to the stochastic term, a positive and statistically signi…cant number supports the existence of the two
error components.27 The di¤erence in the coe¢ cient between the two models
arises because of the di¤erent model speci…cation.
Our results indicate that the Hessian matrix of the estimated cost functions with respect to input prices calculated at the approximation point is not neg-ative semi-de…nite. Thus, the concavity condition is not satis…ed in any of the speci…cations, meaning that …rms’ strategies are not responsive to changes in input factor prices. This can be explained by the fact that input choices in Swiss NHs are substantially limited by regulation (Filippini and Farsi, 2004). The in-terpretation of the estimated coe¢ cients in Table 4 relies on the behavioral cost framework proposed by Bös (1986).
5
Conclusions
It has been suggested that the consumer surplus can be lower in the mixed (public and private) oligopoly than in private oligopoly when public …rms are as e¢ cient as private …rms. However, the government may not privatize the public …rm unless its e¢ ciency is low enough as compared to private …rms (Bárcena-Ruiz, 2012). To what extent do public NHs di¤er from private NFP NHs in terms of cost e¢ ciency? Policy-makers in several European countries are cur-rently debating the advantages of replacing public organizations with private organizations (e.g., foundations) for the care of elderly people. Restructuring
2 7
We analyzed the skewness of the OLS residuals. As Waldman (1982) shows, when the OLS residuals are skewed in the “wrong” direction, the results from the maximum likelihood estimator are those of a simple OLS rather than a cost frontier. The normality test shows that our OLS residuals are right skewed (0:23) and the null hypothesis of normally distributed residuals can be rejected at 99% signi…cance level. Therefore, our data and model speci…cation
policies have shown their limitation as a viable strategy for controlling public health expenditure, at least in the hospital sector (Piacenza et al., 2010). Finan-cial pressure on health care budgets is increasing, and little evidence is available on the performance of di¤erent types of NFP NHs.
Through this study, we investigated di¤erences in cost e¢ ciency between institutional forms of nursing home care using data from the Swiss canton of Ticino. Our main purpose was to disentangle di¤erences in cost e¢ ciency due to structural (time-invariant) aspects from managerial (time-varying) aspects, which is generally neglected in the related literature. To this end, we …rst esti-mated a cost frontier based on a TRE model. This empirical strategy performs well in the presence of latent heterogeneity and time-varying ine¢ ciency. How-ever, the fact that structural di¤erences are captured by the individual e¤ects may be a limitation. Therefore, we proposed an alternative empirical strategy by accounting for the institutional form in the deterministic part of the cost frontier. We believe this is a valid approach to assess the impact of organiza-tional characteristics on the performance of NHs in the presence of unobserved heterogeneity.
We found that structural di¤erences lead to higher costs of public-law NHs as compared to private-law NHs. However, these cost di¤erences are relatively small. Moreover, this may be due to the fact that public-law NHs face more political constraints than private-law NHs because the political system attaches a value to factors such as governance procedures, location and choice of residents. Conversely, we found no evidence of systematic managerial di¤erences between public-law and private-law NHs. One possible explanation for this result is
the extensive regulation that a¤ects all NHs in the region. Since costs are
tightly controlled by the regulator, little room is left for management discretion. Another explanation may be that private nonpro…t and public NHs face similar constraints. Foundation councils set restrictions on the decision-making power of their managers like in public NHs. Finally, relatively small cost di¤erences may be due to unobserved quality di¤erences between public and private NHs.
NHs tends to reduce the costs for elderly care, although the reduction is quite small. From an empirical point of view, our …ndings show the importance of testing for both structural and managerial di¤erences in costs between insti-tutional forms. Because of data availability, our study was limited to a short period of time (5 years). Therefore, changes in e¢ ciency that may require a longer time to occur are not captured. Further research using longer datasets is needed to disentangle more precisely the di¤erences in structural and managerial costs across organizational forms of long-term care. Finally, our …ndings cannot be easily generalized to other regions since they may not re‡ect structural and managerial cost di¤erences in other regulatory settings.
Acknowledgments
Earlier drafts of this work were presented at the XII European Workshop on E¢ ciency and Productivity Analysis (Verona, June 2011) and the 8th World Congress on Health Economics (Toronto, July 2011). We are grateful to the participants of these conferences, Andrew Street, two anonymous reviewers and the associated editor for their helpful comments and suggestions. Any error is the fault of the authors.
References
Aigner, D., Lovell, C., Schmidt, P., 1977. Formulation and estimation of stochastic frontier production function models. Journal of Econometrics, 6, 21-37.
Bárcena-Ruiz, J.C., 2012. Privatization when the public …rm is as e¢ cient as private …rms, Economic Modelling, 29(4), 1019-1023.
Battese, G.E., Coelli, T.J., 1992. Frontier production functions, technical e¢ ciency and panel data: With application to paddy farmers in India. Journal of Productivity Analysis, 3, 153-169.
Berta, P., Callea, G., Martini, G., Vittadini, G., 2010. The e¤ects of upcoding, cream skimming and readmissions on the Italian hospitals e¢ ciency: A population-based in-vestigation. Economic Modelling, 27, 812-821.
Birnbaum, H., Bishop, C., Lee, A., Jensen, G., 1981. Why do nursing home costs vary? The determinants of nursing home costs. Medical Care, 19, 1095-1107.
Bös, D., 1986. Public enterprise economics. Amsterdam: North-Holland.
Bostick, J.E., Rantz, M.J., Flesner, M.K., Riggs, C.J., 2006. Systematic review of studies of sta¢ ng and quality in nursing homes. Journal of the American Medical Directors Association, 7(6), 366-376.
Cameron, A.C., Trivedi, P.K., 2005. Microeconometrics. Methods and applications. New York: Cambridge University Press.
Cameron, A.C., Trivedi, P.K., 2010. Microeconometrics using Stata. Revised edition. Texas: Stata Press
Castiglione, C., Infante, D., 2014. ICTs and time-span in technical e¢ ciency gains. A stochastic frontier approach over a panel of Italian manufacturing …rms. Economic Modelling, 41, 55-65.
Charoenrat, T., Harvie, C., 2014. The e¢ ciency of SMEs in Thai manufacturing: A stochastic frontier analysis. Economic Modelling, 43, 372-393.
Chou, S., 2002. Asymmetric information, ownership and quality of care: an empirical anaysis of nursing homes. Journal of Health Economics, 21, 293-311.
Clark, T.S., Linzer, D.A., 2014. Should I use …xed or random e¤ects? Political Science Research and Methods, 3(2), 399-408.
Coelli, T., Perelman, S., Romano, E., 1999. Accounting for environmental in‡uences in stochastic frontier models: with application to international airlines. Journal of Productivity Analysis, 11, 251-273.
Colombi, R., Kumbhakar, S., Martini, G., Vittadini, G., 2014. Closed-skew normality in stochastic frontiers with individual e¤ects and long/short-run e¢ ciency. Journal of Productivity Analysis, 42(2), 123-136.
Cornwell, C., Schmidt, P., Sickles, R., 1990. Production frontiers with cross-sectional and time-series variation in e¢ ciency levels. Journal of Econometrics, 46, 185-200. Crivelli, L., Filippini, M., Lunati, D., 2002. Regulation, ownership and e¢ ciency in the Swiss nursing home industry. International Journal of Health Care Finance and Economics, 2, 79-97.
Danquah, M., Ouattara, B., 2015. What drives national e¢ ciency in sub-Saharan Africa, Economic Modelling, 44, 171-179.
Di Giorgio, L., Filippini, M., Masiero, G., 2014. Implications of global budget payment system on nursing home costs. Health Policy, 115, 237-248.
Evans, R., 1971. "Behavioural" cost functions for hospitals. The Canadian Journal of Economics, 4, 198-215.
Farsi, M., Filippini, M., 2004. An empirical analysis of cost e¢ ciency in non-pro…t and public nursing homes. Annals of Public and Cooperative Economics, 75(3), 339-365. Farsi, M., Filippini, M., Kuenzle, M., 2005. Unobserved heterogeneity in stochastic cost frontier models: an application to Swiss nursing homes. Applied Economics, 37, 2127-2141.
Farsi, M., Filippini, M., Lunati, D., 2008. Economies of scale and e¢ ciency measure-ment in Switzerland’s nursing homes. Swiss Journal of Economics and Statistics, 144, 359-378.
Filippini, M., 1996. Economies of scale and utilization in the Swiss electric power distribution industry. Applied Economics, 28, 543-550.
Filippini, M., Greene, W., 2015. Persistent and transient productive ine¢ ciency: a max-imum simulated likelihood approach. Journal of Productivity Analysis, DOI 10.1007/ s11123-015-0446-y.
Exploiting the dual to homothetic production. Health Economics, 10(8), 683-698. Grabowski, D.C., Huskamp, H. A., Stevenson, D.G., Keating, N.L., 2009. Ownership status and home health care performance. Journal of Aging & Social Policy, 21(2), 130-143.
Grabowski, D.C., Feng, Z., Hirth, R., Rahman, M., Mor, V., 2013. E¤ect of nursing home ownership on the quality of post-acute care: an instrumental variables approach. Journal of Health Economics, 32, 12-21.
Greene, W., 2005. Reconsidering heterogeneity in panel data estimators of stochastic frontier model. Journal of Econometrics, 126, 269-303.
Greene, W., 2010. A stochastic frontier model with correction for sample selection. Journal of Productivity Analysis, 34, 15-24.
Grosskopf, S., Valdmanis, V., 1987. Measuring hospital performance. A non-parametric approach. Journal of Health Economics, 6, 89-107.
Hart, O., Schleifer, A., Vishny, R., 1997. The proper scope of government: theory and an application to prisons. The Quarterly Journal of Economics, 112, 1127-1161. Haskel, J., Sanchis, A., 1995. Privatization and X-ine¢ ciency: a bargaining approach. The Journal of Industrial Economics, 43, 301-321.
Hillmer, M.P., Wodchis, W.P., Gill, S.S., Anderson, G.M., Rochon, P.A., 2005. Nursing home pro…t status and quality of care: is there any evidence of association? Medical Care Research and Review, 62(2), 139-166.
Holmes, J., 1996. The e¤ects of ownership and ownership change on nursing home industry costs. Health Services Research, 31, 327-46.
Kapur, K., Weisbrod, B., 2000. The roles of government and nonpro…t suppliers in mixed industries. Public Finance Review, 28, 275-308.
Knox, K.J., Blankmeyer, E.C., Stutzman, J.R., 2002. Organizational e¢ ciency and quality in Texas nursing facilities. Health Care Management Science, 6, 175-188. Kumbhakar, S.C., Lovell, C.A.K., 2003. Stochastic Frontier Analysis. Cambridge Uni-versity Press.
Murillo-Zamorano, L.R., 2004. Economic e¢ ciency and frontier techniques. Journal of Economic surveys, 18(1), 33-77.
homes: an analysis of relationships among pro…t, quality, and ownership. Medical Care, 41(12), 1318-1330.
Ozcan, Y., Wogen, S., Mau, L., 1998. E¢ ciency evaluation of skilled nursing facilities. Journal of Medical Systems, 22, 211-224.
Piacenza, M., Turati, G., Vannoni, D., 2010. Restructuring hospital industry to control public health care expenditure: The role of input substitutability. Economic Modelling, 27(4), 881-890.
Pitt, M., Lee, L., 1981. The measurement and sources of technical ine¢ ciency in Indonesian weaving industry, Journal of Development Economics, 9, 43-64.
Rose-Ackerman, S., 1996. Altruism, nonpro…ts, and economic theory. Journal of Eco-nomic Literature, 34, 701-728.
Santerre, R.E., Vernon, J.A., 2007. Ownership form and consumer welfare: evidence from the nursing home industry. Inquiry 44, 381-399.
Rosenbaum, D.I., Lamphear, C.F., Rebeck, K., 2001. The e¤ects of acuity and utiliza-tion on nursing home costs. Review of Industrial Organizautiliza-tion, 19(3), 279-294.
Schlesinger, M., Gray, BH., 2006. How nonpro…ts matter in American medicine, and what to do about it. Health A¤airs, 25(4), W287-W303.
Schmidt, P., Sickles, R., 1984. Production frontiers and panel data. Journal of Business and Economic Statistics, 2, 367-374.
Sickles, R.C., 2005. Panel estimators and the identi…cation of …rm-speci…c e¢ ciency levels in parametric, semiparametric and nonparametric settings. Journal of Economet-rics, 126(2), 305-334.
Vitaliano, D., Toren, M., 1994. Cost and e¢ ciency in nursing homes: a stochastic frontier approach. Journal of Health Economics, 13, 281-300.
Waldman, D., 1982. A stationary point for the stochastic frontier likelihood. Journal of Econometrics, 18, 275-279.
Wilson, J., 1989. Bureaucracy: what government agencies do and why they do it. Washington DC: Basic Books.
TRE TRE with Mundlak formulation
Firm-speci…c component i iid 0; 2 i= Xi+ i
Xi=T1 T P t=1 Xit i iid 0; 2 Random error "it "it= it+ uit "it= it+ uit uit N+ 0; 2u uit N+ 0; 2u it N 0; 2 it N 0; 2 Ine¢ ciency E [uitj uit+ it] E [uitj uit+ it]
Table 1: Econometric speci…cations of TRE models.
Variables Mean Std. Dev. Median Min Max
Average cost (Sfr/resident day) 232.80 26.40 235.50 172.85 297.60
Total annual resident days (Y ) 24032 9780 21911 9925 58324
Average dependency index (Q1) 3.08 0.37 3.14 0.80 3.80
Nursing sta¤ ratio (Q2) 0.966 0.090 0.96 0.74 1.55
Average labor price in Sfr per employee (Pl) 80266 4817 80613 63363 93704
Average capital price in Sfr per bed (Pk) 5398 2671 4993 1054 22891
Average material price in Sfr per meal (Pm) 8.35 1.20 8.32 5.15 11.70
Number of beds 68 27.4 64 28 162
Notes: All monetary values are in 2005 Swiss francs (Sfr), adjusted by the national Consumer Price Index.
Table 2: Descriptive statistics of the main costs and input variables (210 obser-vations).
Private-law NHs Public-law NHs t-test
Variables Mean Std. Dev. Mean Std. Dev.
Average cost (Sfr/resident day) 233.90 29.55 231.60 22.70 0.650
Total annual resident days (Y ) 20755.80 7252.45 27464.80 10882.70 -5.342
Average dependency index (Q1) 3.104 0.369 3.071 0.371 0.659
Nursing sta¤ ratio (Q2) 0.969 0.111 0.963 0.062 0.512
Average labor price in Sfr per 80068.70 4987.40 80474.05 4647.10 -0.616 employee (Pl)
Average capital price in Sfr 5451.20 3369.30 5342.25 1665.50 0.298
per bed (Pk)
Average material price in Sfr 8.20 1.25 8.50 1.13 -1.630
per meal (Pm)
Number of beds 59 21 77 30 -5.111
Number of homes 22 21
-Number of observations 107 103
-Notes: All monetary values are in 2005 Swiss francs (Sfr), adjusted by the national Consumer Price Index. Signi…cance levels: * = 10%, ** = 5%, *** = 1%.
Single sto chastic fro n tier Sep ar ate (ins titutional) sto chas tic fro n tier Mo del 1a Mo del 1b Mo del 2a Mo del 2b (TRE) (TRE with Mun dlak ) (TRE) (TRE with M un dla k) V aria b les Co e¢ cien ts Std. E rr. Co e¢ cien ts S td. Err . Co e¢ cien ts Std. Err. Co e¢ cien ts Std. E rr. Y 0 .939 0.0 08 0. 941 0.0 08 0.937 0.0 08 0 .933 0.0 08 Q1 0.1 76 0.0 32 0. 046 0 .112 0.1 78 0.0 32 0. 049 0 .108 Q2 0.1 41 0.0 42 0. 149 0.0 46 0.141 0.0 42 0. 149 0.0 45 Pl 0.5 83 0.0 25 0. 576 0.0 39 0.585 0.0 25 0. 580 0.0 39 Pk 0.1 14 0.0 07 0. 105 0.0 08 0.114 0.0 07 0. 103 0.0 08 dt 20 02 0.0 36 0.0 14 0.0 39 0.0 17 0 .036 0.0 14 0. 039 0.0 17 dt 20 03 0.0 43 0.0 09 0. 047 0.0 10 0.043 0.0 09 0. 047 0.0 10 dt 20 04 0.0 30 0.0 10 0.0 31 0.0 12 0.030 0.0 10 0. 032 0.0 12 dt 20 05 0.0 54 0.0 12 0. 058 0.0 13 0.054 0.0 12 0. 058 0.0 13 YY 0. 014 0. 028 0.033 0.028 0. 014 0. 028 0. 040 0 .029 Q1 Q1 1.0 41 0.4 23 0.974 0.4 84 1.0 41 0.4 35 1.065 0.4 92 Q2 Q2 0.0 27 0. 345 0. 013 0 .528 0.0 41 0.35 3 0. 082 0. 515 Pl Pl 0.4 08 0.2 29 0. 445 0 .278 0. 414 0.2 40 0 .478 0.2 89 Pk Pk 0.1 52 0.0 20 0. 147 0.0 22 0.154 0.0 21 0. 155 0.0 23 Q1 Q2 -0.190 0.26 6 -0.0 56 0. 476 -0.184 0.266 0.00 0 0.4 84 YQ 2 -0.014 0.11 2 -0.0 06 0. 140 0.010 0.112 0.01 1 0.1 42 YQ 1 -0.267 0.0 84 -0 .458 0.2 65 -0.266 0.0 84 -0 .450 0.2 63 YP l 0.1 62 0.0 64 0.133 0.0 67 0 .159 0.0 65 0 .119 0.0 66 YP k 0.0 24 0. 024 0.039 0.0 17 0.025 0. 016 0. 042 0.0 18 Q1 Pl 0.4 49 0.2 25 0. 394 0 .293 0.45 3 0.238 0.3 94 0. 292 Q1 Pk -0.262 0.0 75 -0. 239 0.0 78 -0.266 0.0 77 -0. 253 0.0 79 Q2 Pl -0.263 0.25 9 -0.2 47 0. 275 -0.268 0.259 -0.26 0 0.2 65 Q2 Pk -0.040 0.08 0 0.0 04 0. 089 -0.040 0.080 0.00 9 0.0 92 Pk Pl -0.140 0.0 59 -0.159 0.0 62 -0 .143 0.0 60 -0. 174 0.0 65 Me an Q1 -0.354 0.1 14 -0.367 0.1 12 Me an Pl -0 .110 0.0 45 -0.124 0.0 44 Me an Q1 Q2 --2.162 0.6 84 --2.298 0.7 12 Me an YQ 1 -0 .534 0.2 63 -0 .538 0.2 57 Z -0.006 0. 006 0 .021 0.0 06 0 15. 379 0.0 09 1 5.389 0.0 11 15. 376 0.0 09 15.3 73 0.0 11 0.0 40 0.0 03 0. 029 0.0 03 0.040 0.0 03 0. 027 0.0 03 0.0 47 0.0 05 0. 041 0.0 07 0.047 0.0 05 0. 044 0.0 06 1.9 36 0.6 16 1.22 5 0.6 73 1.963 0.6 18 1. 473 0.6 45 o te s: S ig n i… c a n c e le v e ls : * = 10 % , * * = 5% , * * * = 1% . T able 4: E stimat ion re sults of TRE mo d els wi th and wi th out ins titutional du mm y among re g res sor s (210 obse rv ations).
Random e¤ects model RE model with Mundlak
Variables Coe¢ cients Std.Err. Coe¢ cients Std. Err.
Y 0.942 0.017 0.936 0.014 Q1 0.184 0.054 0.044 0.072 Q2 0.149 0.051 0.150 0.050 Pl 0.580 0.035 0.576 0.039 Pk 0.114 0.010 0.101 0.010 dt2002 0.036 0.009 0.039 0.009 dt2003 0.046 0.009 0.049 0.010 dt2004 0.031 0.009 0.033 0.009 dt2005 0.056 0.010 0.059 0.010 YY -0.018 0.060 0.024 0.052 Q1Q1 1.094 0.511 1.105 0.507 Q2Q2 -0.006 0.311 0.064 0.309 PlPl 0.406 0.238 0.522 0.238 PkPk 0.164 0.030 0.161 0.029 Q1Q2 -0.339 0.267 -0.069 0.277 YQ2 0.007 0.117 0.009 0.115 YQ1 -0.283 0.119 -0.506 0.140 YPl 0.160 0.075 0.111 0.072 YPk 0.030 0.026 0.049 0.024 Q1Pl 0.545 0.237 0.442 0.231 Q1Pk -0.285 0.091 -0.247 0.087 Q2Pl -0.284 0.207 -0.280 0.204 Q2Pk -0.043 0.081 0.021 0.081 PkPl -0.166 0.076 -0.198 0.074 Mean Q1 - - 0.367 0.077 Mean Pl - - 0.132 0.057 Mean Q1Q2 - - -2.544 0.546 Mean YQ1 - - 0.553 0.182 Z 0.004 0.013 0.018 0.011 0 15.411 0.013 15.402 0.012 R2 0.982 0.988
Notes: Signi…cance levels: * = 10%, ** = 5%, *** = 1%.
Table 5: Results of the non-frontier models RE and RE Mundlak (210 observa-tions).
MEAN MANAGERIAL INEFFICIENCY Mean Std. Dev. Min Max All NHs (N=210) Model 1a 0.0324 0.0191 0.0087 0.1647 Model 1b 0.0251 0.0113 0.0083 0.0972 Model 2a 0.0326 0.0193 0.0086 0.1671 Model 2b 0.0281 0.0143 0.0086 0.1193 Private-law NHs (N=107) Model 1a 0.0333 0.0224 0.0088 0.1647 Model 1b 0.0253 0.0131 0.0083 0.0972 Model 2a 0.0337 0.0228 0.0089 0.1671 Model 2b 0.0291 0.0168 0.0086 0.1192 Public-law NHs (N=103) Model 1a 0.0315 0.0149 0.0087 0.0709 Model 1b 0.0250 0.0090 0.0097 0.0500 Model 2a 0.0316 0.0150 0.0086 0.0712 Model 2b 0.0271 0.0110 0.0093 0.0587
Table 6: Mean managerial ine¢ ciency of public-law and private-law NHs.
Kruskal-Wallis test on equality of mean Single stochastic Separate (institutional) managerial ine¢ ciency between groups frontier stochastic frontier
Model 1a Model 1b Model 2a Model 2b
p-value 0.8211 0.5269 0.9685 0.8018
Table 7: Results of the Kruskal-Wallis test on the equality of mean managerial ine¢ ciency between public-law and private-law NHs.