HAL Id: inserm-00282487
https://www.hal.inserm.fr/inserm-00282487
Submitted on 27 May 2008
HAL is a multi-disciplinary open access archive for the deposit and dissemination of sci-entific research documents, whether they are pub-lished or not. The documents may come from teaching and research institutions in France or abroad, or from public or private research centers.
L’archive ouverte pluridisciplinaire HAL, est destinée au dépôt et à la diffusion de documents scientifiques de niveau recherche, publiés ou non, émanant des établissements d’enseignement et de recherche français ou étrangers, des laboratoires publics ou privés.
Survival after bilateral versus single lung transplantation
for patients with chronic obstructive pulmonary disease:
a retrospective analysis of registry data.
Gabriel Thabut, Jason Christie, Philippe Ravaud, Yves Castier, Olivier
Brugière, Michel Fournier, Hervé Mal, Guy Lesèche, Raphaël Porcher
To cite this version:
Gabriel Thabut, Jason Christie, Philippe Ravaud, Yves Castier, Olivier Brugière, et al.. Survival after bilateral versus single lung transplantation for patients with chronic obstructive pulmonary disease: a retrospective analysis of registry data.. The Lancet, Elsevier, 2008, 371 (9614), pp.744-51. �10.1016/S0140-6736(08)60344-X�. �inserm-00282487�
Survival after bilateral lung transplantation versus single lung transplantation for patients with chronic obstructive pulmonary disease.
Gabriel Thabut1,4, Jason D. Christie7,8, Philippe Ravaud3,4, Yves Castier2, Olivier Brugière1, Michel Fournier1, Hervé Mal1, Guy Lesèche2, Raphaël Porcher5,6.
Authors’ affiliations:
1Service de pneumologie B et transplantation pulmonaire, 2Service de chirurgie thoracique et
vasculaire, 3Département d’épidémiologie, de biostatistiques et de recherche clinique, Hôpital Bichat, APHP et Université Paris-Diderot – Paris 7, Paris, France.
4INSERM U738, 5INSERM U717, Paris, France.
6Département de Biostatistique et Informatique Médicale, Hôpital Saint-Louis, APHP et
Université Paris-Diderot – Paris 7, Paris, France.
7Division of Pulmonary and Critical Care Medicine, Department of Medicine, Center for
Clinical Epidemiology and Biostatistics, University of Pennsylvania, Philadelphia, Pennsylvania, USA.
8International Heart and Lung Transplant Registry, Addison, Texas.
Word count: 3204
Correspondence and requests for reprints should be addressed to:
Gabriel Thabut, MD, Service de Pneumologie B et transplantation pulmonaire, Hôpital Bichat, 46 rue Henri Huchard, 75018 Paris, France. E-mail: [email protected]
Corresponding author’s FAX: (1) 40256401 Author’s phone number: (1) 40256912
HAL author manuscript inserm-00282487, version 1
HAL author manuscript
Abstract
Abstract word count: 240
Background: Both single and bilateral lung transplantation (LT) are recognized options for
patients with end-stage chronic obstructive pulmonary disease (COPD); however, the choice of procedure leading to longer survival remains unclear. We aimed to compare survival following both procedures by analysing the data from the registry of the International Society for Heart and Lung Transplantation.
Methods: Data for 9883 COPD patients who underwent bilateral (35.7%) or single (64.3%)
LT between 1987 and 2006 worldwide were analysed. Analysis of covariance, propensity-score risk adjustment and propensity-based matching were used to take into account selection bias.
Findings: Median survival following LT for COPD was 5.0 years (95% CI 4.81–5.22) and
improved over time. The proportion of patients undergoing bilateral LT increased, from 20.4% in 1993 to 56.2% in 2006. Median survival time following bilateral LT was significantly longer than that following single LT: 6.41 years (6.02–6.88) versus 4.59 (4.41– 4.76), p < 0.0001; however, pretransplant characteristics of patients undergoing single and bilateral LT differed markedly. Whatever the method used to adjust for baseline differences, bilateral LT was associated with longer survival than single LT, the hazard ratio ranging from 0.83 (0.78–0.92) for analysis of covariance to 0.89 (0.80–0.97) for propensity-based matching. The benefit of bilateral LT over single LT seemed low in patients older than 60 years.
Interpretation: Bilateral LT appears to lead to longer survival than single LT in patients with
COPD, especially those younger than 60 years.
Introduction
Lung transplantation (LT) is the ultimate therapy available for selected patients with end-stage lung diseases.1, 2 Among such diseases, chronic obstructive pulmonary disease (COPD) represents one of the major indications for LT. According to the 2006 report of the International Registry of the International Society for Heart and Lung Transplantation (ISHLT), 46% of LTs were performed for COPD from January 1995 to June 2005.3
Patients with advanced COPD are now offered single LT (SLT) or bilateral LT (BLT). The latter was first developed at the end of the 1980s as an en-bloc procedure.4 The technique was subsequently modified to a bilateral sequential technique. SLT was initially considered a contraindication for COPD for anatomic and physiologic reasons, but after the demonstration in 1988 of the feasibility and immediate good tolerance of SLT in this setting,5, 6 confirmed by satisfying medium-term results,7, 8 the procedure has become the most frequent type of LT performed in these patients. However, the choice of SLT or BLT for COPD patients is still a matter of debate.9-12 In comparison with BLT, SLT is an easier procedure and can be used for patients with advanced disease; it also potentially allows for economy of organs because the lungs from a single donor can theoretically be implanted in two patients. The main drawback of SLT is the potential occurrence of complications -- infection, hemoptysis, pneumothorax and hyperinflation -- affecting the native lung.13, 14
Both SLT and BLT yield a similar benefit in terms of exercise capacity,15, 16 but a survival advantage of BLT over SLT has recently been suggested by results of several studies, both from single centers,17, 18 and from the ISHLT registry.19 This survival advantage has probably been taken into account by many transplant physicians and might explain why many centers now favour the use of BLT for COPD. However, in the absence of a randomized controlled trial comparing SLT and BLT in patients with COPD, a comparison of survival
confounding factors by the indication for the procedure: study outcomes are affected by the differing characteristics of patients undergoing SLT or BLT, apart from those related to the interventions being assessed.20 For instance, patients undergoing BLT are in general younger than those undergoing SLT, which potentially leads to a bias, since age is a well-known prognostic factor of survival after LT. Even if a survival benefit with BLT has been reported by authors who analyzed the results of both procedures after stratifying patients by age,19 other confounding factors may still bias the comparison of survival data.
We aimed to compare survival rates following BLT and SLT for COPD patients by using several techniques that account for confounding factors: analysis of covariance, propensity-score risk adjustment and propensity-based matching.
Methods
This study report follows the STROBE statement.21 Patients
We used information from the ISHLT registry (www.ishlt.org) as of March 2007. The registry contains data on 21,265 lung recipients from 210 centers around the world since its inception in 1987.22 All patients who underwent LT between 1987 and 2006 in the participating centers were eligible for the study provided that 1) they underwent cadaveric SLT or BLT for COPD (including COPD related to alpha-1 anti-trypsin deficiency);23 2) the date of LT was known; 3) the date of last follow-up was known; and 4) the vital status at last follow-up was known.
Selection of variables for survival analysis
Data on 240 variables related to characteristics of patients at the time of transplantation were collected by the ISHLT registry. We excluded variables for which data were sparse or those that described clinically uncommon or rare characteristics. Several variables were calculated from available variables (i.e. gender mismatch). Table 1 indicates the variables included in the analyses.
Handling of missing data
For variables involved in the analysis of covariance and propensity-score development, missing data were imputed by the multiple-imputations-by-chained equation, which resulted in 5 imputed datasets.24 We independently analysed the 5 copies of the data. We averaged estimates of the variables to give a single mean estimate and adjusted standard errors according to Rubin’s rules.24 The steps of the imputation procedure are given in the
Statistical methods
We used 3 methods to adjust for confounding factors: analysis of covariance, propensity-score risk adjustment and propensity-score matching.
Analysis of covariance
Analysis of covariance refers here to a standard statistical approach that produces estimates of treatment effects adjusted for background characteristics (covariates), which are included explicitly in Cox proportional-hazard regression models. We used purposeful selection of covariates as described by Hosmer and Lemeshow to select the multivariable model.25 The first step was the inclusion of all variables significant in the bivariate analysis at the 20% level as well as all variables known to be clinically relevant.26 The second step was to remove, one by one, variables that did not significantly contribute to the multivariable model on the basis of the p value of the Wald test and on the change in the coefficient of the remaining variables. The scale of the continuous covariates was assessed by residual analysis.25, 27 Only first-order interactions with surgical procedure were considered.
Propensity-score adjustment and matching
The propensity score is the probability of undergoing BLT instead of SLT for a patient with specific pre-treatment characteristics.28, 29 Within propensity-score strata, covariates in both groups tend to be similarly distributed. We computed the propensity score by using logistic regression, the dependent variable being surgical procedure and the covariates being all variables listed in Table 1. Continuous variables were entered into the model as second-order polynomials. The success of the propensity-score modelling was judged by whether balance on baseline characteristics was achieved between the BLT and SLT groups within deciles of propensity score or after propensity-score matching.
We used covariate adjustment with the propensity score and propensity-based matching to produce adjusted estimates of the effect of BLT.30 Covariate adjustment with the propensity score involved use of a Cox proportional-hazard regression model to regress survival following LT on the propensity score (on the linear predictor scale) and the variable denoting surgical procedure. We used a 1:1 matching algorithm without replacement to match subjects with use of callipers defined to have a maximum width of 0.25 SDs of the logit of the estimated propensity score. Marginal Cox models, accounting for correlation within matched pairs, were used to compare adjusted survival between patients undergoing SLT and those undergoing BLT.
Interpretation of results
All these models yielded the effect of BLT on survival as a hazard ratio for death, with the SLT group being the reference. To compute a more meaningful measure of the survival effect of BLT, we computed the difference in terms of survival rate at 5 years using the following formula: S(t;BLT) = S(t;SLT)(HR) .
Test of the Cox proportional-hazard assumption
We used several statistical methods to assess whether the effect of surgical procedure was constant over time (proportional-hazard assumption), including residual plots as described by Grambsch and Therneau31 and fitting of Cox models in which the post-transplant period is split into 3 periods: the first year after post-transplantation, between 1 and 5 years after transplantation, and more than 5 years after transplantation.
Statistical software
All analyses involved the use of R 2.5 for Windows XP. Propensity-score matching
Role of the funding source
There was no funding source in relation with this study. The authors had full access to all the data in the study and had the final responsibility for the decision to submit for publication.
Results
The ISHLT database included data for 9952 COPD patients undergoing LT between 1987 and 2007. Survival times were not available for 69 patients, which left data for 9883 patients for analysis. Of these patients, 1963 (19.9%) had alpha-1 antitrypsin deficiency as a risk factor for COPD.
The mean follow-up was 6.72 years. Median survival following LT was 5.0 years (95% CI 4.81-5.22). Survival rates at 1, 3 and 5 years were 80.6% (79.8%–81.4%), 63.8% (62.8%–64.8%) and 50.0% (48.8%–51.2%), respectively. Survival following LT improved in more recent years, median survival being 4.53 years (4.31–4.81) before 1998 and 5.3 years (5.01-5.50) from 1998 onward (p<0.001).
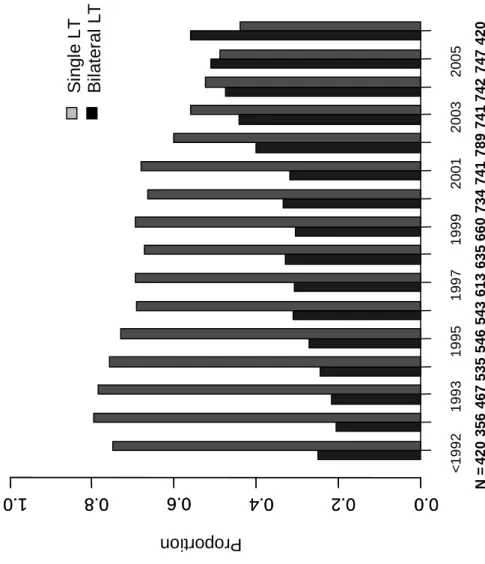
Among the 9883 COPD patients undergoing LT, 6358 patients underwent SLT (64.3%) and 3525 (35.7%) BLT. Figure 1 depicts the evolution of these proportions over time. Rates of BLT changed from 20.4% in 1993 to 56.2% in 2006. The proportion of BLT performed decreased with increasing age: 49.7% of patients younger than 50 years underwent BLT as compared with 23.9% older than 60 years. The rate of BLT differed markedly according to alpha-1 antitrypsin deficiency status: 50.0% for patients with the deficiency as compared with 32.1% without the deficiency (p<0.001).
Median survival time following BLT was significantly higher than that following SLT: 6.41 years (6.02-6.88) versus 4.59 years (4.41-4.76; p < 0.0001) (Figure 2A). Similar results were observed for patients undergoing LT only in recent years (from 1998 onward) 6.72 years (5.88-7.2) vs. 4.90 (4.68-5.29), p<0.001.
The characteristics of patients are in Table 2 and show some imbalance by procedure performed. As expected, graft ischemic time was significantly longer for patients undergoing BLT than SLT [5.4 (SD 1.7) vs. 3.8 (1.4) hours; p<0.0001].
Analysis of covariance
In an unadjusted Cox analysis, the hazard ratio for BLT as compared with SLT was 0.76 (95% CI 0.70–0.83), which indicates a protective effect of BLT on mortality. Purposeful selection of the covariates led to a multivariate model including the following variables: surgical procedure, age at transplantation, New York Heart Association functional class, body mass index, ventilator requirement, donor age, donor body mass index, donor with diabetes, number of human leucocyte antigen mismatches, cytomegalovirus (CMV) mismatch (i.e. donor CMV+ and recipient CMV-) and year of transplantation. Residual plot results supported a linear relation between all continuous covariates and the log hazard of death. No significant interaction was retained in the final model; in particular, interaction between age at transplantation and type of procedure was not significant (p=0.25). According to this model, the adjusted hazard ratio for BLT was 0.83 (0.78–0.92).
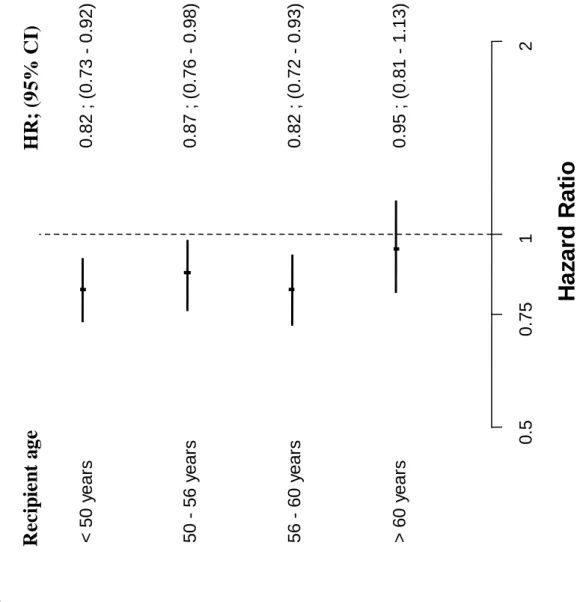
Figure 3 shows the survival effect of LT according to recipient age (quartiles of distribution). For this analysis, a proportional-hazard model including the variables described above was fitted for each quartile of age distribution. BLT was associated with better adjusted survival up to 60 years than was SLT. After 60 years, the hazard ratio for BLT was no longer statistically significant.
Propensity score
The propensity score included all variables pertaining to donors, patients and surgical procedure characteristics. The propensity score ranged from 0.03 to 0.90 on the probability scale. The distribution of variables was well balanced within deciles of the propensity score. Table 3 shows the balance within deciles of the propensity score for selected covariates. A multivariate model adjusted for propensity-score deciles gave an adjusted hazard ratio for
transplant procedure of 0.84 (95% CI 0.79–0.90). The ratio was 0.86 (0.81–0.93) when the covariates of the multivariate model described above were added to the model.
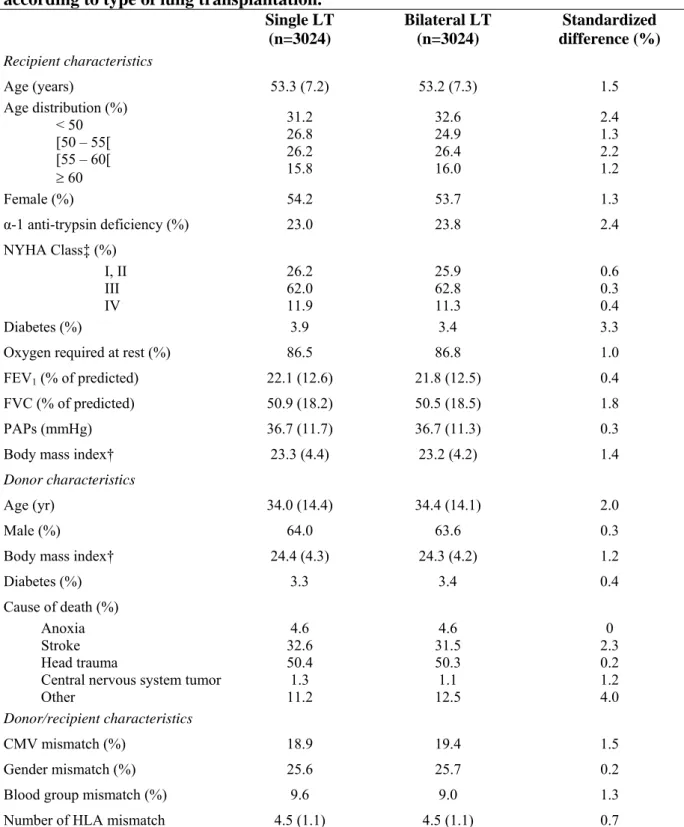
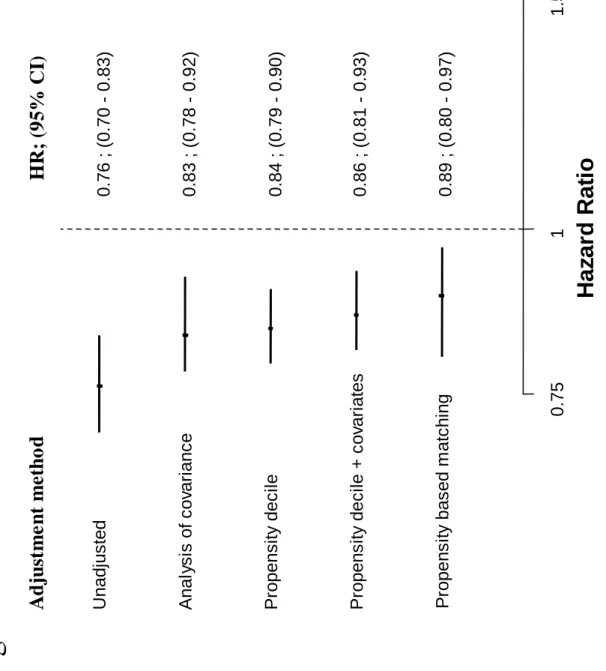
We successfully matched 3024 patients undergoing SLT with 3024 patients undergoing BLT on the basis of propensity score. Table 4 gives the main characteristics of these patients according to procedure, showing a good balance of baseline characteristics between the 2 groups. Figure 2B displays the survival of the 6048 patients matched on the propensity score, according to the transplantation procedure. In a marginal Cox models, accounting for correlation within matched pairs, BLT was associated with a significant reduction in of the instantaneous risk of death, with a hazard ratio of 0.89 (95% CI 0.80– 0.97). Figure 4 summarizes the hazard ratios for death according to surgical procedure by the different statistical methods.
Proportional-hazards assumption
Despite no formal violation of the Cox proportional hazard assumption, results of residuals plots suggested that the beneficial effect of BLT begins about one year after LT, both procedures being approximately equivalent in terms of survival during the first year after the procedure. This finding is confirmed by results of a Cox analysis in which time after transplantation was divided into three parts: the first year after transplantation, between 1 and 5 years after transplantation, and more than 5 years after transplantation. This analysis included the covariates of the multivariate model described above. The adjusted hazard ratios for BLT as compared with SLT for the three post-transplantation periods were 1.05 (95% CI 0.95–1.17), 0.77 (0.70–0.86) and 0.72 (0.62–0.83), respectively.
Survival rates at 5 years
The unadjusted difference in 5-year survival rate for patients undergoing LT from 1998 onward was 7.2%. As shown above, the adjusted hazard ratio for BLT ranged from 0.83 to 0.89 depending on the statistical method. Taking into account a 5-year survival rate of 49.3% for patients undergoing SLT, BLT was associated with an adjusted difference in better 5-year survival ranging from 4.0% to 6.3%.
Sensitivity analyses
We ran several sensitivity analyses to test the robustness of our findings. The same analyses were performed for patients undergoing LT from 1998 onward (n=5768). This analysis yielded results very similar to those for the whole sample, the adjusted hazard ratio for BLT being 0.87 (95% CI 0.81–0.95) with analysis of covariance. We also restricted an analysis to patients undergoing LT in the United States (n=5873): the adjusted hazard ratio for BLT with analysis of covariance was 0.86 (0.78–0.95).
Discussion
A thorough analysis of the ISHLT registry suggests that (1) BLT is associated with longer survival than SLT among COPD patients, whatever the statistical method used to account for confounding factors; (2) BLT seems to yield more benefit for patients younger than 60 years; (3) the benefit of BLT over SLT becomes apparent in the second year after LT. The optimal transplant procedure for COPD is still a matter of debate.12 However, in recent years, the publication of results of several studies suggesting a survival advantage of BLT over SLT has led to a progressive shift in the choice of procedure. BLT now represents most LT procedures performed for COPD (including patients with alpha-1 antitrypsin deficiency). Cassivi et al reported their experience with 306 emphysema patients undergoing SLT (28.9%) or BLT (71.1%) from 1988 to 2000.17 Despite similar in-hospital mortality between the groups, patients undergoing BLT had higher 5-year survival than those undergoing SLT (66.7% vs. 44.9%, p<0.001). However, patients undergoing BLT were younger and more frequently had alpha-1 antitrypsin deficiency. More recently, Gunes et al reported their experience with 173 COPD patients receiving heart-lung transplantation (n=8), SLT (n=99) or BLT (n=66) from 1999 to 2003.18 Patients undergoing BLT had higher 5-year survival than those undergoing SLT (81.0% vs. 47.0%, p<0.001). In this study, baseline characteristics of SLT and BLT were similar. Meyer et al analysed ISHLT registry data for all COPD patients (those with alpha-1 antitrypsin deficiency were excluded) who underwent cadaveric SLT or BLT from 1991 to 1997 and attempted to take into account possible confounding factors, including age.19 Patients undergoing BLT had higher 5-year survival than those undergoing SLT (68.2% vs. 43.6%, p<0.001) and were younger (50.5 vs. 54.8 years). In multivariate analysis, adjusting for recipient age, SLT patients aged 40 to 57 years had higher mortality than BLT patients.
First, we included all patients who underwent LT up to the year 2007. Since the survival of LT has changed over time, the results found on patients who underwent LT ten years ago may no longer apply. Second, we included in our models many prognostic factors that have never been taken into account in previous studies. For instance, the year of transplantation procedure is linked to survival and to the likelihood of receiving a bilateral LT (Figure 1); and thus may be an important confounding factor. Including such a large number of patients gave us the opportunity to adjust on this confounding factor (and many others), whereas previous studies could not. Third, we systematically addressed the potential limitations of this study by performing sensitivity analyses. Fourth, we applied several methods of adjustment to take into account potential selection biases. The fact that all these methods yield similar conclusions strengthens the soundness of our results. Previous studies were either not powerful enough to adjust for confounding factors or performed only conventional modelling approaches.
Conventional modelling approaches can produce biased estimates if background characteristics are extremely unbalanced and/or the effect of surgical procedure is not constant across values of background characteristics.28, 29, 32 To circumvent this limitation, we used propensity scores, which have been shown to considerably reduce bias. Formally, the propensity score for an individual is the probability of being treated (here to receive BLT) based on the individual’s covariate values. Practically, the propensity score is estimated by logistic regression, whereby the treatment variable is the outcome and the background characteristics are the predictor variables. Within propensity-score strata, covariates in both groups are similarly distributed.28, 29, 32 The propensity score, once estimated, can be incorporated in the analysis either by stratification or by matching on the propensity score. Matching on the propensity score consists of matching all treated subjects with one control subject within a preset amount (or calliper) of the treated subject’s propensity score. In the
present study, we found 3024 pairs of patients sharing close propensity scores. This approach was successful in creating pairs of patients with similar background covariates, as shown in Table 4. Although propensity scores cannot remove hidden biases, except to the extent that unmeasured prognostic variables are correlated with the measured covariates used to compute the score, the balance in the distribution of measured risk factors provides reasonable evidence to infer that the distribution of unmeasured variables is likely balanced.
None of these statistical methods can be viewed as the gold standard for removing bias, and all have drawbacks. However, in the present study, all methods yielded very similar results, which supports the robustness of our findings. Depending on the statistical method used, the adjusted hazard ratios ranged from 0.83 to 0.89, which translates to a 4.0% to 6.3% better survival at 5 years with BLT than SLT.
A key issue is whether BLT leads to better long-term survival whatever the recipient age, the study by Meyer et al suggesting that SLT could lead to better long-term survival in older patients.19 Unfortunately, the answer to this question is not trivial, from a statistical standpoint. In our study, the interaction between recipient age and surgical procedure did not reach statistical significance (p=0.25). When the population was split into 4 groups according to quartiles of age, the benefit of BLT over SLT was restricted to patients younger than 60 years. However, this result may be explained by the decreased statistical power due to data splitting.
This study has several limitations. First, our analyses involved data with varying levels of validation from many countries, and data for some patients may be inaccurate. However, misclassification of data should not bias the results in favour of one technique over another and seems an unlikely explanation for our findings. We addressed this limitation by running several sensitivity analyses on the United Network for Organ Sharing dataset, in which data
for date of death are from the U.S. Social Security Death Master File; the results remained largely unchanged.
Second, we used observational data to study the impact of surgical procedure on long-term survival. Although we used several statistical approaches to take into account a large number of confounders, residual confounding is possible. Only a randomized controlled trial (RCT) would definitely answer this question. Taking into account an expected 5% difference in 5-year survival, such a trial should enrol and follow more than 3000 patients for 5 years. Such a large-scale trial seems unlikely to be performed in the LT field. However, in certain respects, our approach produced results that could be more useful than those from a RCT, especially in relation to external validity. Most RCTs recruit only a small proportion of the patients with the disease of interest, and those recruited are likely to systematically differ from those not recruited.
Third, the mechanisms underlying the better survival following BLT remain unclear and could not be investigated from this registry. We were unable to assess the cause of death according to procedure because data were too poorly reported in this registry. As others have shown, cause of death cannot be reliably determined without the use of an adjudication committee.33
Finally, several important topics not addressed by the present study remain controversial, including: (1) the unclear potential survival benefit conferred by lung transplantation over conventional treatment; (2) the respective places of lung volume reduction procedures (surgery or endobronchial valves) in the management of patients with emphysema; (3) the optimal surgical approaches for sequential bilateral lung transplantation, such as single lung transplantations performed on each side a few years apart; and (4) the balance of individual survival benefits versus optimizing ethical organ allocation.
In conclusion, the present study strongly supports BLT leading to better survival than SLT for COPD patients. However, only a randomised controlled trial would be able to definitely confirm this hypothesis. Furthermore, any potential survival benefit must be weighed against the potential societal benefits of organ allocation to subjects with advanced lung diseases.
References
1. Arcasoy SM, Kotloff RM. Lung transplantation. N Engl J Med. 1999 Apr
8;340(14):1081-91.
2. Trulock EP. Lung transplantation. Am J Respir Crit Care Med. 1997 Mar;155(3):789-818.
3. Trulock EP, Edwards LB, Taylor DO, Boucek MM, Keck BM, Hertz MI. Registry of the International Society for Heart and Lung Transplantation: twenty-third official adult lung and heart-lung transplantation report--2006. J Heart Lung Transplant. 2006 Aug;25(8):880-92.
4. Cooper JD, Patterson GA, Grossman R, Maurer J. Double-lung transplant for advanced chronic obstructive lung disease. Am Rev Respir Dis. 1989 Feb;139(2):303-7.
5. Mal H, Andreassian B, Pamela F, Duchatelle JP, Rondeau E, Dubois F, et al. Unilateral lung transplantation in end-stage pulmonary emphysema. Am Rev Respir Dis. 1989 Sep;140(3):797-802.
6. Trulock EP, Egan TM, Kouchoukos NT, Kaiser LR, Pasque MK, Ettinger N, et al. Single lung transplantation for severe chronic obstructive pulmonary disease. Washington University Lung Transplant Group. Chest. 1989 Oct;96(4):738-42.
7. Levine SM, Anzueto A, Peters JI, Cronin T, Sako EY, Jenkinson SG, et al. Medium term functional results of single-lung transplantation for endstage obstructive lung disease. Am J Respir Crit Care Med. 1994 Aug;150(2):398-402.
8. Mal H, Sleiman C, Jebrak G, Messian O, Dubois F, Darne C, et al. Functional results of single-lung transplantation for chronic obstructive lung disease. Am J Respir Crit Care Med. 1994 Jun;149(6):1476-81.
9. Corris PA. Lung transplantation for chronic obstructive pulmonary disease: an exercise in quality rather than quantity? Thorax. 1999 Aug;54 Suppl 2:S24-7.
10. Snell GI. Chronic obstructive pulmonary disease outcomes: can we now compare apples with apples? Intern Med J. 2006 Jan;36(1):3-4.
11. Trulock EP, 3rd. Lung Transplantation for COPD. Chest. 1998 Apr;113(4 Suppl):269S-76S.
12. Weill D, Keshavjee S. Lung transplantation for emphysema: two lungs or one. J Heart Lung Transplant. 2001 Jul;20(7):739-42.
13. Frost AE, Keller CA, Noon GP, Short HD, Cagle PT. Outcome of the native lung after single lung transplant. Multiorgan Transplant Group. Chest. 1995 Apr;107(4):981-4.
14. Mal H, Brugiere O, Sleiman C, Rullon I, Jebrak G, Groussard O, et al. Morbidity and mortality related to the native lung in single lung transplantation for emphysema. J Heart Lung Transplant. 2000 Feb;19(2):220-3.
15. Miyoshi S, Trulock EP, Schaefers HJ, Hsieh CM, Patterson GA, Cooper JD. Cardiopulmonary exercise testing after single and double lung transplantation. Chest. 1990 May;97(5):1130-6.
16. Williams TJ, Patterson GA, McClean PA, Zamel N, Maurer JR. Maximal exercise testing in single and double lung transplant recipients. Am Rev Respir Dis. 1992 Jan;145(1):101-5.
17. Cassivi SD, Meyers BF, Battafarano RJ, Guthrie TJ, Trulock EP, Lynch JP, et al. Thirteen-year experience in lung transplantation for emphysema. Ann Thorac Surg. 2002 Nov;74(5):1663-9; discussion 9-70.
18. Gunes A, Aboyoun CL, Morton JM, Plit M, Malouf MA, Glanville AR. Lung
transplantation for chronic obstructive pulmonary disease at St Vincent's Hospital. Intern Med J. 2006 Jan;36(1):5-11.
19. Meyer DM, Bennett LE, Novick RJ, Hosenpud JD. Single vs bilateral, sequential lung transplantation for end-stage emphysema: influence of recipient age on survival and secondary end-points. J Heart Lung Transplant. 2001 Sep;20(9):935-41.
20. Mamdani M, Sykora K, Li P, Normand SL, Streiner DL, Austin PC, et al. Reader's guide to critical appraisal of cohort studies: 2. Assessing potential for confounding. Bmj. 2005 Apr 23;330(7497):960-2.
21. Von Elm E, Altman DG, Egger M, Pocock SJ, Gøtzsche PC, Vandenbroucke JP, et al. The Strengthening the Reporting of Observational Studies in Epidemiology (STROBE) statement: guidelines for reporting observational studies. Lancet. 2007 Oct;370(9596):1453-57.
22. Hertz MI, Boucek MM, Edwards LB, Keck BM, Rowe AW, Taylor DO, et al. The ISHLT transplant registry: moving forward. J Heart Lung Transplant. 2006 Oct;25(10):1179-85.
23. Pauwels RA, Buist AS, Calverley PM, Jenkins CR, Hurd SS. Global strategy for the diagnosis, management, and prevention of chronic obstructive pulmonary disease. NHLBI/WHO Global Initiative for Chronic Obstructive Lung Disease (GOLD) Workshop summary. Am J Respir Crit Care Med. 2001 Apr;163(5):1256-76.
24. Rubin DB, Schenker N. Multiple imputation in health-care databases: an overview and some applications. Stat Med. 1991 Apr;10(4):585-98.
25. Hosmer D, Lemeshow S. Applied survival analysis. Regression modeling of time to event data. New York: John Wiley & sons INC; 1999.
26. Mickey RM, Greenland S. The impact of confounder selection criteria on effect estimation. Am J Epidemiol. 1989 Jan;129(1):125-37.
27. Kalbfleish J, Prentice R. The statistical analysis of failure data. New-York: John Wiley & sons INC; 2002.
28. D'Agostino RB, Jr. Propensity score methods for bias reduction in the comparison of a treatment to a non-randomized control group. Stat Med. 1998 Oct 15;17(19):2265-81.
29. D'Agostino RB, Jr., D'Agostino RB, Sr. Estimating treatment effects using observational data. Jama. 2007 Jan 17;297(3):314-6.
30. Austin PC, Grootendorst P, Anderson GM. A comparison of the ability of different propensity score models to balance measured variables between treated and untreated subjects: a Monte Carlo study. Stat Med. 2007 Feb 20;26(4):734-53.
31. Grambsch P, Therneau T. Proportional hazards tests and diagnostics based on weighted residuals. Biometrika 1994;81:515–26.
32. Stukel TA, Fisher ES, Wennberg DE, Alter DA, Gottlieb DJ, Vermeulen MJ. Analysis of observational studies in the presence of treatment selection bias: effects of invasive cardiac management on AMI survival using propensity score and instrumental variable methods. Jama. 2007 Jan 17;297(3):278-85.
33. Mant J, Wilson S, Parry J, Bridge P, Wilson R, Murdoch W, et al. Clinicians didn't reliably distinguish between different causes of cardiac death using case histories. J Clin Epidemiol. 2006 Aug;59(8):862-7.
Figure legends
Figure 1. Rates of single lung transplantation (SLT) and bilateral lung transplantation (BLT) over time.
All patients with chronic obstructive pulmonary disease (COPD) who underwent lung transplantation between 1987 and 2006. 15.4% of patients undergoing SLT had alpha-1 antitrypsin deficiency versus 27.8% of patients undergoing BLT.
Figure 2. Survival following lung transplantation between 1987 and 2006, according to transplantation procedure (single vs. bilateral).
Panel A shows the survival of the 9883 patients with chronic obstructive pulmonary disease (COPD) undergoing transplantation during the study period (single lung transplantation [SLT]=6358; bilateral lung transplantation [BLT]=3525). Panel B shows the survival of the 6048 patients matched by propensity score (SLT=3024, BLT=3024). Survival was by Kaplan-Meier estimation.
Figure 3. Adjusted hazard ratio for death associated with bilateral lung transplantation by recipient age at transplantation.
Four age classes were determined according to quartiles of distribution. Hazard ratios were adjusted for recipient age at transplant, New York Heart Association functional class, body mass index, ventilator requirement, donor age, donor body mass index, donor diabetes status, number of human leucocyte antigen mismatches, cytomegalovirus mismatch and year of transplantation. HR, adjusted hazard ratio.
Figure 4. Hazard ratio for death associated with bilateral lung transplantation by several adjustment methods.
Hazard ratio < 1 indicates a beneficial effect of bilateral lung transplantation. Unadjusted analysis refers to a univariate Cox model. Analysis of covariance refers to a multivariate Cox model adjusting for age at transplantation, New York Heart Association functional class, body mass index, ventilator requirement, donor age, donor body mass index, donor with diabetes, number of human leucocyte antigen mismatches, cytomegalovirus (CMV) mismatch (i.e. donor CMV+ and recipient CMV-) and year of transplantation. Propensity decile refers to a multivariate Cox model adjusted for propensity-score deciles. Propensity decile + covariates refers to a multivariate Cox model adjusted for propensity-score deciles and to the variables included in the analysis of covariance. Propensity-based matching refers to a Cox model applied to patients matched on the propensity score. HR, adjusted hazard ratio.
Table 1. Variables tested for association with survival from lung transplantation.
Donor-related characteristics
Age, gender, height, weight, cause of death, history of diabetes, blood group, CMV status, HLA typing
Surgery-related characteristics
Single or bilateral LT, graft ischemic time, transplantation year
Recipient characteristics
Age, gender, height, weight, history of diabetes, blood group, CMV status, HLA typing, prior malignancy, ventilatory support, hospitalization within 90 days before transplantation, alpha-1 antitrypsin deficiency, NYHA functional class, oxygen requirement, FEV1, FVC, PAPs, PAPm, PAPd, PCWP, CO, panel reactive antibody Calculated variables
Blood group mismatch, CMV mismatch, number of HLA mismatches, gender mismatch, donor and recipient body mass index
FEV1 denotes forced expiratory volume in 1s; CMV, cytomegalovirus; HLA, human leucocyte antigen; LT, lung
transplantation; FVC, forced vital capacity; NYHA, New York Heart Association; PAPs, systolic pulmonary artery pressure; PAPm, mean pulmonary artery pressure; PAPd, diastolic pulmonary artery pressure; PCWP, pulmonary capillary wedge pressure; CO, cardiac output.
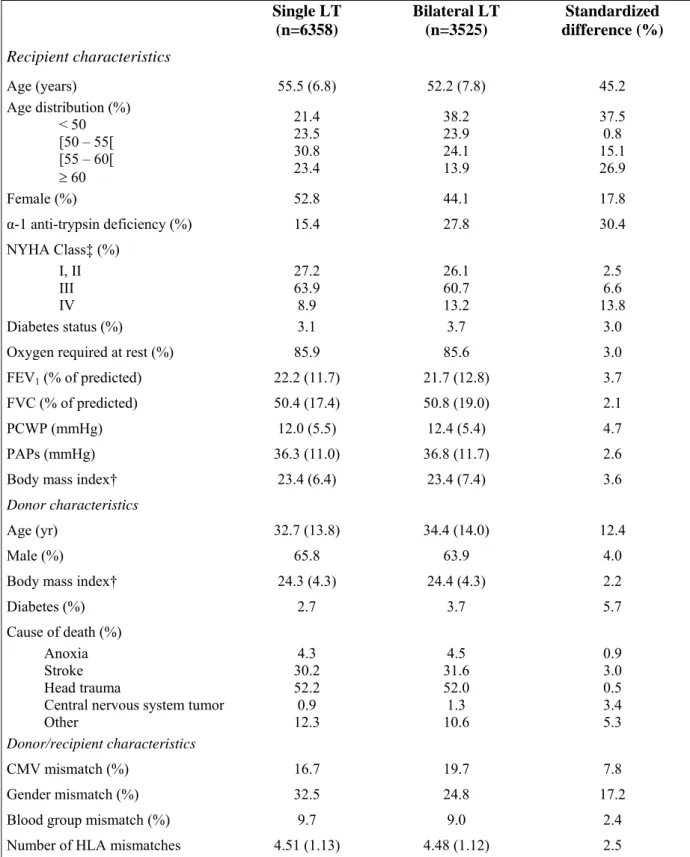
Table 2. Main baseline characteristics of the 9883 patients with COPD according to type of lung transplantation. Single LT (n=6358) Bilateral LT (n=3525) Standardized difference (%) Recipient characteristics Age (years) 55.5 (6.8) 52.2 (7.8) 45.2 Age distribution (%) < 50 [50 – 55[ [55 – 60[ ≥ 60 21.4 23.5 30.8 23.4 38.2 23.9 24.1 13.9 37.5 0.8 15.1 26.9 Female (%) 52.8 44.1 17.8 α-1 anti-trypsin deficiency (%) 15.4 27.8 30.4 NYHA Class‡ (%) I, II III IV 27.2 63.9 8.9 26.1 60.7 13.2 2.5 6.6 13.8 Diabetes status (%) 3.1 3.7 3.0 Oxygen required at rest (%) 85.9 85.6 3.0 FEV1 (% of predicted) 22.2 (11.7) 21.7 (12.8) 3.7
FVC (% of predicted) 50.4 (17.4) 50.8 (19.0) 2.1 PCWP (mmHg) 12.0 (5.5) 12.4 (5.4) 4.7 PAPs (mmHg) 36.3 (11.0) 36.8 (11.7) 2.6 Body mass index† 23.4 (6.4) 23.4 (7.4) 3.6
Donor characteristics
Age (yr) 32.7 (13.8) 34.4 (14.0) 12.4
Male (%) 65.8 63.9 4.0
Body mass index† 24.3 (4.3) 24.4 (4.3) 2.2
Diabetes (%) 2.7 3.7 5.7
Cause of death (%) Anoxia Stroke Head trauma
Central nervous system tumor Other 4.3 30.2 52.2 0.9 12.3 4.5 31.6 52.0 1.3 10.6 0.9 3.0 0.5 3.4 5.3 Donor/recipient characteristics CMV mismatch (%) 16.7 19.7 7.8 Gender mismatch (%) 32.5 24.8 17.2
Blood group mismatch (%) 9.7 9.0 2.4 Number of HLA mismatches 4.51 (1.13) 4.48 (1.12) 2.5
* Data are mean (SD) unless otherwise indicated. FEV1 denotes forced expiratory volume in 1 s; FVC, forced vital capacity;
PCWP, pulmonary capillary wedge pressure; PAPs, systolic pulmonary artery pressure. †Body mass index is weight in kilograms divided by the square of the height in meters. ‡ NYHA, New York Heart Association: functional class ranges I to IV, with IV indicating that the patient experiences symptoms even at rest. Standardized difference is the mean difference divided by the pooled SD, expressed as a percentage.
26
f selected co
varia
tes by propensity-score deciles, accord
ing to type of lung transplantation.
1 2 3 4 5 6 7 8 9 10 0. 03 – 0.14 0. 14 – 0.19 0. 19 – 0.24 0. 24 – 0.28 0. 28 – 0.33 0. 33 – 0.38 0. 38 – 0.44 0. 44 – 0.52 0. 52 – 0.62 0. 62 – 0.93 . of pat ie nt s Single LT 92 896 153 835 227 761 248 740 319 670 347 641 420 568 460 528 561 427 698 291 yr) Bilateral LT Single LT 59 .6 (4 .8 ) 59 .5 (5 .6 ) 58 .1 (5 .3 ) 57 .0 (5 .9 ) 57 .1 (5 .6 ) 56 .8 (5 .8 ) 56 .9 (5 .8 ) 55 .7 (6 .2 ) 55 .7 (6 .1 ) 56 .0 (6 .2 ) 55 .0 (6 .3 ) 55 .1 (6 .6 ) 54 .0 (6 .5 ) 54 .0 (6 .4 ) 52 .3 (6 .4 ) 52 .3 (6 .8 ) 49 .5 (6 .7 ) 50 .3 (6 .1 ) 45 .3 (6 .4 ) 44 .4 (7 .1 ) ale sex (%) Bilateral LT Single LT 32 .0 33 .0 39 .5 42 .8 42 .7 44 .1 45 .3 49 .6 50 .1 48 .6 53 .9 49 .3 54 .1 52 .2 58 .9 60 .9 62 .3 61 .6 71 .2 70 .8 1 (% p redi cted) Bilateral LT Single LT 23 .2 ( 10. 8) 22 .6 ( 10. 4) 22 .7 ( 11. 3) 22 .7 ( 10. 8) 22 .4 ( 11. 8) 22 .6 ( 12. 5) 22 .1 ( 11. 5) 21 .9 ( 10. 0) 22 .0 ( 11. 7) 21 .9 ( 10. 6) 22 .4 ( 13. 2) 24 .1 ( 15. 0) 22 .9 ( 14. 0) 21 .5 ( 12. 1) 21 .4 ( 12. 4) 21 .3 ( 12. 3) 19 .7 ( 10. 4) 21 .4 ( 13. 3) 19 .7 ( 12. 6) 19 .8 ( 12. 0) ficiency (% ) Bilateral LT Single LT 4. 3 2. 5 9. 2 4. 9 11 6.7 10 .9 13 .2 13 .8 15 .7 15 .9 14 .4 21 .0 19 .4 27 .2 25 .2 34 .9 37 .0 57 .7 59 .1 no r age (y ea rs) Bilateral LT Single LT 28 .7 ( 12. 4) 29 .4 ( 14. 2) 30 .1 ( 13. 1) 28 .5 ( 12. 9) 32 .6 ( 13. 6) 32 .1 ( 13. 1) 33 .1 ( 13. 5) 32 .4 ( 13. 3) 34 .0 ( 13. 8) 34 .3 ( 13. 7) 33 .3 ( 13. 5) 35 .3 ( 13. 9) 35 .4 ( 14. 1) 34 .6 ( 14. 1) 35 .6 ( 14. 1) 35 .8 ( 14. 2) 34 .8 ( 14. 6) 34 .6 ( 13. 7) 36 .1 ( 14. 3) 36 .4 ( 13. 9) no r m ale sex (%) Bilateral LT Single LT 76 .3 71 .7 69 .2 72 .3 65 .1 69 .6 64 .2 67 .3 65 .2 62 .7 62 .7 59 .2 58 .5 56 .7 63 .8 64 .1 62 .9 63 .9 66 .4 65 .3 e mean (SD) unless o therwise indi cated. Propensity s
cores were roun
ded to 2 decimal points. Th ere was no overlap acros s deciles. LT denotes lung transplant ation ; FEV 1 , forced y volu m e in 1 s; α-1 A T , alph a-1 antitr yp sin.
Table 4. Main baseline characteristics of the 6048 patients matched by propensity score according to type of lung transplantation.
Single LT (n=3024) Bilateral LT (n=3024) Standardized difference (%) Recipient characteristics Age (years) 53.3 (7.2) 53.2 (7.3) 1.5 Age distribution (%) < 50 [50 – 55[ [55 – 60[ ≥ 60 31.2 26.8 26.2 15.8 32.6 24.9 26.4 16.0 2.4 1.3 2.2 1.2 Female (%) 54.2 53.7 1.3 α-1 anti-trypsin deficiency (%) 23.0 23.8 2.4 NYHA Class‡ (%) I, II III IV 26.2 62.0 11.9 25.9 62.8 11.3 0.6 0.3 0.4 Diabetes (%) 3.9 3.4 3.3
Oxygen required at rest (%) 86.5 86.8 1.0 FEV1 (% of predicted) 22.1 (12.6) 21.8 (12.5) 0.4
FVC (% of predicted) 50.9 (18.2) 50.5 (18.5) 1.8 PAPs (mmHg) 36.7 (11.7) 36.7 (11.3) 0.3 Body mass index† 23.3 (4.4) 23.2 (4.2) 1.4
Donor characteristics
Age (yr) 34.0 (14.4) 34.4 (14.1) 2.0
Male (%) 64.0 63.6 0.3
Body mass index† 24.4 (4.3) 24.3 (4.2) 1.2
Diabetes (%) 3.3 3.4 0.4
Cause of death (%) Anoxia Stroke Head trauma
Central nervous system tumor Other 4.6 32.6 50.4 1.3 11.2 4.6 31.5 50.3 1.1 12.5 0 2.3 0.2 1.2 4.0 Donor/recipient characteristics CMV mismatch (%) 18.9 19.4 1.5 Gender mismatch (%) 25.6 25.7 0.2 Blood group mismatch (%) 9.6 9.0 1.3 Number of HLA mismatch 4.5 (1.1) 4.5 (1.1) 0.7
* Data are mean (SD) unless otherwise indicated. FEV1 denotes forced expiratory volume in 1 s; FVC, forced vital capacity;
PCWP, pulmonary capillary wedge pressure; PAPs, systolic pulmonary artery pressure. † Body mass index is the weight in kilograms divided by the square of the height in meters. ‡ NYHA, New York Heart Association: functional classes range from I to IV, with IV indicating that the patient experiences symptoms even at rest. Standardized difference is the mean difference divided by the pooled SD, expressed as a percentage.
Contributors
Gabriel Thabut, Raphaël Porcher and Philippe Ravaud conceived the idea, drafted the manuscript and analysed the data.
Jason Christie provided the data, contributed to data interpretation and revised the manuscript. Yves Castier, Hervé Mal, Guy Lesèche, Olivier Brugière and Michel Fournier contributed to data verification and revised the manuscript.
Conflict of interest statement
We declare that we have no conflict of interest.
30 Propor tion 0.0 0.2 0.4 0.6 0.8 1.0 < 1 9 9 2 199 3 1 9 9 5 1 99 7 1 99 9 2 0 0 1 2 0 0 3 200 5 0.0 0.2 0.4 0.6 0.8 1.0 42 0 356 4 6 7 5 35 5 4 6 5 43 61 3 6 3 5 66 0 7 3 4 741 789 7 4 1 742 7 4 7 4 20 N =
Fi
gur
e 1
Si ng le L T Bi la te ra l L T31 T im e ( year s ) Surv iv al( %) 02 4 6 8 1 0 0.00 0.25 0.50 0.75 1.00 N a t ri s k :9883 5 499 34 06 1 876 977 461 Si ngl e L T Bi la ter a l L T
Fi
gur
e 2A
32 T im e ( year s ) Surv iv al( %) Si ngl e L T Bi la ter a l L T 02 4 6 8 1 0 0.00 0.25 0.50 0.75 1.00 N a t ri sk : 6048 3 260 19 57 1 065 561 269
Fi
gur
e 2B
33 0.5 0 .75 1 2 > 60 year s 0 .95 ; (0 .81 -1 .13 ) 56 -6 0 ye a rs 0 .82 ; (0 .72 -0 .93 ) 50 -5 6 ye a rs 0 .87 ; (0 .76 -0 .98 ) < 50 year s 0 .82 ; (0 .73 -0 .92 )
Fi
gur
e 3
Reci
p
ien
t
a
ge
H
R
; (9
5
%
CI
)
Ha
z
a
rd
Ra
ti
o
34
Ha
z
a
rd
Rat
io
0.75 1 1 .5 P ropen s ity bas ed m a tc hi ng 0.89 ; ( 0 .80 -0 .97) Pr o pens it y dec il e + c o va ri ate s 0.86 ; ( 0 .81 -0 .93) Pr o pens it y dec il e 0.84 ; ( 0 .79 -0 .90) An al ys is of c o va ri anc e 0.83 ; ( 0 .78 -0 .92) U nadj us ted 0.76 ; ( 0 .70 -0 .83)Fi
gur
e 4
A
d
ju
st
me
nt
me
th
o
d
H
R
; (9
5
%
CI)
Online data supplement to:
Survival after bilateral lung transplantation versus single lung
transplantation for patients with chronic obstructive pulmonary disease: a
cohort study.
Gabriel Thabut, Jason D. Christie, Philippe Ravaud, Yves Castier, Olivier Brugière, Michel Fournier, Hervé Mal, Guy Lesèche, Raphaël Porcher.
This section details the method of multiple imputation that was used to handle missing data.
In this study, we used the multiple-imputation-by-chained equation to handle missing data.1 Multiple imputation is a Monte Carlo technique in which the missing values are replaced by m (m=5 in this study) simulated versions. The missing values are drawn from an appropriate distribution that characterizes the conditional relation of the imputed variables to other variables. Because the missing values are drawn from a distribution, a range of values will be imputed for each missing value, with this variation reflecting the uncertainty about this missing value.
The implementation of multiple imputation in this study is based on the procedure described by Raghunatan et al 1 and implemented in R (mice package).
Briefly, the multiple-imputation-by-chained equation proceeds as follows:
1. To get started, for each variable in turn, fill in missing values with randomly chosen observed values.
2. “Filled-in” values in the first variable are discarded, leaving the original missing values. These missing values are then imputed by regression imputation on all other variables.
3. The “filled-in” values in the second variable are discarded. These missing values are then imputed using “proper” regression imputation on all other variables.
4. This process is repeated for each variable in turn. Once each variable has been imputed using the regression method, one “cycle” is completed.
The process is continued for 10 cycles.
After imputation, each of the m completed datasets is analysed separately, and the results are combined 2,3 by use of the following formulas:
We define the following parameters:
m: the number of sets imputed and analyzed
i
βˆ : point estimate from analyzing the ith set
i
νˆ : variance estimate from analyzing the ith set β : combined estimate ofβ ν : combined estimate of v β =
∑
= m i i m 1 ˆ 1 βThe within-imputation variance is calculated as follows: within ν =
∑
= m i i m 1 ˆ 1 νThe between-imputation variance is calculated as follows:
between ν = 2 1 ) ˆ ( 1 1 β β − −
∑
= m i i m The total variance is:total ν = within between m ν ν ⎟ ⎠ ⎞ ⎜ ⎝ ⎛ + + 1 1 References
1. Raghunathan TE, Lepkowski JM, van Hoewyk J, Solenberger P. A multivariate technique for multiply imputing missing values using a sequence of regression models. Surv Methodol 2001;27:85-95.
2. Rubin DB, Schenker N. Multiple imputation in health-care databases: An overview and some applications. Stat Med 1991;10:585-598.
3. Little RJ, Rubin DB. Statistical analysis with missing data. New York.: John Wileys and Sons.; 1987.