An Object is Worth a Thousand Words
Un iversità della Svizzera italian a Software InstituteReification as the Key
to Augmenting Software
Development
Tommaso Dal Sasso
Prof. Dr. Michele Lanza
Dissertation Committee
Mehdi Jazayeri Università della Svizzera Italiana, Switzerland Cesare Pautasso Università della Svizzera Italiana, Switzerland Rocco Oliveto University of Molise, Italy
Martin Pinzger Alpen-Adria-Universität, Austria
Andy Zaidman Delft University of Technology, The Netherlands
Dissertation accepted on 14 June 2018
Research Advisor Prof. Dr. Michele Lanza
Ph.D. Program Co-Director Ph.D. Program Co-Director
Prof. Walter Binder Prof. Olaf Schenk
to qualify for any other academic award; and the content of the thesis is the result of work which has been carried out since the official commencement date of the approved research program.
Tommaso Dal Sasso Lugano, 14 June 2018
To my father, who taught me how to be a man. To my son, who teaches me what it means. To my mother, who taught me what love is. To my wife, who teaches it to me every day.
Alice:But I don’t want to go among mad people!
Cheshire Cat: Oh, you can’t help that. Most everyone’s mad here. You may have noticed that I’m not all there myself.
Alice in Wonderland
Abstract
Software development has become more and more pervasive, with influence in almost every human activity. To be able to fit in so many different scenarios and constantly implement new features, software developers adopted methodologies with tight development cycles, sometimes with more than one release per day. With the constant growth of modern software projects and the consequent expansion of development teams, understanding all the components of a system becomes a task too big to handle.
In this context understanding the cause of an error or identifying its source is not an easy task, and correcting the erroneous behavior can lead to unexpected downtime of vital services. Being able to keep track of software defects, usually referred to as bugs, is crucial in the development of a project and in containing maintenance costs. For this purpose, the correctness and completeness of the information available has a great impact on the time required to understand and solve a problem.
In this thesis we present an overview of the current techniques commonly used to report software defects. We show why we believe that the state of the art needs to be improved, and present a set of approaches and tools to collect data from software failures, model it, and turn it into actionable knowledge. Our goal is to show that data generated from errors can have a great impact on daily software development, and how it can be employed to augment the development environment to assist software engineers to build and maintain software systems.
Acknowledgements
“Oh, I’ve had such a curious dream!” said Alice, and she told her sister, as well as she could remember them, all these strange Adventures of hers that you have just been reading about; and when she had finished, her sister kissed her, and said “It was a curious dream, dear, certainly: but now run in to your tea; it’s getting late.”
So Alice got up and ran off, thinking while she ran, as well she might, what a wonderful dream it had been.
The years during my PhD were, unsurprisingly, among the most intense in my life. During these years my world changed—several times. Most of all I became a father, the most astonishing change that I have experienced in my life.
Many crossed my path during these years and contributed in shaping this experience. I thank you all for the path you shared with me: I hope I was able to give you at least a fraction of what I received.
Thanks to Michele, advisor and friend. I know I have been an unconventional PhD student, if anything because no PhD student is a conventional one. Nonetheless, you had the patience to wait for me during weird times. Maybe not crazy-Rumanian weird, but still weird times. Yours was an example that left a mark in me. I was no Mike Ross, but I still I hope that my passing left a trace in the REVEAL family.
Speaking of which, a big thank goes to the REVEALers, in particular those who were, for me, its hard core members: Andrea, Luca, and Roberto, who shared with me this journey from the beginning. I loved you. And I hated you. Often both at the same time. I find amazing how much we changed together during these years. You are family to me.
Thanks to the new generation REVEALers who shared with me this last part of my journey: Bin, Emad, Jevgenija, Csaba, and Gabriele. You brought a fresh touch into the group and it was a lot of fun. I wish you the best of luck with your adventure.
Thanks to the Dean’s office, for accepting my madness and backing it up with even more madness. Oh, yes, and for the chocolate, too.
Thanks to the Tymchuk family, Yuriy, Natalia, and Sophia. You literally made us part of your family. I know that our bond will last in time, regardless of how far apart we will be.
Thanks to the Pharo community, who allowed me to bring ShoreLine to life. I had to almost implement my own rest server —several times— to do that but, hey, it was fun.
Thanks to Alberto Bacchelli, who brought me to Lugano in the first place and occasionally acted as ghostwriter. I owe you a lot for inviting me during my master’s thesis. We share so many inside jokes that I am not able to pick one. Fottutorato.
Thanks to Marco D’Ambros, who took part with me in a lot of funny adventures during my early days in Lugano, even if he remembers none of them.
Thanks to Giulia Pizzinato, for being on our side when we needed it. I’m happy that Samuele had the oportunity of knowing you and witnessing your sparks of crazy happiness. There will always be pizza for you at our home.
A special mention goes to the people in charge of making badges at conferences: Rarely I have seen such a creativity as the one that you used in writing my name. I have to admit that “Sasso, Tommaso Dal” is a masterpiece.
Finally, a deep thanks goes to my family who, directly or indirectly, lived this adventure with me. Mom and Dad, you supported me in ways that I just started to understand, now that I am a father. I am proud of the name I bring: You made me part of two families who share a silent, powerful bond.
Samuele, my son, you brought the light in our lives. Looking at you exploring the world reminds me of how fulfilling it is to improve a little every day. I will always be proud of you.
Elena, you have been a constant presence at my side. We have been through a lot and I am proud of what we have done. I know that we have wonderful things waiting for us.
It will be amazing.
So Long, and Thanks for All the Fish Tommaso
Contents
Contents xi
List of Figures xv
List of Tables xvii
1 Introduction 1
1.1 Dealing With Software . . . 2
1.2 Thesis Statement . . . 2
1.3 Validation . . . 3
1.4 Roadmap . . . 4
2 State of the Art 5 2.1 Issue Tracking Systems . . . 6
2.2 Visualizing Bug Reports . . . 8
2.2.1 Visualizations of an Issue Tracker . . . 8
2.2.2 Visual Storytelling . . . 8
2.3 Bug Reports . . . 9
2.3.1 Quality of a Bug Report . . . 9
2.3.2 Bug Prediction . . . 10
2.3.3 Bug Reports and Social Interactions . . . 10
2.4 Data Collection . . . 10
2.4.1 Collecting Runtime Errors . . . 11
2.4.2 Errors as First-Class Citizens . . . 11
2.4.3 Aiding Bug Fixing . . . 12
2.4.4 Aiding System Comprehension . . . 12
2.5 Engaging Developers and Users . . . 12
2.6 Outline . . . 13
3 Visual Analytics of Bug Repositories 15 3.1 Accessing Bug Repositories . . . 16
3.2 IN*BUGin Detail . . . 18
3.2.1 Main view . . . 18
3.2.2 Details of a bug . . . 18
3.2.3 Implementation & Current Dataset . . . 20
3.3 More Than Meets the Eye . . . 21
3.4 Outline . . . 22
4 CrowdStacking Traces to Aid Problem Detection 23 4.1 Collecting Runtime Errors . . . 24
4.2 On the Nature of Stack Traces . . . 25
4.2.1 Interpreting Stacktraces . . . 27
4.2.2 A Practical Use Case . . . 27
4.3 CrowdStacking Traces . . . 28
4.3.1 Data Collection . . . 28
4.3.2 Data Representation . . . 29
4.3.3 Analysis on the Collected Data . . . 29
4.3.4 Extracting Information . . . 31
4.4 Preliminary Results . . . 34
4.5 Discussion . . . 37
4.5.1 The Data . . . 38
4.5.2 The Approach . . . 38
4.5.3 Applicability of the Method . . . 39
4.5.4 Next Steps . . . 39
4.6 Outline . . . 40
5 Reified Collection of Runtime Errors 43 5.1 The Tools We Use To Develop . . . 44
5.2 A Domain-Specific Reporting Engine . . . 45
5.2.1 Who Needs Models? . . . 45
5.2.2 Design of the Framework . . . 46
5.3 Implementing The Framework . . . 48
5.3.1 Implementation Details . . . 49
5.3.2 Using the Data . . . 50
5.4 The Framework at Work . . . 51
5.4.1 The Announcer Story . . . 51
5.4.2 The Testing Story . . . 56
5.4.3 Debugging Third Party Libraries . . . 57
5.5 Discussion . . . 58
5.5.1 Next Steps . . . 58
5.6 Outline . . . 59
6 Multi-concern Visualization of Large Software Systems 61 6.1 Exploring a System . . . 62
6.2 The Ingredients . . . 63
6.2.1 Source Code Changes . . . 63
6.2.2 SHORELINEREPORTERand Stack Traces . . . 64
6.2.3 DFLOWand IDE Interaction Data . . . 65
6.2.4 Blended, Not Stirred . . . 65
6.3 Visualization Principles . . . 66
6.3.1 In Practice . . . 66
6.3.2 The City Metaphor: Layout and Metrics . . . 67
6.3.3 Color Harmonies and Blends . . . 67
6.3.4 Under the Hood . . . 69
6.4 Telling Evolutionary Stories . . . 69
6.4.1 Those Awkward Neighbors . . . 70
6.4.2 Market Districts . . . 72
6.4.3 New in Town . . . 73
6.4.4 The Purple Buildings . . . 74
Contents xiii
6.6 Outline . . . 76
7 What Makes a Satisficing Bug Report? 77 7.1 Good Bug Reports vs. Real Bug Reports . . . 78
7.2 Research Method . . . 79
7.2.1 Research Questions . . . 80
7.2.2 Online Questionnaire . . . 80
7.2.3 Data Collection . . . 81
7.2.4 Data Analysis Techniques . . . 82
7.3 Results . . . 83
7.4 Discussion . . . 91
7.4.1 Threats to Validity . . . 91
7.4.2 Next Steps . . . 92
7.5 Outline . . . 92
8 How to Gamify Software Engineering 93 8.1 The Rise of Gamification . . . 94
8.2 Games and Gamification . . . 96
8.2.1 Why Do We Play Games . . . 96
8.2.2 Gamification: Principles, Promises & Perils . . . 97
8.3 Gamifying Software Engineering: (Not) An Easy Game? . . . 99
8.4 Software Engineering Gamification Framework . . . 100
8.4.1 Gamification Building Blocks . . . 101
8.4.2 Example I: The Myth and De-Bug . . . 104
8.4.3 Example II: The Empire of Gemstones . . . 106
8.5 Evaluating Gamified Systems . . . 108
8.6 Discussion . . . 110
8.6.1 Reflections . . . 110
8.6.2 Next Steps . . . 110
8.7 Outline . . . 110
9 Conclusion 113 9.1 Visualization of Bug Data . . . 113
9.1.1 Reading Between the Lines . . . 113
9.1.2 Narrating the Evolution of a System . . . 114
9.2 Collecting Failure Information . . . 114
9.2.1 Collecting Stack Traces . . . 114
9.2.2 Reifying Bug Reports . . . 114
9.3 Modeling an Issue Tracking System . . . 115
9.3.1 The Model of a Bug Report . . . 115
9.3.2 Gamification . . . 115
9.4 Limitations and Future Work . . . 115
9.5 Closing Words . . . 116
A Pharo 127 A.1 Smalltalk in the 21st Century . . . 127
A.1.1 Runtime Errors in Pharo . . . 127 A.2 The Pharo Community . . . 128
Figures
2.1 The first "bug" report. . . 5
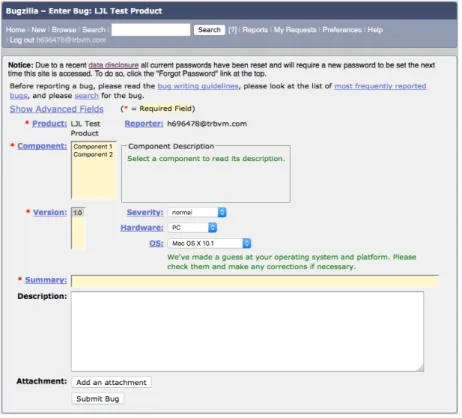
2.2 An old Bugzilla submission form . . . 6
2.3 GitHub bug report submission form. . . 7
3.1 Example bug report in the FogBugz bug tracking system. . . 16
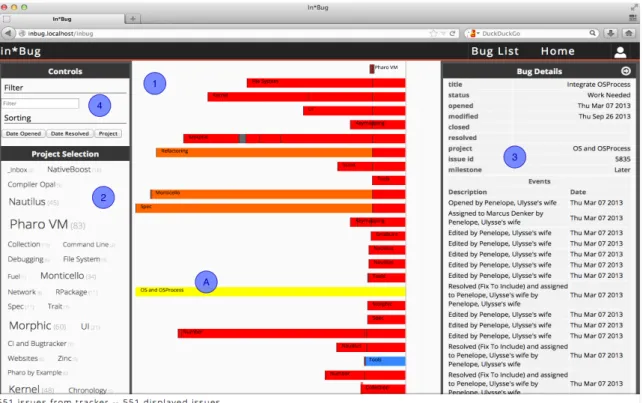
3.2 Main user interface of In*Bug . . . 17
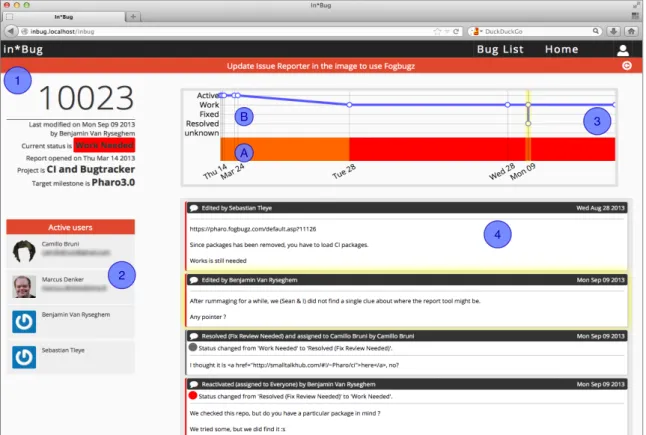
3.3 In*Bug details page showing the properties of a bug report . . . 19
3.4 List of events in a bug report . . . 20
3.5 The interactions of In*Bug with the FogBugz and SmalltalkHub services . . . . 21
4.1 Example of a stack trace collected from a runtime exception . . . 25
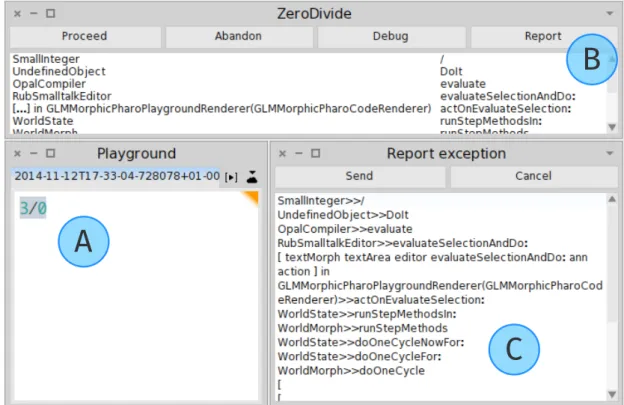
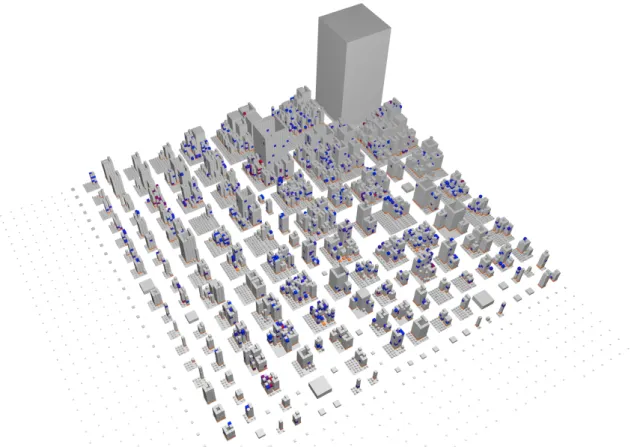
4.2 Distribution of the stack traces on the Pharo system using a city like visualization 26 4.3 The interactive interface of ShoreLine Reporter . . . 29
4.4 Distribution of the stack traces on the methods of Pharo using a city like visualization 30 4.5 Force graph representing the stack traces and their neighbors . . . 33
4.6 The bug report 12973 . . . 36
5.1 The workflow to collect data using collectors, showing the architecture of ShoreLine 49 5.2 The reporting window for ShoreLine . . . 51
5.3 A bug report describing a duplicated behavior . . . 53
5.4 The Smalltalk code implementing the extraction strategies for the Announcer collector 55 6.1 The Blended City – visualization principles and proportions . . . 66
6.2 The view depicted in Figure 6.1 . . . 67
6.3 Color wheel and triadic color scheme . . . 68
6.4 Linear color blend on triadic color scheme . . . 69
6.5 Aging process: example in the timeline . . . 69
6.6 View of the city with all the activities . . . 70
6.7 The architecture of the Blended City . . . 71
6.8 Details of the packages Graphics-Files and Compiler . . . . 71
6.9 Spec and Morphic market districts . . . . 72
6.10 Changes in the Pharo system . . . 73
6.11 The changes of GT-Tools packages . . . . 74
6.12 A view of the system highlighting stack traces and developer interactions only . . 75
7.1 Survey results . . . 83
7.2 Conceptual diagram of the model of a new bug report . . . 84
7.3 Transition graph of all the states in JIRA . . . 86
7.4 Transition diagram of all the states in Bugzilla . . . 88
8.1 Gamification Activity Template . . . 100
8.2 Concrete Gamification Activity . . . 105
Tables
3.1 Bug report event color codes . . . 18
3.2 Summary data of the Pharo bug tracker . . . . 21
4.1 Summary of the stack traces collected from June to November 2014 . . . 30
4.2 The 10 most called methods in the collected stack traces. . . 31
4.3 Summary of the most popular stack traces, with the popularity metrics. . . 34
5.1 Summary of the collected stack trace data . . . 54
6.1 Source Code Changes . . . 64
6.2 Stack Traces Data . . . 65
6.3 IDE Interaction Data . . . 65
7.1 Expertise of the participants of the survey (average) . . . 81
7.2 Overview of the projects in the dataset . . . 81
7.3 Contents of the dataset . . . 82
7.4 Different states of bug reports in Bugzilla and JIRA, with the count of the reports currently in each state and the total sum of all the times a bug report reached a state. 82 7.5 Number of custom fields per project . . . 89
7.6 Prediction results: Proportion of bug reports classified in the correct time bucket, with increment over random classification (25% correctly classified bug reports). 90 7.7 Prediction results for bug reports of last year. . . 90
8.1 Points acquired per 1 gemstone. . . 107
8.2 Required number and type of gemstones to obtain noble title. . . 108
1
1
1
1
1
1
1
1
1
1
1
1
1
1
1
1
1
1
1
1
1
Introduction
Everybody uses software. It may be the control system for a production environment of a large factory, a Customer Relationship Management system, a social network, an application on a smartphone, or a website to book a flight.
Regardless of its use, software plays a central role in modern society: It is used in almost every human activity to automate trivial tasks and to simplify complex ones. Its usage became massively pervasive, to the point that virtually any structured activity and process relies on software to regulate its workflow, minimize errors, and reduce costs. Moreover, the surge of popularity of mobile computing pushed even further the momentum of this scenario, bringing the influence of software into every aspect of our lives.
As a consequence, development teams are required to write code and push new features at a sustained pace, producing changes in the codebase that cause a system to constantly change and evolve its behavior, sometimes more than once a day. Often changes are performed by different developers, or even by different teams working on different parts of the system: Therefore, it quickly becomes impossible for a single person to have comprehension of the whole system. It is easy to understand how a software system can gradually start to resemble an unknown black box, rather than an organized entity composed of deterministic processes.
To complicate things even further, it is often not sufficient to have a deep knowledge of the whole set of components that form a system to predict its final behavior. Given the large number of requirements that modern software systems have to satisfy, it is usually necessary to rely on external libraries to provide the desired features. Using external code is a good practice, as it allows for reuse and reduces the probability of a bug being present in a library used by more people. However, these benefits come at the cost of yielding control of the system to external code, leading to the consequence that, if an error arises from a library, it becomes virtually impossible to track down its origin unless through debugging the library itself.
The main focus during a development cycle is writing new code to develop new features: However, in such a complex and ever-changing scenario, a huge part of the resources put in a project are spent in maintenance and debugging [Cor89, FH82, ZSG79, MML15]. We can break down the constituent components of maintenance in: finding and collecting problems, understanding them, locating the source of the error, and fixing the issue. Each one of these phases comes with its own set of problems and complexities.
In such a scenario, one would imagine that the efforts for assisting developers would focus on refined tools to navigate, understand, and inspect the code. While this is partly true, many of the modern editors and IDEs put the biggest accent on how developers write code, leaving program comprehension as a secondary task, despite it being intrinsically more complicated.
1.1
Dealing With Software
It is easy to sense why understanding software is hard: Reading code means reading text containing structured information, in a language that does not follow the same logic of natural language. To understand a fragment of code, a developer has to mentally parse a source file, identify and extract the necessary information, and build a mental model of the intended behavior of the software[VMV95]. The same process happens when printing log messages to expose the state of the system: Log messages embody fragments of information that the developer has to fit into her mental model, and use it to reverse engineer the source of an error by trial and error.
To ease this process, both researchers and industry practitioners built a plethora of tools, like debuggers and code inspectors, to allow developers to run a program in a controlled environment while checking the internal status of its variables. Other tools, like code browsers, support fast linking between the entities in the code, while loggers allow to print and store useful runtime information. Finally, test suites allow to define a set of expected behaviors, and to constantly check if any of these rules are satisfied.
All these tools however do not change the fundamental way we interact with the code: Eventually, the developer needs to read the code, and therefore undergo the process of building its mental model. The main cause for this is because all these tools rely on the same, strong, underlying assumption: Source code is text, therefore the tools we are using to interact with it are shaped around text editing tools. This assumption reflects the way we use to store our programs,
i.e.,plain-text files containing the declaration of our models.
In this thesis we propose a different approach for thinking about runtime errors and software defects. The data generated from runtime errors contains large amounts of information that is usually ignored, or stored in a textual format, that loses its original relations with the entities of the system. We propose to promote this class of data —such as bug reports and log files— to full-fledged entities and store them using objects, in order to maintain the relation with the original entities living in the system. The effect of treating entities such as bug reports or log files as first-class citizens of the development cycle, is that it enables us to deal with objects instead of plain text. This, in turn, provides the language to turn the data into information in the correct context. Such a tight integration allows us to enrich the tools we use to develop a system and creates a feedback loop with the developer that gives her a broader view on the evolution of a system.
We believe that discarding this data, usually considered as a disposable byproduct of the development process, wastes the enormous potential of an important data source. We want to leverage the usefulness of this data and turn it into actionable information that can effectively impact the development process and reduce maintenance costs.
1.2
Thesis Statement
The goal of our dissertation is to rethink how we deal we bug reports: We seek to increase the reliability of the data they contain and reduce the time required to read and understand them. We want to lay the foundations for a new generation of issue tracking systems, that leverages the power of the community and implements automated approaches to provide relevant information to developers [ZPB+10] and alleviate the problem of noise (i.e., duplicate or abandoned bug reports) inside existing issue trackers[WZX+08].
1.3 Validation 3
We formulate our thesis as follows:
Reifying bug reports, promoting them to first-class citizens of the development process, enables a conversation with a software system that reduces debugging time and enables automated and reliable usage analyses.
We analyze existing bug repositories to understand the kind of data that is collected and how developers exploit this information to fix software defects. We implement and test a set of exploratory tools to investigate the usage of bug reports in existing open source projects, and we design our process to collect data in a structured and reliable way.
1.3
Validation
Redesigning the concept of bug tracking is a task that encompasses a number of different sub-problems. Many of these problems come from the specifics of each development community and arise from the way developers approach their work.
Given the large number of variables in play, we feel that a canonical approach of selecting an idea, conducting a controlled experiment, and produce a conclusion would not be the best approach to narrate the problem we are studying. Instead, since we had the opportunity to propose our work to the PHAROcommunity, collect data from their day-to-day development work, and given the practical nature of the problem we considered, we decided to embrace a tool-driven approach and seek for the feedback of developers. We believe that conducting a full-blown evaluation process on a new issue tracking system would have been an impossible task, as its effects would begin to be observable only after years from its adoption. Therefore we decided to present a set of exploratory studies using the fresh development data we collected, and evaluate our approaches based on the feedback from developers.
1.4
Roadmap
This dissertation is structured in the following chapters and with the following contributions: Chapter 2 presents the history and evolution of tracking bugs, the current trends and best
practices.
Chapter 3 proposes a visual approach to explore the content of existing issue trackers, showing how a simple textual representation sometimes hides useful information in a bug database. We present IN*BUG, a tool for visually inspecting the contents of existing bug repositories, find hidden properties, and recurring patterns.[DSL13, DSL14, DS14].
Chapter 4 presents our approach for runtime errors retrieval, where we collect stack traces generated by the community during the development process to learn about the life of a system. We implemented our approach into ShoreLine, a platform that we deployed for the collection and reporting of runtime errors[DSML15].
Chapter 5 extends our stack traces collection approach, to log entities in a reified fashion and to capture the information implicitly stored in the relation among the objects. We extend ShoreLine to allow the reified collection of runtime data and allow a better representation of the status of a system during a failure[DSCM+17]
Chapter 6 shows how we can employ the data we collect to build tools that combine hetero-geneous data sources for browsing the evolution of a system from different perspectives. We show BLEND, a tool that merges different data sources to browse the evolution of PHARO[DSMML15].
Chapter 7 discusses the general model used by issue trackers and how it falls short in helping users when they have an issue to report. We present a survey we performed to investigate what users deem easy to provide in a bug report. We distill a meta-model for a minimal bug report, establishing a basic layer of core features. We propose an improved model to represent and store a bug report and the related data without losing information about its context.[DSML16].
Chapter 8 considers the problem of the engagement of developers during a tedious activity such as reporting and fixing bugs. We discuss how we can improve the user experience inside an issue tracking system by employing gamification[DSMLM17].
Chapter 9 concludes our work by summarizing the proposed approaches and how these can show the direction for the development of integrated issue tracking systems with smarter and deeper bug reports.
Appendix A presents a brief background on PHARO, the main platform that we targeted to develop and test our approaches and tools.
2
2
2
2
2
2
2
2
2
2
2
2
2
2
2
2
2
2
2
2
2
State of the Art
The birth of computer programming brought along the phenomenon of failures and errors. Since the beginning of the history of computer programming, developers needed a procedure to track and describe the appearance, impact, and resolution of the errors encountered during the evolution of a system. Figure 2.1 shows what the folklore considers to be the first bug report, written by Grace Hopper.1 From that handwritten paper note to present days, issue trackers evolved and adapted to reflect the different development practices introduced during the years. This led to a well established de facto model of a bug report.
Figure 2.1. This piece of paper is considered to be the first "bug" report. It was written by Grace Hopper when she was working on the Mark II computer, to document the find of a moth that caused a malfunction in the system.
1http://ei.cs.vt.edu/~history/Hopper.Danis.html
Figure 2.2. An old Bugzilla submission form
Correctness is arguably an essential property for a computer program to work. However, it is nearly impossible to determine whether a non-trivial program is really correct: the huge amount of different variables and environments that a program usually gets exposed to makes predicting all the potentially harmful situations an unmanageable task. Even if we could determine the absolute correctness of a program in a given moment in time, this does not guarantee that it will keep behaving correctly in the future: There are a number of external factors that influence the execution of a program that can trigger problems that could not be observed before. Such external factors could for example include changes in the underlying technology, like the operating system, or different usage conditions like a change of the input format. For this reason —since we cannot get rid of bugs— dealing efficiently with defects is a crucial aspect in the success of a software system.
In this chapter we illustrate the state of the art in issue tracking, providing an overview on the current tools and practices and the approaches they propose, to identify the useful elements in issue tracking.
2.1
Issue Tracking Systems
In 1998, the Mozilla Foundation released the first version of BUGZILLA, which would soon become the reference issue tracking system. During the years different alternative tools emerged, providing their own set of customizations and personalizations. In this section we present four platforms, selected by importance and overall adoption, showing their salient features: BUGZILLA, JIRA, the GITHUBissue tracker and FOGBUGZ.
2.1 Issue Tracking Systems 7
Figure 2.3. GitHub bug report submission form.
Bugzilla
BUGZILLA2 is one of the oldest and most popular issue tracking systems, that inspired many
existing issue trackers. Developed by the Mozilla Foundation, it is used by several open source projects, as well as industrial customers. BUGZILLAallows its users to obtain a great level of detail in specifying an issue at the price of a complex interface. Figure 2.2 shows the interface that BUGZILLAused to have in one of its previous versions.
Jira
JIRA3by Atlassian is one of the most famous commercial issue trackers, used by Twitter, Linkedin, and Ebay. It provides a polished interface and strong integration with the tools developed by the company. It uses a model similar to BUGZILLA.
GitHub
GITHUB4is a popularGitrepository hosting service, used to develop several popular open source projects, that offers a simple issue tracker. The submission form depicted in Figure 2.3 shows that GITHUBadopts a simplified model of a bug report, reducing but offers a strong integration with the versioned source code, by linking issues with specific commits.
FogBugz
FOGBUGZ5 is an issue tracker developed by FogCreek. It uses a bug model similar to the one of
BUGZILLA, slightly more polished and user-friendly, due to its clean user interface and advanced filtering capabilities. It poses a strong accent on customization, by letting users define custom filters and views.
2https://www.bugzilla.org
3https://www.atlassian.com/software/jira 4https://www.github.com
Together with these platforms, the open source and commercial scenes provide other popular solutions, like Redmine6 or Trac.7 It is however interesting to observe that, while these systems propose different degrees of integration with the tools in their ecosystem (e.g., the versioning system), the fundamental approach they adopt follows the same paradigm made popular by BUGZILLA: a textual description with additional customizable metadata. Further improvements to issue trackers, and the research around them, are built on top of this paradigm. In the following sections, we present the efforts of researchers to improve issue trackers and the model of a bug report in support of the bug fixing activity.
2.2
Visualizing Bug Reports
Many researchers showed how using data generated during the programming activity can provide valuable information about the evolution of a project. For example, Bacchelli et al. proposed an Eclipse plugin to integrate email communication in the IDE[BLH11]. They showed that having the email data produced during the development of a software system at one’s disposal helps supporting program comprehension tasks, such as finding entry points in a system and recovering additional documentation. Another example has been given by Zimmermann et al., who applied data mining techniques on version histories to detect changes and build prediction models to suggest future changes to developers[ZWDZ04].
2.2.1 Visualizations of an Issue Tracker
Just having the raw data, however, is often not enough: to turn it into actionable knowledge it is important to build tools to make use of this information. Reading a bug report is a difficult step in the debugging process: Browsing the large amount of information and deciding whether how much to rely on the data reported by the users, consumes a substantial amount of developers’ time. To alleviate this burden, researchers devised a number of approaches based on the visualization of the data inside issue trackers. For example, D’Ambros et al. performed an analysis of the BUGZILLAbug repository: They summarized the diagram of the state transitions of a report and
proposed a set of visualizations to support the analysis of a bug database at different levels of granularity. Their approach allows the user to navigate the history of a single issue tracker and inspect selected parts of the system with customized filters and a synthesized state transitions diagram of a report[DLP07]. They built visualizations to support the analysis of a bug database at different levels of granularity, depicing bug reports as independent entities. Their approach allows users to browse the history of an issue tracker and inspect parts of the system with custom filters. Knab et al. proposed visualizations to ease the understanding of the data in an issue tracker and find hidden patterns[KFGP09, KPG10]. Hora et al. proposed a visual exploration of the bug repository, creating interactive maps of the bugs in a system. To link bug reports to other software artifacts they argue the need for considering bugs as first class entities[HAD+12]. 2.2.2 Visual Storytelling
Even with the means to efficiently inspect single bug reports, getting a big picture of the data contained in an issue tracker, and how it relates to the system, is often a completely different
6https://redmine.org/ 7http://trac.edgewall.org/
2.3 Bug Reports 9
task, as the data has to be interpreted at a different level. To effectively present and understand such an amount of data, many researchers and practitioners adopt a Visual Storytelling approach. The ability of contextualizing the information in a story that explains the meaning of the data is becoming more and more central to the skills required for data scientists[SH10].
Among the different visualizations that researchers used to represent a software system, the city metaphor has proven to be effective in giving a high level picture of a group of entities, allowing the user to navigate, zoom and inspect the various components and refine the view[WLR11]. This approach has been adopted in different scenarios, depicting different kinds of information pertaining to several steps of the development activity, such as changes in the system, the defects involving different components in the system, issues in quality checking rules or the exceptions in the system[PBG03].
Other visualization approaches tried to focus on the evolution of software systems, specifically the version repositories, the dependencies or the structures. For example, Fischer et al.[FG06] proposed EVOGRAPH, an approach based on data extracted from a system release history, that visualizes the evolution of structural dependencies through 2D visual representations. Girba et
al. [GLD05] focused on the visualization of the evolution of class hierarchies, correlating the
history of classes and their relationships, e.g., inheritance. The approach by Voinea et al.[VT06] uses a combination of color and texture to represent as many attributes as possible to display information extracted from software configuration management systems. Another important approach is the one by Ratzinger et al.[RFG05], that represents systems as nested, zoomable graphs.
2.3
Bug Reports
Dealing with bug reports is a non-trivial task, that poses a number of communication problems among users and developers. Such a large, noisy, and sometimes redundant corpus of information, impacts the debugging time and the maintenance costs. To minimize this impact, researchers focused on improving several aspects of this process. In this section we present the efforts in automating the essential aspects of dealing with bug reports, such as its quality, its relevance, and predictions about the future behavior of the system.
2.3.1 Quality of a Bug Report
The reliability and completeness of bug reports is crucial to quickly solve a defect. Bissyande
et al. showed that most reporters that contribute to a project are not developers [BLJ+13], posing a problem on the quality of the data. To understand how developers perceive the quality of a bug report, researchers conducted a survey, asking which elements help understanding a problem. They found that stack traces are the most useful item and often contribute to a faster resolution of a defect, suggesting that they should be collected and included in issue trackers[ZPB+10, BJS+07, SBP10]. Even when reliable, though, the amount of information in an issue tracker can hide the relevant information: To alleviate the information overload, Sun devised a technique to detect bug reports without useful information[Sun11]. Besides incorrect information, bug repositories often contain duplicate entries for the same defect. However, developers do not consider this harmful, but instead find the additional information useful to better understand the problem[BPZK08].
Managing a large bug repository is often a burden that adds a new layer of complexity on top of the bug fixing problem. To alleviate this burden, researchers proposed to use automated approaches[Wei06]. For example, Anvik et al. observed that large open source projects are often
overwhelmed by the rate of new bug reports and proposed a machine learning based approach to to aid bug triaging decisions[AHM06], the process of selecting the right person to take care of an issue.
Guo et al. conducted a study to predict what impacts the resolution time of MS Windows bug reports[GZNM10], finding that a high number of reassignment of a report usually increases the issue lifetime, and that the reputation of the submitter also impacts the fixing time. Given the expensive nature of the bug fixing activity, a number of approaches exist to estimate the cost of a bug fix in person-hours[WPZZ07], predict bug fixing time [GPG10], locate features from bug reports[DRGP13], and perform traceability linking [BTW+13].
2.3.2 Bug Prediction
Solving defects does not represent the end of life of the information inside issue trackers: Yin
et al. show the danger of hidden complexity behind a bug report, finding that 4.8% to 24.4% of sampled fixes for post-release bugs introduced new defects[YYZ+11]. They also noted that “Developers and reviewers for incorrect fixes usually do not have enough knowledge about the involved code”, and that “27% of the incorrect fixes are made by developers who have never touched the source code files associated with the fix”. Once a bug report gets closed, the data inside issue trackers can still contain valuable information, and has been exploited to predict the evolution of the code. D’Ambros et al. presented several approaches devised by researchers to predict future defects[DLR12]. For example, Zimmermann et al. proposed an approach based on network analysis on dependency graphs among components, to allow managers to identify central program units that are more likely to face defects[ZN08]. Kim et al. suggested that defects tend to show in places previously affected by other defects, proposing a caching method to prioritize the elements in the code to inspect[KZWJZ07]. It is the source code that contains the defects, but these defects are introduced through changes: As such, Hassan et al. proposed metrics for bug prediction that consider the changes in the code, rather than the code itself[Has09]. Despite the efforts in improving the accuracy of the bug predicton approaches, Bhattacharya and Neamtiu showed the low correlation of current prediction techniques and underlined the need to find additional features to increase the confidence of the time estimates[BN11].
2.3.3 Bug Reports and Social Interactions
One of the core aspects of an issue tracker is that it collects social interactions in a community: Users can give feedback to the developers and obtain information on the system. Breu et al. analyzed a sample of 600 bug reports, finding that interacting with developers helps solving an issue faster[BPSZ10]. Zhou and Mockus showed that users involved in the development activity, like bug reporting and participating in the community, are more likely to become stable, long-term contributors[ZM15]. Therefore, improving issue trackers to foster the relations between developers and users could result in faster resolution of defects.
2.4
Data Collection
As we already mentioned, bug fixing is well known to be a tedious activity, and identifying the source of a problem—even with a bug report—represents a non trivial task. Reproducing and understanding the error is usually cumbersome, as the developer does not have access to the original environment where the error occurred. As a consequence, she cannot fully rely on the information in the report, as it might contain incomplete, or even incorrect information.
2.4 Data Collection 11
2.4.1 Collecting Runtime Errors
To ease the process of resolving defects, researchers have devised a number of approaches to complement the information reported by the user with additional information, for example by automatically collecting data about the environment where the error occurred. Zimmermann et al. showed that the bug reports containing stack traces improve the general quality of the report, and result in a faster resolution of the report[ZPB+10]. Schröter et al. provided empirical evidence analyzing the Eclipse project that the use of stack traces in defect resolution provides value in the debugging activity, and suggested that software projects should provide means to include them in defect reporting[SBP10].
The idea of collecting runtime exceptions to analyze software errors has been adopted by different authors in different contexts. Glerum et al. used an automated approach to collect errors generated and submitted by WER, the Windows Error Reporting tool. They analyzed data collected from users of Microsoft’s operating systems worldwide: In their approach approach they grouped the reports into buckets by looking for specific properties of the trace, and used this information to prioritize debugging and build a knowledge base where system administrators could check common problems of the system[GKG+09]. Inspired by this work, Han Shi et al. applied the same principle to performance debugging[HDG+12]: They proposed an approach called STACKMINE, designed to detect and report highly impacting performance bugs and address defects that cause long delays in the user experience. We believe that a similar approach to the one that they applied to an operating system, can be a valuable support for developers in building a programming environment. Mozilla adopts a similar approach to collect stack traces and runtime execution for debugging purposes[McL04].
The information of stack traces contained in bug reports represents a valuable support in debugging: as such, many researchers devised different methods to aid bug fixing and management of reports using stack traces. These works provided evidence that stack traces are a useful tool and a precious source of information[DR13, WKZ13, BMRC05, WPZZ07]: they provide precise information that are generally more reliable and useful than the descriptions produced by the submitter of the reports[KMC06]. Brodie et al. proposed an automated approach to group similar bug reports using stack trace[BMRC05]. Moreno et al. applied Text Retrieval techniques to compute similarity between bug reports using the stack traces contained in the report description, focusing on reducing the overhead to analyze large amounts of data[MTMS14]. Again, this was done in a localized post mortem way.
Managing bug reports is expensive and represents an open problem: Many studies proposed approaches to automatically manage them, by finding the right developer to fix the defect, predict the cost of fixing a bug and reduce maintenance costs[MKN09, AHM06, ´SZZ05, DLR10, LVZ10].
2.4.2 Errors as First-Class Citizens
Several tools in both academic and industrial contexts use the vast amount of data generated during the development and debugging process to enable a number of different analyses. However, any analysis of such kind sooner or later has to deal with the fact that the data collected is not in its original form: It is a representation of the original entities, serialized in a textual format. This, however, gives birth to a number of problems, as de-serializing is prone to interpretation and correctness errors, for example due to bad formatting. In this section we present an overview of the efforts to alleviate this class of issues.
2.4.3 Aiding Bug Fixing
The first major development activity that benefits from accessing clean runtime data is bug fixing. The purpose of the research in this area is to support and automate the identification of the portions of code that contain an error, thus alleviating the developer from the burden of walking through the whole execution path to localize the cause of a bug.
Several approaches use techniques to gather system information and detect errors in an automated fashion. For example, researchers collected large volumes of stack traces to identify patterns in the errors of a system, to assist the early detection of new problems or regressions, and to build a knowledge base of common problems[HDG+12, AADS+07]. The already mentioned survey performed by Zimmermann et al. finds that one of the biggest problems comes from the reliability of the reported data[ZPB+10], hinting at the need for an automated approach that collects meaningful data. Cleaning the data in log files is also an issue when inspecting the data, or while performing analyses. For example, Aye proposed a preprocessing stage to overcome the problem of huge log files in web applications, with the purpose of cleaning the data to allow a subsequent mining step[Aye11]. In the attempt of reducing the effort in crash debugging Soltani
et al. devised EvoCrash, an approach to reproduce a reliable environment describing the context of a failure using genetic algorithms[SPvD17].
2.4.4 Aiding System Comprehension
Researchers used the massive amount of data produced by the execution of a system to create a view of the system at a global level, to detect hidden interactions or unexpected patterns and give an overview of the system, resulting in a large number of different studies and approaches[CZVD+09]. For example, Koike proposed a tool to visualize log files of the Snort8 intrusion detector and assist system administrators to identify intrusion attempts in a system [KO04]. Moreta and Telea visualized log files using hierarchical clustering to uncover patterns of interest, with the purpose of monitoring dynamic allocation of memory and support the analysis of software repositories [MT07]. Orso et al. proposed a tool to monitor the logs of deployed software by means of visualizations generated by data mining techniques applied on runtime execution data[OJH03]. De Pauw et al. built a tool to visualize the execution of Java programs, with the purpose of aiding the developer to understand the execution of the program and identify problems like performance bugs[DPJM+02].
Finally, researchers also tried approaches to improve the textual representation of software artifacts by augmenting their description with a markup language[Bad00, MCM02].
2.5
Engaging Developers and Users
Despite all the tools that researchers and practitioners produced, fixing bugs remains a tedious activity. To support developers deal with an issue, there have been a few efforts in introducing
gamification—the use of game elements in a non gaming context— into software engineering. Passos et al.[PMNC11] proposed to gamify the phases of software lifecycle by splitting the whole process into tasks, and setting achievements for their completion. While this is an interesting approach, it is essentially a pointsification, and as such puts too much emphasis on the rewards, thus being ineffective on the long run. Singer and Schneider performed a study on the gamification of commit messages [SS12]: they managed to influence the workflow of the students in the experiment, improving the workflow. They however received both positive and negative comments.
2.6 Outline 13
Dubois and Tamburelli[DT13] pointed out that software projects often produce mediocre quality artifacts, do not respect the terms for milestones, or exceed the financial budget. They claimed that gamification could represent a solution to the issue, but only outlined a possible approach to gamification based on the three steps analysis, integration, and evaluation. Probably still being in the inception phase they did not provide concrete suggestions or a systematic set of recommendations.
2.6
Outline
In this chapter we have presented the efforts of practitioners and developers to support the activities of tracking and solving bugs. We believe that these efforts represent the desire of building smarter issue tracking system, that integrate with the IDE and interact with the existing development tools to reduce the time that developers spend dealing with boring and repetitive tasks. In the following, we present our contributions with respect to the state of the art.
Visualizations and analyses
The approaches that we saw focus on retrospective analyses. We believe that while conceptually interesting, there is little practical utility in daily development, since after all the goal of an issue tracking system is not to look at defects, but to actually fix them. This implies that even the most elaborated techniques are of limited actionability, since the bug fixing process takes place in a different space, namely the integrated development environment (IDE). We believe that the use for a visualization is not to simply display the data, but to establish a first-class link to the development environment.
In Chapter 3 we present IN*BUG, our tool for browsing issue trackers in a visual fashion, highlighting properties that are normally hidden when using plain text.
Collecting Runtime Data
We saw different approaches for program comprehension, focused on describing source code, that are still relevant to support bug fixing, as they explicitly render the properties that are hidden in the textual form of the source code.
In Chapter 4 we present our approach to data collection. In this context, we think that associating new stack traces to existing bug reports could provide immediate feedback to the users of the system and to assist development and bug fixing in a live fashion. In Chapter 5 we then propose a tool for collecting domain-specific data about failures in a system, to enable a reliable and conversational data source.
Visual Storytelling
Researchers presented several approaches to effectively visualize data about a single aspect that impacts or involves a system. However, these approaches fall short in correlating this information with knowledge coming from diverse data sources and impacting diverse concerns. Such additional information could effectively integrate the existing data to uncover further relations between the elements of the system. We think that an approach that considers more than one kind of data and presents the information in a unified, uniform view, normalizing and balancing each source, could provide a greater value in understanding a software project and the activities happening in its ecosystem.
In Chapter 6 we present a case study of visualizing and combining multiple data sources about a software system. From this visualization we are able to learn interesting stories about the evolution of the system.
Modes for Bug Reports
We saw that different bug tracking systems propose different strategies to describe a bug report. In Chapter 7 we investigate what developers believe to be difficult to provide when writing a bug report, to deepen our understanding of the problem of data reliability inside issue tracking systems. We then examine the data contained inside big issue tracking systems and try to define the minimal model to describe a software error.
Gamification
The engagement of users is a problem that is bringing more and more people interested in the use of gamification applied to software engineering. In Chapter 8 we present a framework to support developers during the design of a gamification engine applied to their systems and communities, highlighting the perils that an inconsiderate use of points and badges can bring.
3
3
3
3
3
3
3
3
3
3
3
3
3
3
3
3
3
3
3
3
3
Visual Analytics of Bug Repositories
Bug tracking systems are used to track and store the defects reported during the life of software projects. The underlying repositories represent a valuable source of information used for example for defect prediction and program comprehension [SFM99]. However, as we mentioned in Chapter 1, bug tracking systems store and present the actual bugs essentially in textual form, which is not only cumbersome to navigate, but also flattens the information, hindering the understanding of the intricate and multifaceted pieces of information that revolve around software bugs. We begin our journey towards an improved representation for a bug report by analyzing existing bug repositories, to investigate where the information that they contain can actually be leveraged to improve the knowledge that we have on the system.
In this chapter we present IN*BUG, a web-based visual analytics platform to navigate and inspect bug repositories. IN*BUG provides several interactive views to understand detailed
information about the bugs and the people that report them. Structure of the Chapter
Section 3.1 introduces the issues of dealing with data in issue trackers. Section 3.2 presents in detail the views that compose IN*BUG. Section 3.4 concludes the chapter summarizing what we
learned visualizing issue tracking systems.
3.1
Accessing Bug Repositories
Due to the complexity and size of non-trivial software projects, the development of a system is always accompanied by software defects, or bugs. To manage these defects, modern software projects use bug tracking systems (also known as bug trackers or issue trackers), such as Jira or Bugzilla. With bug trackers, end users and developers can report bugs they encountered while using the system, usually by means of custom web interfaces, where one can enter details about a specific bug, creating a so-called bug report. A typical bug report, such as the one depicted in Figure 3.1, contains information about (1) the title and id of the bug, (2) the user who reported the bug and the people involved in its history, (3) its current status, (4) its opening and closing date, (5) its last modification date, (6) the project to which the bug report pertains, (7) events (such as changes of the people assigned to the bug report, etc.) during the life cycle of the bug, etc. The example bug report depicted in Figure 3.1 is from a specific bug tracker, FogBugz1, but it does not differ significantly from the reports recorded with other bug trackers.
3 2 5 1 4 6 7
Figure 3.1. Example bug report in the FogBugz bug tracking system.
Various researchers have mined and used the information stored by bug trackers to perform several types of analyses, such as identifying duplicate bug reports[WZX+08], measuring the quality of a report[ZPB+10], predicting future defects [DLR12], performing traceability link-ing[BTW+13], locating features [DRGP13], ameliorating bug triaging decisions [AHM06], etc. The actual goal however is to ease the life of developers in the handling of bug reports, as part of the development process.
One problem is that bug reports are disconnected from the software system they pertain to, and it is up to the developers to restore the link between a bug report and the relevant components
3.1 Accessing Bug Repositories 17 1 2 A 4 3
Figure 3.2. Main user interface of In*Bug
of a system. Another problem is that bug reports, such as the one depicted in Figure 3.1, are displayed on individual web pages that list their properties, making them cumbersome to handle and making it also difficult to obtain a “big picture” of the existing open bug reports and how they affect the system they pertain to. Moreover, this information is stored and presented as text, which makes it hard to understand the properties of a bug report.
We present IN*BUG, a web-based bug analytics platform, that eases the inspection, navigation, and comprehension of bug repositories, mostly by means of interactive visualizations. IN*BUG
provides an entry-level big picture overview to browse the content of a repository, and a detailed, complementary, interactive, and finer-grained view to understand detailed information about the bugs and the people that report them.
Other researchers have produced custom visualization of bugs such as D’Ambros et al., who proposed visualizations that tried to depict the complex information revolving around bugs, which are de facto independent entities when it comes to program comprehension, and not mere side effects of the evolutionary process that software systems are subjected to[DL07, DLP07]. While D’Ambros et al. only created standalone and static depictions of information taken from BugZilla, our goal with IN*BUGis to depict live data from a bug tracker, namely FogBugz, as it is the issue tracking system used by the PHAROcommunity. The goal of IN*BUGis to offer a complementary view to inspect and analyze information pertaining to bugs reported in the context of the many projects that make up a software ecosystem. We built IN*BUGaround the issue tracking system of the PHAROopen-source community.
We now present the features of IN*BUG, discuss its current implementation, and illustrate its
3.2
In*Bug in Detail
In this section we present the interface of IN*BUG, detailing its panels and how we used the data in the issue tracking system to build the visualizations.
3.2.1 Main view
Figure 3.2 depicts the main user interface, composed of the following panels:
Bug lifetime panel (1). This view depicts the bug reports contained in the bug repository, showing their duration (as a horizontal stacked bar chart) and status (using different colors, listed in Table 3.1).
Table 3.1. Bug report event color codes
Active orange Work Needed red
Closed gray Resolved dark gray
Working On blue On Hold cyan
Unknown light grey Selected yellow
In Figure 3.2 one specific bug (marked as A) is under focus. The vertical line to the right indicates the current date, making it also clear whether a bug report is still active or not (if it is, it will touch that line). This view also helps the developer to evaluate the complexity of a bug report by summarizing the events that occurred during its lifetime.
Project selection panel (2)
In this panel the user can pick the projects whose bugs she is interested in. All projects are shown as a tag cloud, where the tag size indicates the number of bugs reported for the project, also indicated with numbers between parentheses close to the name of the projects.
Details panel (3)
This panel provides all the information reported about the bug report under focus in the bug lifetime panel: It presents both the metadata and the list of events that happened during the lifetime of a bug, including description and date of each event. The metadata is presented as extracted from the bug repository, e.g., the opening date, the status, the last modification date, etc.
Filter and options panel (4)
This panel allows the user to sort and filter bugs. The three default sorting criteria order the issues by project, opening date, or date in which the bug has been resolved. The filter field offers the possibility to enter either regular expressions or pieces of Smalltalk code as queries, allowing the users to submit custom made queries to filter bugs.
3.2.2 Details of a bug
This view (see Figure 3.3) presents a detailed representation of a specific bug report. Each section provides a description of the elements that compose a bug report.
3.2 In*Bug in Detail 19 1 2 3 4 A B
Figure 3.3. In*Bug details page showing the properties of a bug report
Bug Report Metadata (1)
The first panel summarizes the important metadata of the bug report: the id, the last modification, the current status, the opening date and possible closing date, the project and the target milestone for the issue resolution.
Users List (2)
This panel gives an overview of the people involved in the evolution of the bug. In particular, the list displays the information of each user that performed an action on the issue, that was stored as an event. The details include the picture of the user, the user name and the user’s email address2, to contact the people working on an issue.
Bug Report Life Visualization (3)
This panel shows a visualization of the life of a bug report during time. The left border represents the date the issue was opened, the right border represents the moment the bug was closed, or the current date if the bug report is still active. The (A) section proposes the same visualization of the list view in the main view (3.2.1), emphasizing the status changes during time. The (B) section shows a line diagram where the height represents the criticality of the status (i.e., fixed is the lowest and active is the hightest) and highlighting each event with a circle.
A
B
C
Figure 3.4. List of events in a bug report
Event Interactive View (4)
This is a list of all the events that compose a bug report. It shows the metadata of the event and whether it is an automatic event or an event generated by a user. It also detects and highlights the patches of code submitted to the tracker for the issue resolution, and provides a link to download and inspect the patch. The user can click on an event to highlight it both in the events list and in the bug report lifetime visualization. Figure 3.4 shows an example of the event list, where we can observe the three types of events: (A) shows a comment by a user; (B) shows a submitted patch. The upper left icon offers a link to the repository page of the patch; (C) indicates events automatically generated from bots in the tracker. Inspired by more semantically rich and elaborated views, such as the storylines by Ogawa et al.[OM10] or Kuhn and Stocker’s storytelling timelines[KS12], the left border of each event is colored according to the status of the event, to help the user to keep track of the evolution of the bug while inspecting the list of events.
3.2.3 Implementation & Current Dataset
IN*BUGis a web application built on top of the PHAROenvironment. It uses the SEASIDEweb
framework[DRSZ10] to provide the data stored in a MongoDB database and implements a RESTful
3.3 More Than Meets the Eye 21
IMPORT MongoDB
Patches Bug List View
Details View Web Application
Figure 3.5. The interactions of In*Bug with the FogBugz and SmalltalkHub services
data manipulation and visualization library D3.js.3
IN*BUGis built to visualize the FOGBUGZrepository of the Pharo ecosystem. In Table 3.2 we
provide a summary of the data we investigated.
Table 3.2. Summary data of the Pharo bug tracker
Number of projects 46
Number of bug reports 8,666
Number of open bug reports 613
Total number of events 79,437
Average events per issue 9
IN*BUGalso provides links to patches on SmalltalkHub, a source code repository to store versioned Smalltalk code. In Figure 3.5 we can see how these three services interact.
The bug reports data is imported from FogBugz and stored in the MongoDB repository. The web application then loads the data and presents it in the list view of the main interface. The details of a single report are presented in the details view, where the user can follow a link that leads to a patch submitted to SmalltalkHub.
3.3
More Than Meets the Eye
While developing IN*BUGwe verified that providing a visual feedback using data that is usually
consumed through plain text is an effective method to observe and investigate properties that would normally be hard to isolate. For example, in Figure 3.2 we can easily separate the bug reports that are older from the newer ones, observe the amount of activity happening on an issue, spot cases where a bug report was reopened several times, or identify abandoned reports. The experience of serving textual data using a visual representation convinced us that a textual representation we employ in issue tracking systems is limiting the amount of information that a user can absorb.
3.4
Outline
In this chapter we presented IN*BUG, a web-based visual analytics platform to explore the content of a bug repository. IN*BUGallows to get a complete overview of a whole repository, as well as detailed and meaningful information on a single bug report, either through visualizations that allow to interact with the data, or with the query engine embedded in IN*BUGthat allows the user to submit queries and dialog directly with the bug reports.
Since we designed IN*BUG as a tool for practical development, we focused on the Pharo
platform and we targeted its community. However, the approach of IN*BUG is general and therefore it can be applied to any bug tracking system.
We saw that existing bug repositories contain information that can be highlighted using means other than plain text: This is a first important step in promoting bug reports as independent entities. The underlying information we display, however, is still in textual form, with the consequence that we have to rely on the expertise of the user to obtain useful information. We therefore decided to tackle the problem of the reliability of the data by means of automatic data collection during a software failure. In the next chapter we present our approach to crowd-driven data collection: We collect and investigate a large amount of stack traces generated during development activities, to provide automated and reliable feedback to users and developers.
4
4
4
4
4
4
4
4
4
4
4
4
4
4
4
4
4
4
4
4
4
CrowdStacking Traces to
Aid Problem Detection
During software development, exceptions are by no means exceptional: Programmers repeatedly try and test their code to ensure that it works as expected. While doing so, runtime exceptions are raised, pointing out various issues, such as inappropriate usage of an API, convoluted code, as well as defects. Such failures result in stack traces, lists composed of the sequence of method invocations that led to the interruption of the program. Stack traces are useful to debug source code, and if shared also enhance the quality of bug reports. However, they are handled manually and individually, stored in a bug report as a copy-and-paste chunk of text that complicates the automatic processing of the information and raises questions about their reliability.
In the previous chapter we saw how treating bug reports as flat entities can hide properties that would be useful in the development process. In this chapter we argue that stack traces can be leveraged automatically and collectively to enable what we call crowdstacking, the automated collection of stack traces on the scale of a whole development community. We present our crowdstacking approach, supported by SHORELINEREPORTER, a tool which seamlessly collects stack traces during program development and execution and stores them on a central repository. We illustrate how thousands of stack traces stemming from the IDEs of several developers can be leveraged to identify common hot spots in the code that are involved in failures, using this knowledge to retrieve relevant and related bug reports and to provide an effective, instant context of the problem to the developer.
Structure of the Chapter
Section 4.1 outlines the elements involved in collecting runtime information about software errors. Section 4.2 illustrates the nature of stack traces and describes the data generated during the development process. Section 4.3 introduces SHORELINE REPORTERand the methodology we used to collect stack traces, as well as the process to link them to relevant bug reports. Section 4.4 evaluates our approach. Section 4.5 discusses our results and presents the possible extensions to our approach. Section 4.6 concludes the chapter.