ATP released by intestinal bacteria limits
the generation of protective IgA against
enteropathogens
Michele Proietti
1,8
, Lisa Perruzza
1
, Daniela Scribano
2,3
, Giovanni Pellegrini
4
, Rocco D
’Antuono
1
,
Francesco Strati
1
, Marco Raffaelli
1
, Santiago F. Gonzalez
1
, Marcus Thelen
1
, Wolf-Dietrich Hardt
5
,
Emma Slack
5
, Mauro Nicoletti
2
& Fabio Grassi
1,6,7
T cell dependent secretory IgA (SIgA) generated in the Peyer
’s patches (PPs) of the small
intestine shapes a broadly diverse microbiota that is crucial for host physiology. The
mutualistic co-evolution of host and microbes led to the relative tolerance of host
’s immune
system towards commensal microorganisms. The ATP-gated ionotropic P2X7 receptor limits
T follicular helper (Tfh) cells expansion and germinal center (GC) reaction in the PPs. Here
we show that transient depletion of intestinal ATP can dramatically improve high-af
finity IgA
response against both live and inactivated oral vaccines. Ectopic expression of Shigella
flexneri
periplasmic ATP-diphosphohydrolase (apyrase) abolishes ATP release by bacteria and
improves the speci
fic IgA response against live oral vaccines. Antibody responses primed in
the absence of intestinal extracellular ATP (eATP) also provide superior protection from
enteropathogenic infection. Thus, modulation of eATP in the small intestine can affect
high-affinity IgA response against gut colonizing bacteria.
https://doi.org/10.1038/s41467-018-08156-z
OPEN
1Institute for Research in Biomedicine, Università della Svizzera Italiana, Via Vincenzo Vela 6, 6500 Bellinzona, Switzerland.2Department of Medical and
Oral Sciences and Biotechnologies, University‘‘Gabriele D’Annunzio’’, Via dei Vestini, Campus Universitario, 66100 Chieti, Italy.3Department of Public Health and Infectious Diseases, University‘‘La Sapienza’’ of Rome, Piazzale Aldo Moro 5, 00185 Rome, Italy.4Laboratory for Animal Model Pathology, Institute of Veterinary Pathology, Vetsuisse Faculty, University of Zurich, Winterthurerstrasse 268, 8057 Zurich, Switzerland.5Institute of Microbiology, ETH Zürich, Vladimir-Prelog-Weg 4, 8093 Zürich, Switzerland.6Istituto Nazionale Genetica Molecolare‘‘Romeo ed Enrica Invernizzi’’, Via Francesco Sforza 35,
20122 Milan, Italy.7Department of Medical Biotechnology and Translational Medicine (BIOMETRA), Università degli Studi di Milano, Via Vanvitelli 32,
20129 Milan, Italy.8Present address: CCI-Center for Chronic Immunode
ficiency, Universitätsklinikum Freiburg, 79106 Freiburg, Germany. These authors contributed equally: Michele Proietti, Lisa Perruzza. Correspondence and requests for materials should be addressed to F.G. (email:[email protected])
123456789
E
nteric pathogens such as enteropathogenic E. coli and
non-typhoidal Salmonella are a major health burden in both
humans and animals. The rapid spread of antibiotic
resis-tance in these species highlights the need for better disease
pro-phylaxis. Protection from infection is most effective when strong
mucosal immune responses have been induced, either by prior
infection or by oral vaccination
1,2. High-affinity secretory IgA
(SIgA) promotes enteropathogen enchainment and aggregation to
disable and clear potentially invasive species from the intestinal
lumen
3. However, balancing safety of the vaccination strain with
sufficient immune stimulation has proved challenging
4.
T follicular helper (Tfh) cells express high levels of the
ATP-gated P2X7 receptor, a non-selective cationic channel that opens
to form a cytolytic pore when exposed to micromolar
con-centrations of extracellular ATP (eATP). P2X7 activity therefore
controls Tfh cells abundance in Peyer’s patches (PPs): Resistance
of Tfh cells to ATP-mediated cell death by deletion of P2X7
enhances germinal center (GC) reactions
5. As eATP is produced
in large quantities by the intestinal microbiota, this directly
suppresses commensal-specific IgA responses primed in the
gut-draining lymphoid tissues and affects microbiota composition
6.
This study is based on the hypothesis that similar effects may
dampen immunity against enteric pathogens and oral vaccines.
We show that ATP released by intestinal bacteria permeates
the intestinal epithelium and can be found at high concentrations
in hepatic portal blood. Eliminating this eATP, via administration
of apyrase, dramatically improves the induction of specific IgA in
response to either Salmonella infection or an inactivated oral
vaccine. We could not measure any adverse effects of altered
anti-microbiota immunity secondary to oral apyrase administration,
suggesting that apyrase application is safe. Moreover, these
enhanced immune responses provide superior protection from
secondary infection.
Results
ATP released by microbiota affects Tfh cells in PPs via P2X7.
In the small intestine and portal vein of specific pathogen free
(SPF) mice, we measured micromolar concentrations of eATP
that was detected at much lower levels in germ-free (GF) mice or
in other circulatory districts (Fig.
1a, b). To address the
con-tribution of the epithelium to eATP in the small intestine, we
induced epithelial regeneration in the ileum by starvation and
re-feeding, as described
7. In the presence of bacteria, the variations
in epithelial turnover by starvation and re-feeding corresponded
to undistinguishable concentrations of ileal eATP. In the absence
of bacteria, starvation did not affect the percentage of
pro-liferating cells
8. However, the concentration of ileal ATP was
dramatically reduced with respect to SPF mice with comparable
amount of proliferating epithelial cells, suggesting that the great
majority of eATP measured in the ileal lumen is of bacterial
origin (Supplementary Figure 1a, b). Therefore the microbiota
generates high levels of eATP that can penetrate into the
intest-inal epithelium and draining blood. We cannot exclude that
fungi, archaea, and protozoa might also contribute to the eATP
present in the intestinal lumen. Consistent with other reports
9,10;
eATP was detectable in cultures from different bacterial strains
isolated from ilea of our mouse colony (Fig.
1c) and could be
acutely exacerbated by vancomycin/ampicillin/metronidazole
(VAM) treatment (Fig.
1d, e). In vivo VAM administration
resulted in an acute significant increase of eATP in the ileum and
portal vein blood (Fig.
1f). In wild type (WT), but not P2rx7
−/−mice, VAM administration-induced enhanced
phosphatidyl-serine (PS) exposure in Tfh cells from PPs (Fig.
1g and
Supple-mentary Figure 1c, d), suggesting bacteria-derived eATP can
modulate high-affinity SIgA response. Antibiotic treatment can
be contraindicated in acute bacterial gastrointestinal infections
due to negative effects on microbiota recovery. This data further
suggest that antibiotic treatment may negatively effect the
induction of T-cell dependent intestinal immunity in these
infections.
Enhanced SIgA response by depletion of eATP. The IgA
response to E. coli is dependent on Tfh cells in PPs
11and is
significantly enhanced in P2rx7
−/−mice
5, suggesting that P2X7
activity can affect the T-cell dependent SIgA response. To address
whether depleting bacteria-derived ATP could influence T
cell-dependent IgA responses via P2X7, we used a recombinant E. coli
strain (E. coli
pApyr) carrying an expression plasmid for Shigella
flexneri's periplasmic ATP-diphosphohydrolase (apyrase)
(Sup-plementary Figure 2a–d)
12,13. The supernatant of E. coli
pApyrcultures showed ATP-degrading activity that was absent in E.
coli
pBAD28(Fig.
2b); its fractionation resulted in the recovery of
apyrase activity within outer membrane vesicles (OMVs),
sug-gesting the enzyme was released in the extracellular space (Fig.
2a,
c). Notably, eATP
14,15was undetectable in cultures of E. coli
pApyr,
indicating that apyrase efficiently degraded ATP (Fig.
2d). To
address whether bacteria-derived ATP could selectively limit
SIgA responses in the small intestine of normally colonized
ani-mals, we administered E. coli
pApyror E. coli
pBAD28as control, to
SPF mice by orogastric gavage (Supplementary Figure 3b).
Administration of E. coli
pApyrresulted in the increase of Tfh cells
in the PPs concomitant to reduced Annexin V staining in
flow
cytometry, suggesting degradation of bacterial ATP reduced Tfh
cell death via P2X7 receptor (Fig.
3a). As expected, we observed a
poor SIgA response to E. coli in mice gavaged with E. coli
p-BAD2816
. However, anti-E. coli IgA was significantly increased in
mice gavaged with E. coli
pApyr(Fig.
3b, c), despite identical
intestinal E. coli load (Supplementary Figure 3a), indicating that
abrogation of ATP release by bacteria results in the development
of high-affinity IgA responses. The analysis of IgA in intestinal
washes from mice gavaged with the two E. coli transformants on
different bacterial species revealed lack of detectable reactivity
(Supplementary Figure 4a). Moreover, intestinal IgA from
untreated and immunized mice stained an analogous percentage
of commensals from WT mice (Supplementary Figure 4b),
indicating the absence of epitope-spreading to resident
micro-biota members.
To further address the role of ATP released by bacteria in
modulating the SIgA response, we monitored endoluminal ATP
after orogastric administration of E. coli
pBAD28and E. coli
pApyrin
mice maintained with Chloramphenicol and Ampicillin (CA) (a
bactericidal mix active on endogenous
flora but not on
CA-resistant E. coli
pBAD28and E. coli
pApyr) or
Penicillin/Streptomy-cin/Vancomycin (PSV) (bactericidal on both endogenous
flora as
well as E. coli transformants) in drinking water (Fig.
3d). Oral
gavaging with E. coli
pBAD28in mice maintained in PSV as
compared to CA resulted in a significant acute increase of
endoluminal ATP because of bacterial lysis (Fig.
3e). Notably, the
analysis of anti-E. coli IgA after multiple gavaging in this setting
showed that the increase in eATP concomitant to E. coli
pBAD28gavaging in the presence of PSV correlated with reduced anti-E.
coli IgA with respect to the group treated with non-bactericidal
CA (Fig.
3f). In contrast, in mice colonized with E. coli
pApyr, ATP
degradation by apyrase in both treatment groups (Fig.
3e)
resulted in undistinguishable anti-E.coli IgA response (Fig.
3f).
These data further show that an increased release of ATP by
bacteria corresponds to a reduced generation of specific IgA.
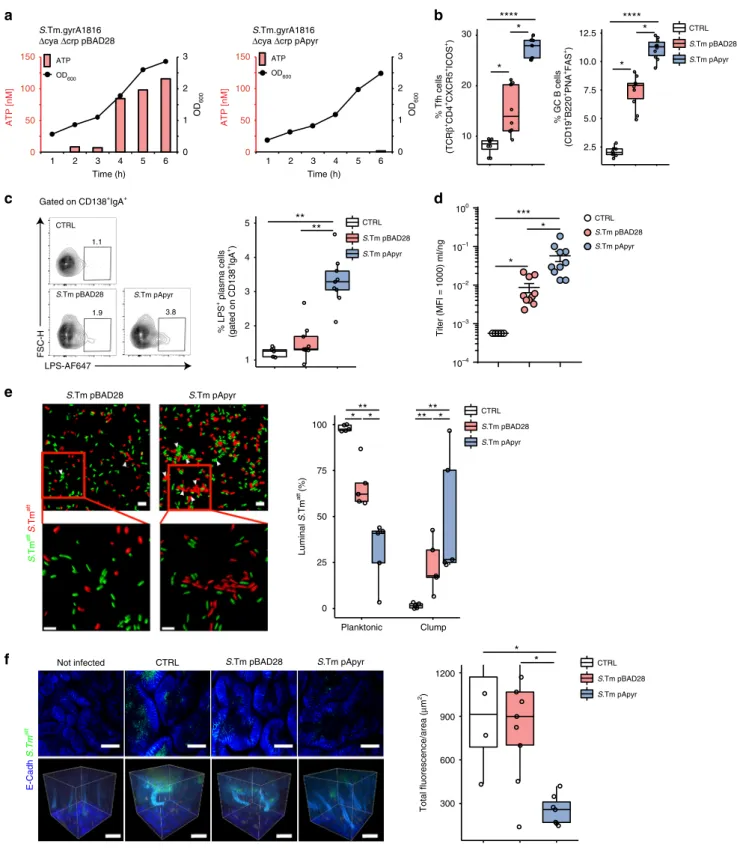
Enhancement of speci
fic SIgA by Salmonella vaccine with
apyrase. In the streptomycin mouse model of non-typhoidal
salmonellosis
17, oral infection with Salmonella enterica serovar
Typhimurium (S.Tm) leads to GALT colonization and systemic
dissemination of bacteria, as originally shown with S. enteriditis
18.
To address whether apyrase expression in live-attenuated S.Tm
could increase the specific SIgA response and confer enhanced
protection from infection by a virulent strain, we generated an
attenuated S.Tm strain (ATCC 53648) carrying either pBAD28
(S.Tm
pBAD28) or apyrase-bearing pHND10 (S.Tm
pApyr)
(Sup-plementary Table 1). As observed with E. coli
pApyr, ATP was
undetectable in culture medium of apyrase-expressing S.Tm
pApyr(Fig.
4a). Notably, Tfh and GC B cells as well as plasma cells
secreting IgA specific for Salmonella LPS were all significantly
increased in mice immunized with S.Tm
pApyr(Fig.
4b, c and
Supplementary Figure 5b-d), as was the concentration of
anti-Salmonella IgA in intestinal wash (Fig.
4d).
Effective protection from
Salmonella infection by S.Tm
pApyr.
SIgA protects the host from invasion by S.Tm or other
enter-opathogens by limiting the interaction of bacteria with the gut
epithelium
19,20. In the non-typhoidal salmonellosis model, both
enchained growth and classical agglutination, requiring
high-affinity IgA to cross-link dividing and colliding bacteria, are the
main protective effects
3. As only non-clumped bacteria can
a
b
d
c
60 100 140 0.4 1.2 2 60 100 140 1 2 3 4 5 0.4 1.2 2 1 2 3 4 5 ATP OD600 Time (h) Time (h) E. cloacae E. coliAc. species S. lentus
ATP [nM] ATP [nM] OD 600 OD 600
e
400 800 0 0 1.0 2.0 1 2 3 4 5 0 LB VAM ATP [ μ M] LB VAM OD 600 Time (h) 0 20 40 60 80SPF GF Bile UrineSerum
ATP [ μ M] 0 ATP [ μ M]
PortalJugularInf. cavalHeart 0.2 0.1 0.3
f
Portal vein 0.4 0.2 0.6**
ATP [ μ M] 0 25 50 75**
Ileum ATP [ μ M] 6 Sybr green DAPI DIBAC LB 64 6 67 VAM C57BL/6 Gated on CD3+CD4+CXCR5+ICOS+**
Annexin V + cells [%] Annexin V + cells [%] 0 10 20 30 40 50Annexin VCell count
PBS
VAM
PBS VAM
Annexin VCell count
PBS VAM P2rx7–/– 5.49 6.14 21.9 34.2 PBS VAM
g
Fig. 1 Bacterial origin of intestinal ATP. a ATP concentration in the lumen of ileum from SPF and GF mice, bile, urine, and serum from SPF mice. b ATP concentration in serum from portal, jugular, inferior caval veins, and heart.c ATP concentrations in culture medium (bars) and cell growth (OD600) of the
indicated bacterial species isolated from the small intestine of SPF mice.d Flow cytometry of ileal bacteria either maintained in culture medium (LB) or treated with VAM, for membrane damage (DIBAC+DAPI+cells, upper dot plots) and cell death (SybrGren+DAPI+cells, lower dot plots).e ATP concentrations (upper panel) and ileal bacteria growth (lower panel) in untreated (LB) and VAM-treated cultures.f ATP concentration in ileum and portal vein of SPF mice at 3 h after orogastric gavage with PBS or VAM.g Representative histograms and statistical analysis of Annexin V+cells within Tfh cells from PPs of WT (C57BL/6) and P2rx7−/−mice at 3 h after gavage with PBS or VAM. The boxplots show median and upper and lower quartiles. The extreme lines show the highest and lowest value. The boxplot is overlaid with the visualization of single observations. Two-tailed Mann–Whitney U-tests. **p < 0.01. One representative experiment out of at least three is shown
approach the intestinal epithelium and invade into host tissues,
this has the effect of hugely reducing the infectious burden in the
intestine. We
first addressed whether the enhanced IgA responses
observed after vaccination with S.Tm
pApyrcorresponded with
enhanced aggregation of Salmonella in the gut lumen. Vaccinated
mice were therefore orally infected with 1:1 mixture of
GFP-tagged and mCherry-GFP-tagged attenuated S.Tm (S.Tm
att, used to
avoid confounding inflammation in the control animals)
21and
cecal content was analysed at 5 h post infection by confocal
microscopy. In mice immunized with S.Tm
pApyr, we observed a
significant decrease in planktonic S.Tm
attas compared to mice
immunized with S.Tm
pBAD28(Fig.
4e), and fewer S.
Typhimur-ium swimming in the cecal crypts (Fig.
4f).
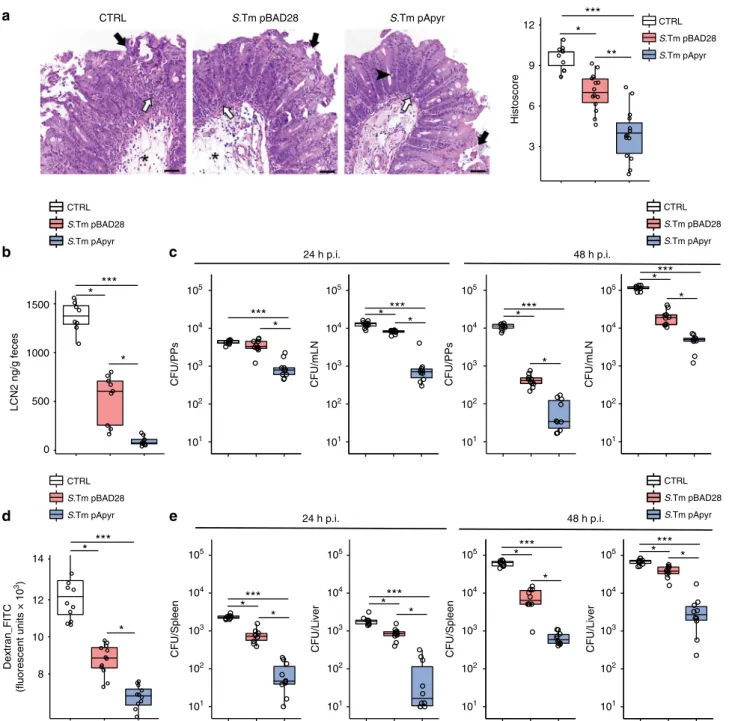
Correspondingly, when challenge infections were carried out
with fully virulent S. Typhimurium (S.Tm
WT) in S.Tm
pApyrvaccinated mice, disease parameters, including histopathological
score, fecal Lipocalin 2 (LCN2) and GALT infection, were all
significantly decreased as compared to controls or S.Tm
pBAD28-vaccinated mice (Fig.
5a–c). Salmonella colonizing systemic
compartments (e.g. spleen and liver) follows a
GALT-independent route of infection (presumably via blood
circula-tion)
22.
Accordingly,
infection
with
S.Tm
WTdetermines
increased permeability of the gut-vascular barrier that is reflected
by translocation of FITC-dextran from the intestinal lumen into
the bloodstream and liver
23. Vaccinated mice were significantly
more resistant to blood absorption of FITC-dextran administered
via orogastric route with respect to non-vaccinated animals and
immunization with S.Tm
pApyrconferred enhanced protection
(Fig.
5d). Moreover, S.Tm
WTCFUs were significantly reduced in
the liver and spleen of these mice (Fig.
5e). These results indicate
that immunization with apyrase-expressing bacteria confers
improved protection from S.Tm systemic spreading.
Protection by
S.Tm
pApyrdepends on T-cell-dependent SIgA.
To control for effects of immunization that occur independently
of adaptive immunity, we immunized recombinase-1 deficient
(Rag-1
−/−) mice with S.Tm
pApyror S.Tm
pBAD28. In Rag-1
−/−mice there was no difference in susceptibility to Salmonella
infection between non-vaccinated or either vaccinated mouse
group (Supplementary Figure 6a–e). To directly address the role
of SIgA in conferring enhanced protection by vaccination with S.
Tm
pApyr, we performed the same immunization-challenge
pro-tocol in mice with deletion of the J
Hgene. These Igh
−/−mice
cannot produce recombined variable regions of Ig heavy chains
and have no detectable Ig. Analogously to Rag-1
−/−mice, both
non-immunized Igh
−/−mice and Igh
−/−mice vaccinated with
either S.Tm transformants were equally susceptible to Salmonella
infection (Supplementary Figure 6f-j), supporting a crucial role
for SIgA in controlling the local infection and systemic spreading
of the pathogen.
We carried out experiments to mechanistically link the
abrogation of ATP to the loss of signaling via P2X7 on Tfh cells.
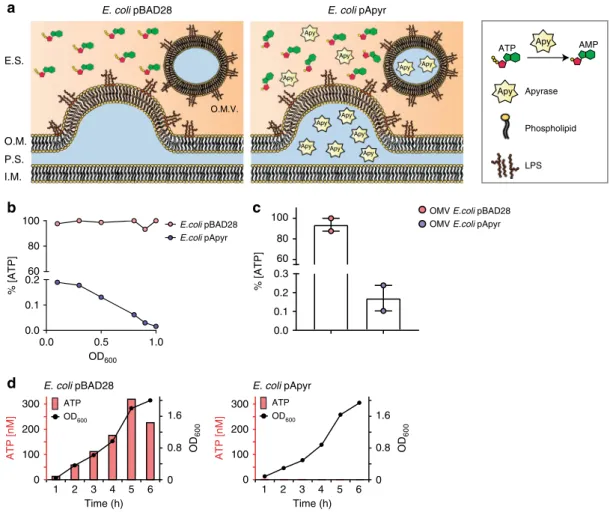
a
ATP Apy AMP
Apy Apyrase Phospholipid LPS E.S. O.M. P.S. I.M.
E. coli pBAD28 E. coli pApyr
O.M.V.
d
OD 600 Time (h) 0 0.8 1.6 OD 600 0 0.8 1.6 0 100 200 300 1 2 3 4 5 6 Time (h) 1 2 3 4 5 6 ATP [nM] ATP OD600 ATP OD600 E. coli pBAD28 0 100 200 300 ATP [nM] E. coli pApyr 0.0 0.5 1.0 0.0 0.1 0.260 80 100 % [ATP] OD600b
c
0.0 0.1 0.2 0.3 60 80 100 % [ATP]OMV E.coli pBAD28 OMV E.coli pApyr
E.coli pBAD28 E.coli pApyr Apy Apy Apy Apy Apy Apy Apy Apy Apy Apy Apy
Fig. 2 Apyrase release by E. coli. a Schematic model of apyrase release by E. coli (E.S., extracellular space; O.M., outer membrane; P.S., periplasmic space; I. M., inner membrane; O.M.V., outer membrane vesicle).b Apyrase activity in culture supernatants of the indicated E. coli transformants at different OD600
expressed as percentage of non-degraded ATP.c Apyrase activity in OMVs isolated from E. colipBAD28and E. colipApyr.d ATP concentrations in culture
medium (bars) and bacterial growth (OD600) over time for E. colipBAD28(left panel) or E. colipApyr(right panel). L-arabinose was added at time 0. One
We therefore immunized P2rx7
−/−mice with S.Tm
pBAD28or S.
Tm
pApyr. Whereas S.Tm
pApyr-induced enhanced IgA responses
in WT littermates, P2rx7
−/−mice generated analogous amounts
of S.Tm-specific SIgA after immunization with live-attenuated S.
Tm
pBAD28or S.Tm
pApyr(Supplementary Figure 7a). Accordingly,
P2rx7
−/−mice were equally protected from local and systemic
infection with virulent S.Tm irrespective of the immunization
strain (Supplementary Figure 7b–d).
Improved response to inactivated oral vaccines by apyrase. We
tested the ability of apyrase to enhance the induction of IgA by
inactivated oral vaccines
3,24(Supplementary Figure 8a). We
generated these vaccines by treating pure-cultured bacteria with
1% peracetic acid (PA)—a strong oxidizing agent. Notably, no
increase of extracellular ATP was detected in the intestine of GF
mice upon oral administration of inactivated bacteria
(Supple-mentary Figure 8b). The oxidative treatment also abolished the
function of the apyrase enzyme, resulting in identical IgA priming
to a vaccine constructed from the empty-vector-carrying strain
(Fig.
6a). Correspondingly, similar protection from infection with
virulent S.Tm was observed with both vaccines (Fig.
6b, c). We
therefore administered inactivated S. Typhimurium with or
without crudely-purified apyrase extracted from E. coli that
sig-nificantly decreases eATP in the small intestine (Supplementary
Figure 8c). Inclusion of apyrase in the vaccine preparation greatly
improved the IgA titer induced, similarly to that induced by
infection with the live-attenuated apyrase-expressing strain
(Figs.
4d,
6d), and generated enhanced protection from challenge
with virulent S.Tm (Fig.
6e, f). It was previously observed that the
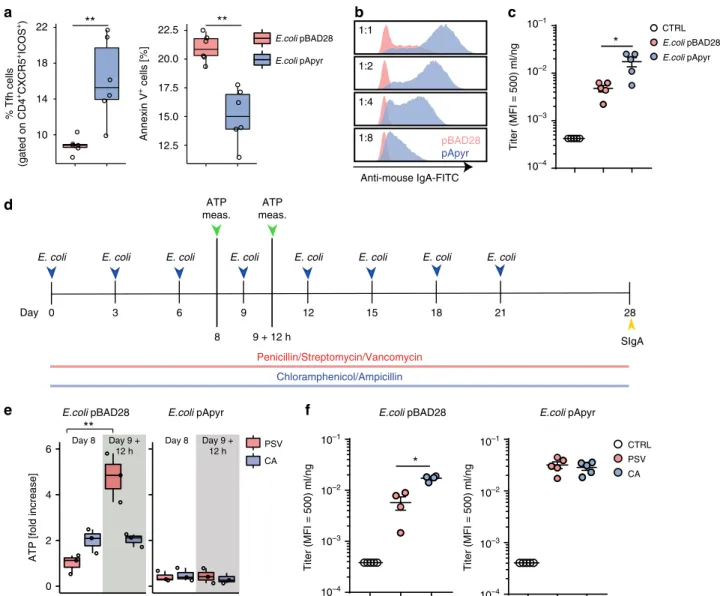
a
b
1:1 1:2 1:4 1:8 pBAD28 pApyr Anti-mouse IgA-FITC Titer (MFI = 500) ml/ng 10–1 10–2 10–3 10–4 10–1 10–2 10–3 10–4 10–1 10–2 10–3 10–4*
E.coli pBAD28 E.coli pApyr CTRL Annexin V + cells [%] 17.5 20.0 12.5 15.0 22.5**
% Tfh cells (gated on CD4 +CXCR5 +ICOS +) 14 18 10 22**
E.coli pBAD28 E.coli pApyrc
e
d
Chloramphenicol/Ampicillin Penicillin/Streptomycin/Vancomycin SIgA DayE. coli E. coli E. coli E. coli E. coli E. coli E. coli E. coli
9 + 12 h 8 0 3 6 9 12 15 18 21 28 ATP meas. ATP meas. Titer (MFI = 500) ml/ng
*
Titer (MFI = 500) ml/ng PSV CA CTRLE.coli pBAD28 E.coli pApyr
PSV CA
**
0 2 4 6ATP [fold increase]
E.coli pBAD28 E.coli pApyr
Day 8 Day 9 + 12 h Day 9 + 12 h Day 8
f
Fig. 3 Induction of anti-E. coli SIgA by expression of apyrase. a Statistical analysis byflow cytometry of Tfh cells and Annexin V+cells within Tfh cells from PPs of mice immunized with E.colipBAD28or E.colipApyrat day 22.b Flow cytometry for anti-E. coli IgA in intestinal wash from mice immunized with E.
colipBAD28or E. colipApyr.c Intestinal anti-E.coli IgA titer in non-immunized mice (CTRL) and mice immunized with E. colipBAD28or E. colipApyr.d Diagram
showing the immunization protocol with E.colipBAD28and E.colipApyrin mice maintained with Chloramphenicol and Ampicillin (CA) (a bactericidal mix
active on endogenousflora but not on CA-resistant E. colipBAD28and E. colipApyr) or Penicillin/Streptomycin/Vancomycin (PSV) (bactericidal on both
endogenousflora as well as E. coli transformants) in drinking water. e Fold increase of ileal ATP in mice maintained in PSV or CA before (day 8) and 12 h after (day 9+ 12 h) orogastric gavage with the indicated transformants. f Intestinal anti-E.coli IgA titer in untreated mice (CTRL) or in response to E. colipBAD28(left panel) or E. colipApyr(right panel) gavaging in mice maintained in PSV or CA. The boxplots ina and e show median and upper and lower
quartiles. The extreme lines show the highest and lowest value . The boxplot is overlaid with the visualization of single observations. Two-tailed Mann–Whitney U-tests. **p < 0.01 a and Kruskal–Wallis with Dunn’s post-test. *p < 0.05, **p < 0.01 c, e, f. One representative experiment out of at least two is shown
b
d
Luminal S .Tm att (%) Planktonic 100 75 50 25 0 Clump ** * * ***** CTRL S.Tm pBAD28 S.Tm pApyr CTRL S.Tm pBAD28 S.Tm pApyr CTRL S.Tm pBAD28 S.Tm pApyr CTRL S.Tm pBAD28 S.Tm pApyr Total fluorescence/area ( μ m 2) 1200 900 600 300 * *f
E-Cadh S.Tm attNot infected CTRL S.Tm pBAD28 S.Tm pApyr
e
S. Tm att S. Tm att S.Tm pBAD28 S.Tm pApyrc
3 4 1 2 5 ** ** % LPS + plasma cells (gated on CD138 +IgA +) Gated on CD138+IgA+ LPS-AF647 FSC-H 1.1 CTRL 1.9 S.Tm pBAD28 3.8 S.Tm pApyr CTRL S.Tm pBAD28 S.Tm pApyr Titer (MFI = 1000) ml/ng * *** * 10–1 10–2 100 10–3 10–4a
100 150 S.Tm.gyrA1816Δcya Δcrp pBAD28 S.Tm.gyrA1816Δcya Δcrp pApyr
1 2 3 4 5 6 0 1 2 3 ATP [nM] ATP 0 50 100 150 ATP [nM] 0 50 OD 600 0 1 2 3 OD 600 Time (h) 1 2 3 4 5 6 OD600 ATP OD600 30 12.5 10.0 7.5 5.0 2.5 20 10 Time (h) % GC B cells (CD19 +B220 +PNA +FAS +) **** * * * * **** % Tfh cells (TCR β +CD4 +CXCR5 +ICOS +)
Fig. 4 Enhanced anti-Salmonella SIgA by apyrase. a ATP concentrations in culture medium (bars) and bacterial growth (OD600) over time for S.TmpBAD28
and S.TmpApyr.b Quantification of Tfh and GC B cells and c representative contour plots with statistical analysis of plasma cells specific for S.Tm LPS in PPs
48 h after orogastric infection with S.TmWTin non-immunized mice (CTRL) and mice immunized with S.TmpBAD28or S.TmpApyr.d Intestinal anti-S.Tm IgA
titer in non-immunized mice (CTRL) and mice immunized with S.TmpBAD28or S.TmpApyr.e Representative 2D (upper panels, scale bar: 5µm) and 3D
(lower panels, scale bar: 5µm) images, and statistical analysis of bacterial clumping in live cecal content from mice vaccinated with S.TmpBAD28or S.
TmpApyr, 8 h after orogastric administration of a 1:1-mix of mCherry- and GFP-tagged S.Tmatt(107CFU). CTRL, non-vaccinated mice.f Images from
two-photon confocal microscopy of caeca and 3D rendering of crypts from E-cadherin-mCFP mice 18 h after infection with 107CFU of GFP-tagged S.Tmatt.
Infected mice were either non-vaccinated (CTRL) or vaccinated with the indicated S.Tm transformant. Graph shows the statistics of totalfluorescence inside the crypts per unit of internal area. The boxplots show median and upper and lower quartiles. The extreme lines show the highest and lowest value . The boxplot is overlaid with the visualization of single observations. Kruskal–Wallis with Dunn’s post-test. *p < 0.05, **p < 0.01, ***p < 0.001, ****p < 0.0001. One representative experiment out of at least three is shown
effectiveness of inactivated vaccines was dependent on the extent
of colonization
24. These results suggest that a dominant
inhibi-tory effect of the microbiota is eATP production, as antibody
titers induced by the inactivated vaccine in GF mice are similar to
those induced by the inactivated vaccine plus apyrase in colonized
animals (Fig.
6d, g). This secretory response correlates with
effective protection from subsequent infection (Fig.
6e, f, h).
Therefore, inclusion of recombinant apyrase into inactivated oral
vaccines greatly improves the responsiveness to these
prepara-tions without any major side-effects.
Discussion
The purinergic signaling system, which uses ATP and related
nucleotides as signaling molecules, plays pleiotropic roles in
regulating physiological and pathological responses in virtually all
mammalian
tissues
25,26.
This
intercellular
communication
a
b
d
e
24 h p.i. 48 h p.i.c
24 h p.i. 48 h p.i. S.Tm pBAD28 S.Tm pApyr CTRL CTRL S.Tm pBAD28 S.Tm pApyr CTRL S.Tm pBAD28 S.Tm pApyr CTRL S.Tm pBAD28 S.Tm pApyr CTRL S.Tm pBAD28 S.Tm pApyr CTRL S.Tm pBAD28 S.Tm pApyr Histoscore***
**
12 9 6 3*
1500 1000 500 0 LCN2 ng/g feces***
*
*
14 12 10 8 Dextran_FITC (fluorescent units × 10 3)*
***
*
***
*
***
*
*
*
***
*
*
***
*
*
***
*
CFU/PPs 105 104 103 102 101 CFU/PPs 105 104 103 102 101 105 104 103 102 101 CFU/mLN 105 104 103 102 101 105 104 103 102 101 105 104 103 102 101 105 104 103 102 101 105 104 103 102 101 CFU/mLN*
***
*
CFU/Spleen*
***
*
CFU/Liver*
***
*
CFU/Spleen CFU/LiverFig. 5 Enhanced protection from Salmonella infection by vaccination with S.TmpApyr. Wild-type mice were gavaged with PBS (CTRL) or vaccinated with S.
TmpBAD28and S.TmpApyr. Streptomycin (Sm) pretreated mice were infected with S.TmWTand analysed 24 h and 48 h later.a Representative H&E sections
of the cecum at 24 h post infection and statistical analysis of histopathological scores. Star: submucosal edema; white arrow: neutrophils aggregates; black arrow: epithelial defects; arrowhead: goblet cells. Scale bar: 50μm. b Fecal Lipocalin 2 (LCN2) quantification 24 h post infection with S.TmWT.c Pathogen
loads (CFU) in PPs and mesenteric lymph nodes (mLN) 24 h (left panels) and 48 h (right panels) after infection.d Intestinal permeability to FITC-dextran 24 h after infection with S.TmWTin mice gavaged with PBS or vaccinated with S.TmpBAD28or S.TmpApyr. Serum levels of 70-kDa FITC-dextran were
assessed 4 h after gavage.e Pathogen loads (CFU) in spleen and liver 24 h (left panels) and 48 h (right panels) after infection. The boxplots show median and upper and lower quartiles. The extreme lines show the highest and lowest value . The boxplot is overlaid with the visualization of single observations. Kruskal–Wallis with Dunn’s post-test. *p < 0.05, **p < 0.01, ***p < 0.001. One representative experiment out of three is shown
a
*
**
10–1 106 104 102 0 106 104 102 0 106 104 102 0 106 104 102 0 106 104 102 0 106 106 104 104 102 102 0 0 10–2 100 10–4 10–3 10–2 10–1 10–4 Titer (MFI = 500) ml/ng 10–3 10–1 10–2 10–4 10–3 SPF CTRL SPF PA−S.Tm pBAD28 SPF PA−S.Tm pApyrb
24 h p.i.c
SPF CTRL SPF PA−S.Tm pBAD28 SPF PA−S.Tm pApyr
Histoscore 10.0 7.5 5.0 2.5 0.0
***
**
SPF CTRL SPF PA−S.Tm pBAD28 SPF PA−S.Tm pApyrd
Titer (MFI = 1000) ml/ng*
*
***
PA-S.Tm pBAD28 + mock extract PA-S.Tm pBAD28 + APY extract
CTRL CTRL
PA-S.Tm pBAD28 + mock extract PA-S.Tm pBAD28 + APY extract
Histoscore 10 8 6 4 2
**
**
e
f
g
Titer (MFI = 1000) ml/ng*
*
GF CTRL GF PA−S.Tm pBAD28 GF PA−S.Tm pApyrh
GF CTRL GF PA−S.Tm pBAD28 GF PA−S.Tm pApyr CFU/mLN*
*
*
CFU/Liver*
*
*
CFU/Spleen 24 h p.i.*
*
CFU/mLN**
**
**
**
CFU/Liver 106 104 102 0 106 104 102 0 CFU/Spleen 24 h p.i. CFUSpleen*
***
CFU/mLN***
*
*
***
**
*
CFU/Liver SPF CTRL SPF PA−S.Tm pBAD28 SPF PA−S.Tm pApyrFig. 6 Apyrase enhances the induction of IgA by inactivated oral vaccines. SPF and GF mice were untreated (CTRL) or immunized with PA-S.Tm transformants together with crudely-purified apyrase (APY extract) or mock extract (mock extract) where indicated, pretreated with streptomycin, infected with S.TmWT(108CFU i.g.) and analysed 24 h later.a Intestinal lavage IgA titer and b pathogen loads (CFU) in mLN, liver and spleen in SPF mice
either non-immunized (CTRL) or immunized with PA-S.TmpBAD28or PA-S.TmpApyr.c Representative H&E sections of the cecum from SPF mice at 24 h
post infection and statistical analysis of histopathological scores. Star: submucosal edema; white arrow: neutrophils aggregates; black arrow: epithelial defects; arrowhead: goblet cells. Scale bar: 50µm. d Intestinal anti-S.Tm IgA titer, e pathogen loads (CFU) in mLN, liver and spleen and f statistical analysis of histopathological scores in non-immunized mice (CTRL) and mice immunized with PA-S.TmpBAD28conditioned with the indicated extract.g Intestinal
lavage IgA titer andh pathogen loads (CFU) in mLN, liver and spleen in GF mice either non-immunized (CTRL) or immunized with PA-S.TmpBAD28or PA-S.
TmpApyr. The boxplots show median and upper and lower quartiles. The extreme lines show the highest and lowest value . The boxplot is overlaid with the
visualization of single observations. Kruskal–Wallis with Dunn’s post-test. *p < 0.05, **p < 0.01, ***p < 0.001. One representative experiment out of two is shown
modality emerged very early in evolution. In the endosymbiotic
relationship between
α-proteobacteria and the archeon, from
which the eukaryotic cell originated, ATP released by
mito-chondria (i.e.
α-proteobacteria) evolved also as a signaling
molecule to communicate mitochondrial
fitness
27. Bacteria
release ATP via mechanosensitive channels
28,29. Proteobacteria,
in particular, were shown to secrete elevated amounts of ATP that
were modulated by adherence to different surfaces
30. Indeed,
ATP release as well as ATP breakdown enzymatic systems
are present in all kingdoms of life
26(Supplementary Figure 2a).
The observation that ATP released by bacteria limits Tfh cells
abundance via P2X7 receptor and ensures controlled
T-dependent SIgA responses in the small intestine indicates eATP
can act as an inter-kingdom signalling molecule. This regulatory
pathway plays a crucial role in shaping a beneficial gut ecosystem
for host metabolism
6. On the other hand, it contributes to the
relative resistance of the intestinal adaptive immune system to
generating high-affinity SIgA upon oral immunization.
Over-coming this insensitivity has typically required the use of
live-attenuated oral vaccines, which encompass significant safety risks.
Transient subversion of bacterial ATP-mediated control of Tfh
cells by apyrase could be exploited to enhance T cell-dependent
IgA induction by inactivated oral vaccines or to limit the harmful
potential of live-attenuated oral vaccines by specifically enhancing
SIgA response and limiting intestinal inflammation, at the same
time eliciting more effective and protective SIgA against
enter-opathogens. Our experiments demonstrate that this strategy is
safe and generates potent protective immune responses.
Methods
Mice. Animal experiments were performed in accordance with the Swiss Federal Veterinary Office guidelines and authorized by the Cantonal Veterinary. C57BL/6J, P2rx7−/−(B6.129P2-P2rx7tm1Gab/J), Rag1−/−, Jh−/−, and E-cadherin-mCFP (B6.129P2(Cg)-Cdh1tm1Cle/J) mice were bred in the SPF facility at the Institute for Research in Biomedicine, Bellinzona, Switzerland. C57BL/6J GF mice were maintained inflexible film isolators at the Clean Animal Facility, University of Bern, Switzerland. Where indicated, mice were treated with an antibiotic associa-tion containing Metronidazole (2.5 mg), Ampicillin (2.5 mg), and Vancomycin (1.25 mg) (VAM) in 200μl per mouse by oral gavage. For analysis of epithelial turnover, mice were starved for 36 h with bedding chips and drinking water. After starvation, mice were re-fed for 24 h and then sacrificed for analysis. The re-feeding period was set to begin at 8:00 in all experiments. Where indicated, mice were pretreated for 15 day with VAM. In all experiments, up tofive mice were housed per cage in a 12-h light-12-h dark cycle.
Determination of the ileal volume. To calculate the ileal volume, the last 5 cm of the terminal ileum were excised from 8-week-old-female mice andfixed in neutral buffered formalin (16 h at 4 °C). Afterfixation samples were dehydrated (70% ethanol, two changes, 1 h each; 80% ethanol, one change, 1 h; 95% ethanol, one change, 1 h; 100% ethanol, three changes, 1.5 h each; xylene, three changes, 1.5 h each), embedded in paraffin and then cut at microtome to the desired thickness (6μm). Ten sections spanning the 5 cm were obtained and stained with hema-toxylin and eosin (H&E). The internal areas of sections were calculated by ImageJ and the mean value (base) multiplied for 5 cm (height)31(Supplementary Figure 9).
Quantification of ATP. For quantification of ileal ATP, intestinal content was collected by lavage with 10 ml of intestinal wash buffer (PBS, 0.5 M EDTA, Soybean trypsin inhibitor, PMSF), spun andfiltered (0.22 μm) to remove any bacteria-sized contaminants and immediately frozen in dry ice. ATP concentration in the intestinal washes was multiplied for the dilution factor to obtain the actual endoluminal ATP concentration (Supplementary Figure 9). Bile and urine were collected from gallbladder and bladder through puncture with a 34G needle. For quantification of ATP secreted by commensal bacteria in culture, intestinal content was plated on BHI agar and cultured for 16 h at 37 °C. Single colonies were picked and cultured in BHI broth or LB. To quantify the ATP production during bacterial growth, the bacterial culture supernatant was collected at different O.D., cen-trifuged andfiltered (0.22 μm). For quantification of ATP in serum, inferior caval, jugular and portal veins, and hearth were exposed and blood collected through puncture with a 34G needle. Emolysed sera were discharged. The extracellular ATP concentration was evaluated by bioluminescence assay with recombinantfirefly luciferase and its substrate D-luciferin according to the manufacturerʼs protocol (Life Technologies Europe B.V.).
OMVs isolation. OMVs were isolated from 250 ml of LB cultures32. E. colipBAD28
and E. colipApyrwere grown to late-exponential phase (OD600~0.8–1.0) and
removed from culture supernatants by centrifugation. The collected supernatants werefiltered (0.22 µm) and concentrated using the Vivaspin 20 concentrators, molecular weight cutoff 50-kDa (GE Healthcare), to eliminate free apyrase (~27 kDa) from the medium. The collected concentrates were then centrifuged at 270,000×g for 3 h at 4 °C to yield crude OMVs preparations that were resuspended in PBS and tested for apyrase activity.
Apyrase activity test. To test the apyrase activity in bacterial supernatants, OMVs and intestinal washes, samples were incubated with 50 µM ATP for 30 min at room temperature. ATP concentration was evaluated by a bioluminescence assay with recombinantfirefly luciferase and its substrate D-luciferin according to the man-ufacturer’s protocol (Life Technologies Europe B.V.). The ATPase activity of the samples was expressed as the percentage of non-degraded ATP.
Antibodies andflow cytometry. The following mAbs were purchased from BD Biosciences: biotin conjugated anti-CXCR5 (clone: 2G8, Cat.#: 551960, dilution 1:50), phycoerythrin (PE) conjugated anti-ICOS (clone: 7E.17G9, Cat.#: 552146, dilution 1:200), PE conjugated anti-CD138 (clone: 281-2, Cat #:553714, dilution 1:100) and PE conjugated anti-Fas (clone: Jo2, Cat.#: 554258, dilution 1:200). Allophycocyanin (APC) conjugated anti-B220 (clone: RA3-6B2, Cat.#: 103212, dilution 1:200), APC-Cy7 conjugated anti-CD19 (clone: 6D5, Cat.#: 115530, dilution 1:200), PE-Cy7 conjugated anti-CD4 (Clone: GK1.5, Cat.# 100422, dilu-tion 1:200), Alexa Fluor488 anti CD326 (Ep-CAM) (clone: G8.8, Cat.#: 118210, dilution 1:200) and APC conjugated streptavidin (Cat.#: 405207, dilution 1:200) were from Biolegend. Peridinin chlorophyll protein (Percp)-eFluor710 conjugated anti-CD3 (Clone: 17A2, Cat.#: 46-0032-80, dilution 1:200), PE conjugated Ki-67 (clone: SolA15, Cat.#: 12-5698-82, dilution 1:200) and APC-eFluor780 anti-CD45.2 (clone: 104, Cat.#: 47-0454-82, dilution 1:200) were obtained from eBioscience. Fluorescein labelled Peanut Agglutinin (PNA) (Cat.#: FL-10-71, dilution 1:500) was purchased from Vectorlabs. Fluorescein Isothiocyanate (FITC) conjugated anti-IgA (Cat.#: 1040-02, dilution 1:500) was obtained from Southern Biotech. To quantify IgA plasma cells specific for S.Tm, we labeled S.Tm LPS (Sigma-Aldrich) with Hydrazide-Biotin reagent (Pierce Biotechnology) according to the manufacturer’s instructions. Cells were stained with 30 μg ml−1biotinylated
LPS, FITC-anti-IgA, PE-anti-CD138 antibodies at 4 °C for 45 min and then with Alexa Fluor 647 labeled streptavidin33. Annexin V staining was performed in
Biolegend Annexin V binding buffer (Cat.#: 422201) containing Annexin V APC (dilution 1:300) at a cell density of 1 × 10⁶cells ml−1. Samples were washed twice in
the same buffer, acquired on LSRFortessaflow cytometer (BD Biosciences) and data analysed using FlowJo software (TreeStar, Ashland, OR) or FACS Diva soft-ware (BD Biosciences).
Bacterial strains and growth conditions. Full length phoN2::HA fusion, encoding periplasmic ATP-diphosphohydrolase (apyrase) of Shigellaflexneri, was cloned into the polylinker site of plasmid pBAD28 (ATCC 8739387402), under the control of the PBADL-arabinose inducible promoter, generating plasmid pHND1012.
Bacteria transformed with pBAD28 or pHND10 were grown in LB medium sup-plemented with L-arabinose (0.03%) and ampicillin (100μg ml−1). For infection experiments, S.TmWT(SL1344 wild-type clone SB300) or the respective mutants
were cultured in LB containing the appropriate antibiotics for 12 h at 37 °C, diluted 1:20 and sub-cultured for 3 h in 0.3 M NaCl supplemented LB without antibiotics. The bacterial strains used in the study are listed in Supplementary Table 1.
Determination of specific antibody titers by flow cytometry. Specific antibody titers in mouse intestinal washes were measured byflow cytometry34. Intestinal
contents were collected by lavages with 5 ml of intestinal wash buffer (PBS, 0.5 M EDTA, Soybean trypsin inhibitor, PMSF), spun andfiltered (0.22 μm) to remove any bacteria-sized contaminants. Bacterial targets were resuspended at a density of 107bacteria ml-1. Intestinal washes were serially diluted and 25μl of each dilution
were incubated with 25μl of bacterial targets suspension at 4 °C for 1 h. After two washes, bacteria were incubated for 1 h with monoclonal FITC-anti-mouse IgA and then resuspended in 2% paraformaldehyde in PBS for acquisition on a FACSCanto using FSC and SSC parameters in logarithmic mode. ELISA was used to determine the total IgA concentration in an undiluted aliquot of the same intestinal wash sample used for analysis inflow cytometry. Median fluorescence intensities (MFI) were plotted against antibody concentrations for each sample and 4-parameter logistic curvesfitted using Prism (Graphpad, La Jolla, CA). Titers were calculated from these curves as the inverse of the antibody concentration giving an above-background signal. The concentration of total antibody titer required to achieve a given MFI (for example= 500) was calculated by re-arrangement of the fitted 4-parameter logistic equation for each samples. As this value is low where a strong antibody response is present, the inverse of this value was plotted. Thus titers are calculated as the inverse total antibody concentration required to achieve a given MFI. The y-axis value chosen as“above background” necessarily varies between experiments due to theflow cytometer settings, but is constant within any one analysis34.
Treatment of bacterial cultures with antibiotics. Ampicillin (2.5μg ml−1), vancomycin (1μg ml−1), metronidazole (1μg ml−1) were added to intestinal bac-terial culture when OD600reached 0.5 value. At different times after addition of
antibiotics, bacterial cultures were spun and supernatants collected in a sterile tube. ATP concentration was evaluated by bioluminescence assay infiltered supernatants (see above).
Production of peracetic acid killed vaccines. To produce PA killed vaccines, bacteria grown for 16 h to late stationary phase were collected by centrifugation and resuspended at a density of 109–1010ml−1in sterile PBS. Peracetic acid
(Sigma-Aldrich) was added to afinal concentration of 1% and after vigorous mixing, the suspension was incubated for 60 min at room temperature. After extensive washing, thefinal pellet was resuspended at a concentration of 1011
particles ml−1in sterile PBS24. Each batch of vaccine was tested before use in order
to confirm absence of live bacteria.
Preparation of periplasmic extract. E. colipBAD28and E. colipApyrwere grown as
described above and collected by centrifugation. After washing, bacteria were resuspended (1010CFU ml−1) in PBS with 30 mM Tris-HCl (pH 8.0), 4 mM
EDTA, 1 mM PMSF, 20% sucrose and 0.5 mg ml−1lysozyme and incubated 2 min at 30 °C. MgCl2(10 mMfinal) was added to the bacterial solution and incubation
was continued for 1 h at 30 °C. At the end of the incubation period bacterial suspensions were centrifuged at 11,000×g for 10 min at 4 °C and supernatants were stored (periplasmic extract).
Oral vaccination protocols. For vaccination with E. coli transformants, E. coli
p-BAD28and E. colipApyrwere collected by centrifugation, washed in sterile PBS and
1010CFUs administered to mice by orogastric gavage. The procedure was repeated
every 3 days for 3 weeks and mice were sacrificed at day 22 or 28 (Supplementary Figure 3b). For vaccination with S.Tm transformants, S.TmpBAD28and S.TmpApyr
were collected by centrifugation, washed in sterile PBS and 5 × 10⁹CFUs
admi-nistered to mice by orogastric gavage. The procedure was repeated every 3 days for three times (Supplementary Figure 5b). The pBAD promoter is constantly active in the gut lumen (E.S. and W.D.H., unpublished observations), however, to ensure optimal apyrase expression by administered S.Tm transformants, mice were maintained with 0.3% arabinose in drinking water. On day 28, mice were used for infection experiments. For oral vaccination with PA killed S.TmpBAD28and S.
TmpApyr, mice received 1010particles of the respective transformants in PBS every
3 days for three times. When periplasmic extracts from E. colipBAD28(mock
extract) or E. colipApyr(APY extract) were used, 100μl of the extract was orally
gavaged every 12 h starting three days before thefirst day of immunization until day 10. On day 28, mice were used for infection experiments (Supplementary Figure 8a).
Challenge infections withS. Typhimurium. Mice were pretreated with 1 g kg−1 streptomycin sulfate in sterile PBS by gavage. Twenty-four hours later, S.Tmwt(108
CFUs 0.1 ml−1PBS) were gavaged into the stomach. For determination of total bacterial loads, homogenates of PPs, mLN, spleen and liver collected at 24 and 48 h after infection, were plated on MacConkey agar plates containing 50μg ml−1 streptomycin.
Live confocal microscopy of cecal content. Vaccinated or control mice were pretreated with 0.8 g kg−1ampicillin sodium salt in sterile PBS by gavage. Twenty-four hours later, mice received 107CFUs of a 1:1 mix of mCherry-(pFPV25.1) and
GFP-(pM965) expressing avirulent S.Tm. For imaging, cecum content was gently diluted to 1:10 w/v in sterile PBS containing 6μg ml−1chloramphenicol, avoiding heavy mixing3. The suspension (200μl) was transferred to 35 mm dish, 14 mm
glass diameter, poly-D-lysine coated Petri dish (MatTek Corporation) and imaged using a Leica TCS SP5 confocal microscope with a ×100/1.44 NA oil immersion objective (HCX PL APO CD ×100/1.44 oil). Individual bacteria were visually scored as planktonic, whereas aggregates of equal or more than three bacteria were scored as clumps.
Multiphoton microscopy and analysis. Vaccinated or control E-cadherin-mCFP mice were pretreated with 0.8 g kg−1ampicillin sodium salt in sterile PBS by gavage. After 24 h, mice received 107CFUs of S.Tmattexpressing GFP
con-stitutively. After 18 h, the infected animals were sacrificed and the whole-ceca collected for 2-photon analysis. Deep tissue imaging was performed on a custo-mized two-photon platform (TrimScope, LaVision BioTec)35. The objective used
was a Nikon Apo LWD ×25/1.10W IR Corrected. Thefluorescence signal has been separated using a custom configuration of detecting PMTs equipped with a set of dichroic mirror and selective bandpassfilters for the Blue, Green, and Red channels (respectively detecting thefluorescence in the range of 450 nm–495 nm, 500 nm–550 nm, 600 nm–635 nm). 3D reconstructions of the whole crypts shown in Fig.4f and Supplementary Figure 10 were performed by acquiring a stack with z-step between slices of 3μm, for a total depth of 120 μm. Images were analysed using FIJI software36with a custom-developed macro to automate image processing: the
internal area of crypts was segmented by applying a threshold on the intensity of
the red autofluorescence (intensity above I = 1500 a.u.). Within the identified ROI (in the red channel) the green particles above the threshold (intensity above I= 5000 a.u. in the green channel) were detected and totalfluorescence was measured by summing the single particlesfluorescence intensity along the entire z-stack. The obtained total intensity was normalized by the total internal area of the crypts (obtained by summing up the single slice areas found in the red channel). 3D renderings shown in Fig.4f and Supplementary Figure 10 were made with Clear Volume plugin of FIJI software37.
Histological evaluation ofSalmonella-induced typhlitis. Ceca from all animals were examined at necropsy,fixed in 10% neutral buffered formalin for at least 48 h prior to embedding in paraffin and stained with H&E. Pathological scores were determined in a blinded manner using a scoring scheme, which takes into con-sideration the severity of submucosal edema (scores 0–3), neutrophilic infiltration into the lamina propria (scores 0–4), loss of goblet cells (scores 0–3), and epithelial damage (scores 0–3)17,38.
Phylogenetic tree of apyrases. Protein sequences were retrieved from GenBank by searching for the terms“apyrase” and “ectonucleoside triphosphate dipho-sphohydrolase”. Putative and partial sequences were excluded from the analysis. Protein sequences were aligned using MUSCLE39. The phylogenetic trees were
inferred by using FastTree240.
Statistical analysis. Where two groups of data were compared, analysis was carried out using two-tailed Mann–Whitney U-tests. Where more than two groups were compared, data were analyzed by Kruskal–Wallis test with Dunns post-test to account for multiple testing. Statistical tests were performed using GraphPad Prism 7.02 for Windows (http://www.graphpad.com).
Reporting Summary. Further information on experimental design is available in the Nature Research Reporting Summary linked to this Article.
Data availability
The authors declare that the main data supporting thefindings of this study are available within the Article and its Supplementary Informationfiles. A Reporting Summary for this Article is available as a Supplementary Informationfile. Extra data are available at10.5072/zenodo.254203.
Received: 6 February 2018 Accepted: 14 December 2018
References
1. Brandtzaeg, P. Induction of secretory immunity and memory at mucosal surfaces. Vaccine 25, 5467–5484 (2007).
2. Pasetti, M. F., Simon, J. K., Sztein, M. B. & Levine, M. M. Immunology of gut mucosal vaccines. Immunol. Rev. 239, 125–148 (2011).
3. Moor, K. et al. High-avidity IgA protects the intestine by enchaining growing bacteria. Nature 544, 498–502 (2017).
4. Galen, J. E. & Curtiss, R. 3rd The delicate balance in genetically engineering live vaccines. Vaccine 32, 4376–4385 (2014).
5. Proietti, M. et al. ATP-gated ionotropic P2X7 receptor controls follicular T helper cell numbers in Peyer's patches to promote host-microbiota mutualism. Immunity 41, 789–801 (2014).
6. Perruzza, L. et al. T follicular helper cells promote a beneficial gut ecosystem for host metabolic homeostasis by sensing microbiota-derived extracellular ATP. Cell Rep. 18, 2566–2575 (2017).
7. Okada, T. et al. Microbiota-derived lactate accelerates colon epithelial cell turnover in starvation-refed mice. Nat. Commun. 4, 1654 (2013). 8. Stecher, B. et al. Comparison of Salmonella enterica serovar Typhimurium
colitis in germfree mice and mice pretreated with streptomycin. Infect. Immun. 73, 3228–3241 (2005).
9. Atarashi, K. et al. ATP drives lamina propria T(H)17 cell differentiation. Nature 455, 808–812 (2008).
10. Iwase, T. et al. Isolation and identification of ATP-secreting bacteria from mice and humans. J. Clin. Microbiol. 48, 1949–1951 (2010).
11. Lecuyer, E. et al. Segmentedfilamentous bacterium uses secondary and tertiary lymphoid tissues to induce gut IgA and specific T helper 17 cell responses. Immunity 40(), 608–620 (2014).
12. Santapaola, D. et al. Apyrase, the product of the virulence plasmid-encoded phoN2 (apy) gene of Shigellaflexneri, is necessary for proper unipolar IcsA localization and for efficient intercellular spread. J. Bacteriol. 188, 1620–1627 (2006).
13. Scribano, D. et al. Polar localization of PhoN2, a periplasmic virulence-associated factor of Shigellaflexneri, is required for proper IcsA exposition at the old bacterial pole. PLoS ONE 9, e90230 (2014).
14. Hironaka, I. et al. Glucose triggers ATP secretion from bacteria in a growth-phase-dependent manner. Appl. Environ. Microbiol. 79, 2328–2335 (2013). 15. Mempin, R. et al. Release of extracellular ATP by bacteria during growth.
BMC Microbiol. 13, 301 (2013).
16. Slack, E., Balmer, M. L., Fritz, J. H. & Hapfelmeier, S. Functionalflexibility of intestinal IgA - broadening thefine line. Front. Immunol. 3, 100 (2012). 17. Barthel, M. et al. Pretreatment of mice with streptomycin provides a
Salmonella enterica serovar Typhimurium colitis model that allows analysis of both pathogen and host. Infect. Immun. 71, 2839–2858 (2003).
18. Carter, P. B. & Collins, F. M. The route of enteric infection in normal mice. J. Exp. Med. 139, 1189–1203 (1974).
19. Pabst, O. New concepts in the generation and functions of IgA. Nat. Rev. Immunol. 12, 821–832 (2012).
20. Slack, E., Balmer, M. L. & Macpherson, A. J. B cells as a critical node in the microbiota-host immune system network. Immunol. Rev. 260, 50–66 (2014). 21. Maier, L. et al. Microbiota-derived hydrogen fuels Salmonella typhimurium
invasion of the gut ecosystem. Cell Host Microbe 14, 641–651 (2013). 22. Lim, C. H. et al. Independent bottlenecks characterize colonization of systemic
compartments and gut lymphoid tissue by Salmonella. PLoS Pathog. 10, e1004270 (2014).
23. Spadoni, I. et al. A gut-vascular barrier controls the systemic dissemination of bacteria. Science 350, 830–834 (2015).
24. Moor, K. et al. Peracetic acid treatment generates potent inactivated oral vaccines from a broad range of culturable bacterial species. Front. Immunol. 7, 34 (2016).
25. Burnstock, G. Purine and pyrimidine receptors. Cell Mol. Life Sci. 64, 1471–1483 (2007).
26. Verkhratsky, A. & Burnstock, G. Biology of purinergic signalling: its ancient evolutionary roots, its omnipresence and its multiple functional significance. BioEssays 36, 697–705 (2014).
27. Chandel, N. S. Evolution of mitochondria as signaling organelles. Cell Metab. 22, 204–206 (2015).
28. Berrier, C., Coulombe, A., Szabo, I., Zoratti, M. & Ghazi, A. Gadolinium ion inhibits loss of metabolites induced by osmotic shock and large stretch-activated channels in bacteria. Eur. J. Biochem. 206, 559–565 (1992). 29. Booth, I. R., Edwards, M. D., Black, S., Schumann, U. & Miller, S.
Mechanosensitive channels in bacteria: signs of closure? Nat. Rev. Microbiol. 5, 431–440 (2007).
30. Ivanova, E. P., Alexeeva, Y. V., Pham, D. K., Wright, J. P. & Nicolau, D. V. ATP level variations in heterotrophic bacteria during attachment on hydrophilic and hydrophobic surfaces. Int. Microbiol. 9, 37–46 (2006). 31. Casteleyn, C., Rekecki, A., Van der Aa, A., Simoens, P. & Van den Broeck, W.
Surface area assessment of the murine intestinal tract as a prerequisite for oral dose translation from mouse to man. Lab. Anim. 44, 176–183 (2010). 32. Chutkan, H., Macdonald, I., Manning, A. & Kuehn, M. J. Quantitative and
qualitative preparations of bacterial outer membrane vesicles. Methods Mol. Biol. 966, 259–272 (2013).
33. Lindner, C. et al. Diversification of memory B cells drives the continuous adaptation of secretory antibodies to gut microbiota. Nat. Immunol. 16, 880–888 (2015).
34. Moor, K. et al. Analysis of bacterial-surface-specific antibodies in body fluids using bacterialflow cytometry. Nat. Protoc. 11, 1531–1553 (2016). 35. Chatziandreou, N. et al. Macrophage death following influenza vaccination
initiates the inflammatory response that promotes dendritic cell function in the draining lymph node. Cell Rep. 18, 2427–2440 (2017).
36. Schindelin, J. et al. Fiji: an open-source platform for biological-image analysis. Nat. Methods 9, 676–682 (2012).
37. Royer, L. A. et al. ClearVolume: open-source live 3D visualization for light-sheet microscopy. Nat. Methods 12, 480–481 (2015).
38. Stecher, B. et al. Flagella and chemotaxis are required for efficient induction of Salmonella enterica serovar Typhimurium colitis in streptomycin-pretreated mice. Infect. Immun. 72, 4138–4150 (2004).
39. Edgar, R. C. MUSCLE: multiple sequence alignment with high accuracy and high throughput. Nucleic Acids Res. 32, 1792–1797 (2004).
40. Price, M. N., Dehal, P. S. & Arkin, A. P. FastTree 2--approximately maximum-likelihood trees for large alignments. PLoS ONE 5, e9490 (2010).
Acknowledgements
We thank Michela Perotti, Tanja Rezzonico-Jost, and Sara Maffei (Institute for Research in Biomedicine, Bellinzona) for help with mice experiments. The work was supported by grant 310030_159491 (to F.G.) and 310030B_173338 (to W.D.H.) of the Swiss National Science Foundation (SNSF).
Author contributions
F.G., L.P. and M.P. designed experiments; L.P. and M.P. performed most experiments with contribution by F.S. and M.R.; D.S. and M.N. generated E. coli and Salmonella
transformants; G.P. performed histopathological analyses; R.D’A. and S.F.G. performed
two-photon microscopy; M.T. performed confocal microscopy; W.D.H. and E.S.
pro-videdfluorescent bacteria and experimental design for agglutination experiments and
immunization with peracetic acid-inactivated Salmonella. F.G. supervised the work. F.G. and E.S. wrote the manuscript.
Additional information
Supplementary Informationaccompanies this paper at
https://doi.org/10.1038/s41467-018-08156-z.
Competing interests:M.P. and F.G. are listed as inventors in a patent application that
covers the method described in this Article (WO2017108935A1). The remaining authors declare no competing interests.
Reprints and permissioninformation is available online athttp://npg.nature.com/
reprintsandpermissions/
Journal peer review information:Nature Communications thanks the anonymous
reviewers for their contribution to the peer review of this work. Peer reviewer reports are available.
Publisher’s note: Springer Nature remains neutral with regard to jurisdictional claims in
published maps and institutional affiliations.
Open Access This article is licensed under a Creative Commons
Attribution 4.0 International License, which permits use, sharing, adaptation, distribution and reproduction in any medium or format, as long as you give appropriate credit to the original author(s) and the source, provide a link to the Creative Commons license, and indicate if changes were made. The images or other third party material in this article are included in the article’s Creative Commons license, unless indicated otherwise in a credit line to the material. If material is not included in the
article’s Creative Commons license and your intended use is not permitted by statutory
regulation or exceeds the permitted use, you will need to obtain permission directly from
the copyright holder. To view a copy of this license, visithttp://creativecommons.org/
licenses/by/4.0/. © The Author(s) 2019