Measuring Physical Load in Soccer: Strengths and Limitations
of 3 Different Methods
Karin Fischer-Sonderegger, Wolfgang Taube, Martin Rumo, and Markus Tschopp
Purpose: To investigate the strengths and limitations of different indicators to measure physical load. Furthermore, indicators
were evaluated for discrimination between performance levels and playing positions.Methods: Ninety positional match files
from 70 elite players and 91 matchfiles from 69 subelite players were collected during 14 official under-18 matches using a local
position measurement system. Indicators are calculated from speed, absolute acceleration (acc-abs), or percentage acceleration
(acc-%). The acc-% describes the level of acceleration depending on the maximal voluntary acceleration (amax) for each initial
running speed. Effect sizes (ES) were used to determine discriminative ability. Results: The number of high accelerations
largely depended on the method (absolute threshold [>3 m·s−2and>4 m·s−2] 120 and 59 efforts; high percentage threshold [>75% amax]
84 efforts). Only a small number of highly accelerated efforts reached speeds considered high-speed running (>19.8 km·h−1:
32.6%). More high acc-% exists from initial running speed>2 m·s−1(23.0) compared with acc-abs (>3 m·s−214.4,>4 m·s−25.9).
Elite players achieve higher values in most performance indicators, with ES being highest for the number of high
acc-% (ES= 0.91) and high acc-abs (>3 m·s−2ES= 0.86, >4 m·s−2ES= 0.87), as well as for covered distance in jogging
(ES= 0.94). Conclusions: Estimated physical load, discriminative ability of physical indicators, and positional
require-ments largely depend on the applied method. A combination of speed-based and acc-% methods is recommended to get a comprehensive view.
Keywords: intensity, monitoring, motion analysis, local position measurement, physical indicator
The primary purpose for monitoring physical load in soccer is to provide information to practitioners to optimize physical
per-formance and to minimize the risk of injury.1–3 To estimate the
physical load, different performance indicators are used. Tradi-tional indicators usually encompass the distance a player covered in
different speed zones.4However, several studies have pointed out
that speed-based indicators do not reveal the complete picture of
physical load in soccer.5–11Due to the fact that efforts with high
accelerations requires a greater amount of energy and a higher
muscular demand than constant-speed efforts10; the physical load is
underestimated with speed-based methods. Therefore, a growing number of intermittent team sports research integrated tion-based indicators taking into account all efforts with
accelera-tions above a given absolute threshold (eg, >3.0 m·s−2).5,9,11–14
However, this approach does not consider the fact that the maxi-mum possible acceleration progressively decreases with increasing
initial running speeds.15 Therefore, using absolute acceleration
(acc-abs) thresholds underestimate the energetic and muscular loads when efforts start from an already relatively high initial
running speed (eg,>14.4 km·h−1). A recently introduced approach
tried to solve this problem.15The percentage acceleration (acc-%)
method classifies the intensity of the effort based on the ratio of the
actual measured acceleration of the specific effort and the
maxi-mum voluntary acceleration that is possible from this initial running speed. The maximum voluntary acceleration from differ-ent initial running speeds can be calculated from an isolated maximal sprint test. Compared with the acc-abs method, which
used generic (and often arbitrary) values across all players, either
individual or team-specific maximal values are used to calculate the
acc-% thresholds. Hence, the acc-% method offers a more precise estimation of the level of the acceleration and therefore of the physical load. However, so far, this method was only validated in experimental setups but was not tested during real soccer matches.
Therefore, thefirst aim of this study was to show the differences in
load estimation when measuring physical load during matches
using acc-abs9,12,13and acc-% methods,15as well as the traditional
speed-based approach.16,17
The second aim of the study was to evaluate the discriminative ability of different physical indicators derived from speed-based, acc-abs, and acc-% methods. Because of the complex nature of
soccer, measuring the influence of a single performance indicator to
the overall match performance is impossible. Instead, the strength of the discrimination ability of performance indicators between players of different performance levels or different playing posi-tions can be indirectly used to determine the relevance of an
indicator.18 To date, the importance of the different aspects of
physical performance for success in soccer has not been clearly
revealed yet.19–23 Furthermore, acceleration-based methods have
not been used—to our knowledge—when comparing players of
different performance levels. Therefore, the discriminative ability of different speed- and acceleration-based indicators was deter-mined by comparing under-18 (U18) youth soccer players of 2
different performance levels and differentfield positions.
Methods
Participants
Seventy elite junior players at the highest U18 level (mean [SD]): age, 17.0 (0.6) years; height, 178.1 (6.3) cm; body mass, 70.9
Fischer-Sonderegger, Rumo, and Tschopp are with the Swiss Federal Inst of Sport Magglingen, Magglingen, Switzerland. Fischer-Sonderegger and Taube are with Movement and Sport Science, Dept of Neurosciences and Movement Sciences, University of Fribourg, Fribourg, Switzerland. Fischer-Sonderegger (karin. fi[email protected]) is corresponding author.
http://doc.rero.ch
Published in "International Journal of Sports Physiology and Performance 14(5): 627–634, 2019"
which should be cited to refer to this work.
(7.6) kg; training volume, and 9.6 (2.0) hours per week and 69 sub-elite junior players of the second-highest U18 level: age, 17.9 (0.9) years; height, 176.4 (5.2) cm; body mass, 70.1 (6.5) kg; training volume, and 4.5 (1.2) hours per week participated in the study.
Ninety matchfiles from elite junior players (20 participants with 2
matchfiles and 50 participants with 1 match file) and 91 match files
from sub-elite junior players (22 participants with 2 matchfiles and
47 participants with 1 matchfile) were collected.
Only matchfiles from players who completed the entire match
were included in the study. For comparisons between the playing
positions, only matchfiles from elite field players were included.
They were analyzed and categorized according to Di Salvo et al21
into the following positions: central defenders (CD; n= 15, 22
matchfiles), wide defenders (WD; n = 18, 24 match files), central
midfielders (CM; n = 17, 21 match files), wide midfielders (WM;
n= 7, 8 match files), and attackers (A; n = 13, 15 match files). The
players were free from injury and illness. The study protocol was in accordance with the Declaration of Helsinki and was approved by the institutional review board of the Swiss Federal Institute of Sport Magglingen.
Championship Matches
Fourteen official championship matches of the highest (n = 7)
and second-highest (n= 7) national U18 championship level in
Switzerland were analyzed using positional data. Fourteen differ-ent teams participated in the study. For the purpose of this study, all
matches were played on the same pitch on artificial turf with the
same measurement system. The weather was dry and windless, with temperatures of approximately 20°C. Before the matches, players completed a 25-minute warm-up and 4 maximal sprints to evaluate maximal acceleration from different initial running speeds (see below).
Measurement System
Positional data were measured using a local position measurement (LPM) system (inmotiotec GmbH, Regau, Austria). The LPM system records data with a sampling frequency of 1000 Hz divided by the number of players. Therefore, the temporal resolution was approximately 45 Hz. The LPM accuracy depends on the type of movement (eg, linear or multidirectional) and on the type of
indicator (eg, average or peak values).24The coefficient of variation
in mean speed is between 1.4% and 3.9%25 and the averaged
absolute bias for peak speed 0.03 (0.72) km·h−1 and for peak
acceleration 0.48 (1.27) m·s−2.24
Measurement Methods
Three different methods were used to estimate physical load. The speed-based method determined the distance covered in different speed zones. In this study, the following 6 speed zones
were used, according to Rampinini et al16 and Bradley et al17:
standing, 0.0 to 0.7 km·h−1; walking,>0.7 to 7.2 km·h−1; jogging,
>7.2 to 14.4 km·h−1; running,>14.4 to 19.8 km·h−1; high-speed
running,>19.8 to 25.2 km·h−1; and sprinting, >25.2 km·h−1.
The acc-abs method classified the intensity of the effort based
on the maximum acc-abs reached. The indicators show the number of efforts with accelerations above a certain absolute threshold.
Acceleration thresholds and the terminology of the classifications
were chosen according to previous publications11,14: low
accelera-tion (>1–2 m·s−2), moderate acceleration (>2–3 m·s−2), and high
acceleration (>3 m·s−2) (acc-3). Bradley et al13 described efforts
with accelerations >4 m·s−2 as efforts with high accelerations
(acc-4); therefore, a second threshold for high acceleration was also considered.
The acc-% method15classified the intensity of an effort based
on the ratio of the actual measured acceleration of this specific
effort and the maximum voluntary acceleration (amax) that was
possible from this initial running speed (vinit). To determine the vinit
of an effort in as complex a situation as a soccer match, we
implemented the method of Sonderegger et al15 and defined vinit
as the speed when an effort starts, meaning when the acceleration turns positive. The actual measured acceleration considered the entire locomotor action, and the maximal acceleration value of this
specific action (amax,action) was extracted. By contrast, the amaxwas
determined in a sprint test conducted prior to the matches. The
sprint test includes 4 maximal sprints over 50 m.15Thefirst sprint
was performed from a standing start, whereas subsequent sprints were performed out of 1 of 3 constant initial running speeds (6.0,
10.8, and 15 km·h−1). Recovery time between each sprint was
3 minutes. Knowing the vinitand the corresponding amaxof the 4
sprints allowed determination of a group-specific regression
equa-tion. Thus, amaxcan be identified for any vinit and therefore the
percentage of amaxcan be calculated for each single effort in soccer
matches. The resulting acc-% indicators show the number of efforts with accelerations higher than a certain percentage threshold.
Thresholds were set as follows: very low (<25% amax), low
(<50% amax), moderate (<75% amax), and high (≥75% amax).
Indicators extracted with the acc-abs and the acc-% methods are further separated, depending on the vinit, into efforts initiated
from running speeds 0−1, >1−2, >2−3, >3−4, and >4 m·s−1. This
approach—based on Varley and Aughey26—shows differences in
number of efforts with high accelerations initiated within the different speed bands dependent on the used method.
To categorize efforts according to the level of acceleration, each single efforts must be recognized. The method used to detect
the efforts and thefiltering technique adopted can strongly
influ-ence the number of recognized efforts.27In this study, the
high-frequency part of the acceleration signal (=noise) was removed
using a Butterworth low-pass filter (order 5) with a frequency
cutoff of 0.02. The start of an effort was defined when acceleration
turned from negative (deceleration) to positive, and the end of an effort was set when the maximum speed was reached (ie, when the acceleration became 0). Subsequently, further efforts were consid-ered as irrelevant and removed if the maximal speed did not exceed
1.2 m·s−1or the total speed increase of the effort (vmax− vinit) was
smaller than 0.9 m·s−1. These thresholds helped to ensure that only
meaningful efforts were integrated into the data analysis (following
the advice of Varley et al27). Due to large variation of a single-peak
acceleration using the LPM system, Stevens et al24propose to use
the number of actions above a certain threshold (eg,>4 m·s−2)
during longer periods of play instead of the exact absolute value of peak acceleration. Thresholds are used in both the acc-abs and the acc-% methods.
Statistical Analysis
All data were reported as means (90% confidence interval). The
ability of an indicator to discriminate between elite and sub-elite
players was quantified using pooled Cohen’s effect sizes (ES) (90%
confidence interval).28In addition, differences between junior elite
and sub-elite players were analyzed using an independent t test. To detect positional differences, elite junior players were separated according to their position. The ability of an indicator to
discriminate between positions was also quantified using pooled
Cohen’s ES (90% confidence interval).28Furthermore, differences
between playing positions were analyzed using a 1-way analysis of
variance and Tukey’s post hoc tests. The absolute ES of <0.2, <0.6,
<1.2, <2.0, and <4.0 were used to represent trivial, small, moderate, large, and very large differences, respectively, between elite and
sub-elite players.29 Statistical significance was set at P < .05.
Statistical analyses were performed using SPSS (version 22.0 for Windows; SPSS Inc, Chicago, IL).
Results
Comparison of the 3 Methods
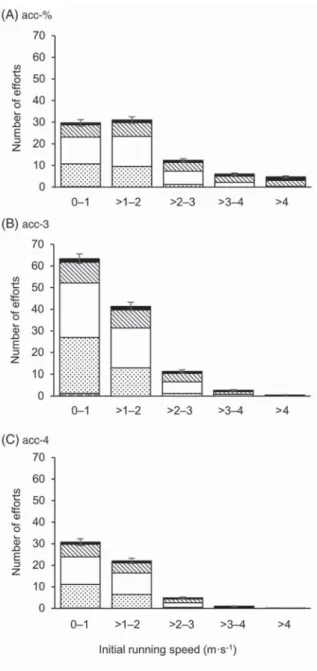
The total number of high accelerations depended on the selected
method (Figure1). With the acc-% method (accelerations≥ 75%
amax), 83.7 (80.1; 87.3) highly accelerated efforts per player were
detected, whereas with acc-3, 119.2 (115.1; 123.2) efforts and with acc-4, 58.7 (56.0; 61.4) efforts per player were recorded. Further-more, the number of efforts with a high acceleration and initial
running speed from 0 to 1 m·s−1was more than twice as high with
acc-3 (63.4 [61.2; 65.6]) than with acc-4 (30.7 [29.1; 32.3]) or with high acc-% (29.7 [28.1; 31.2]). Only 35.5% (34.3%; 36.6%) of all efforts with high acc-% started with running speeds from 0 to
1 m·s−1, whereas 53.2% (52.2%; 54.2%) and 52.3% (51.1%;
53.6%) of all efforts with acc-3 and acc-4 started with running
speeds from 0 to 1 m·s−1.
Noticeably more efforts were recognized as high accelerations
with initial running speed>2 m·s−1when the acc-% method was
used instead of the acc-abs method. 23.0 (21.8; 24.3) efforts with
high acc-% had initial running speeds>2 m·s−1 (27.5% [26.4%;
28.5%] of all high acc-%), whereas only 14.4 (13.5;15.4) efforts (12.1% [11.5%; 12.7%] of all acc-3) and only 5.9 (5.5; 6.4) efforts (10.1% [9.5%; 10.8%] of all acc-4) were recognized with acc-3 and acc-4, respectively.
For each of the 3 classification methods, the majority of high
acceleration efforts did not obtain high running speeds. For high acc-%, 56.3 (53.3; 59.3) efforts (67.1% [65.3%; 68.8%] of all
high acc-%) did not reach 19.8 km·h−1, whereas 90.9 (87.1; 94.8)
efforts with acc-3 (76.1% [74.6%; 77.5%] of all acc-3) and 43.2 (40.8; 45.6) efforts with acc-4 (73.4% [71.6%; 75.2%] of all acc-4) did not obtain the high-speed running threshold.
Furthermore, only 7.0% (6.2%; 7.8%) of all efforts with high acc-% and only 4.4% (3.8%; 4.9%) and 5.1% (4.4%; 5.8%) of all efforts with acc-3 and acc-4 reached a maximal running speed
>25.2 km·h−1.
Ability of Indicators to Discriminate Between
Performance Levels and Field Positions
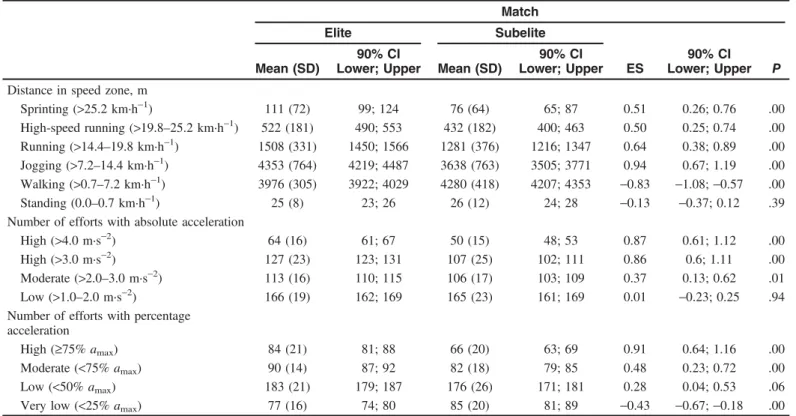
Table1 shows all indicators of physical load determined either
with the speed-based, the acc-abs, or the acc-% method. The largest differences with moderate ES existed in the number of
efforts with high acc-% (ES= 0.91 [0.64; 1.16]), in the number of
efforts with acc-3 (ES= 0.86 [0.60; 1.11]), and in the number
of efforts with acc-4 (ES= 0.87 [0.61; 1.12]). Elite players
performed more high accelerations than sub-elite players. Even though elite players performed more efforts with moderate acc-abs and moderate acc-% than sub-elite players, they only revealed small ES. No differences between elite and sub-elite players and trivial respectively small ES existed in the number of efforts with low acc-abs and low acc-%.
The ES of the distances in the running, high-speed running,
and sprinting categories were markedly lower (0.50–0.64) than the
ES of the distance in the jogging category (ES= 0.94 [0.67; 1.19]).
However, the values for elite players were greater than those observed for sub-elite players. Sub-elite players performed greater distance in the walking category than elite players with moderate
ES (ES= −0.83 [−1.08; −0.57]).
Figure 1 — All efforts with high accelerations (including 90% CI) de-pending on the used method. (A) The number of efforts with accelerations ≥75% amax. (B and C) The number of efforts with accelerations>3 m·s−2and
>4 m·s−2. The efforts are split up depending on the initial running speed (x-axis)
and the maximum running speed (different speed zones). Abbreviations: acc, acceleration; amax, maximal voluntary acceleration; HSR, high-speed
running.
Table 2shows all indicators of physical load dependent on the playing position, determined either with the speed-based, the acc-abs, or the acc-% method. CD covered less distance in the
running category compared with all otherfield positions, with large
to very large ES; moreover, they covered the least distance in the jogging category, with moderate to large ES (except for A, with trivial ES). In addition, CD had the CD had the fewest number of efforts with high acc-% with moderate to large ES compared with
players in otherfield positions and also the least number of efforts
with acc-3 and acc-4 but with small to moderate ES.
The CM had the highest number of efforts with high and moderate acc-% and the highest number of efforts with acc-3 and acc-4, with moderate to large ES (except for A, with small ES). In addition, the distances covered in the jogging and running
categories were the greatest for CM compared with all otherfield
positions, with moderate to very large ES. On the contrary, CM covered less distance in the sprinting category than players in other positions, with moderate to very large ES.
The WD and A covered the greatest distances in the high-speed running and sprinting categories compared with the other field positions, with moderate to very large ES (except for A compared with WM, with small ES). The number of efforts
with high acc-% was similar to that in otherfield positions (except
for A compared with CD, with A had more high acc-%).
Discussion
This study shows the strengths and limitations of the frequently used speed-based and the acc-abs methods, as well as the newly published
acc-% method to assess physical load in soccer. Furthermore, this study demonstrates the relevance of acceleration-based physical indicators in discriminating between soccer players of different performance levels and when describing positional requirements.
Strengths and Limitations of the Speed-Based
and the 2 Acceleration-Based Methods
A great number of efforts with high accelerations reach only low or moderate maximal running speeds. For instance, more than two-thirds of the highly accelerated efforts resulted in maximal running
speeds lower than 19.8 km·h−1. These results are in accordance
with the results from Varley and Aughey.26 They showed that
85% of the maximal accelerations had afinal speed <15.0 km·h−1.
Thus, the nomenclature of the speed-based method may indicate a different activity than was actually performed by the player because often only efforts with running speeds exceeding a certain speed
threshold (eg, >19.8 km·h−1) are considered as high-intensity
activity.30,31 The potential for misinterpretation of physical load
based solely on speed-zone data might be critical as not only the
motor effort itself (classified as jogging despite being an
acceler-ating sprint) but also the intensity (classified as “low” in jogging vs
“high” in accelerating sprints) is misleadingly classified. The misinterpretation also becomes obvious when positional differences are considered. In particular, CM have the greatest number of efforts with high acc-% and the greatest distance in the jogging and running category but shorter distance in the high-speed running category and the least distance in the sprinting category. Therefore, if only speed-based indicators are used to estimate
Table 1 Indicators of Physical Load
Match
Elite Subelite
Mean (SD)
90% CI
Lower; Upper Mean (SD)
90% CI
Lower; Upper ES
90% CI Lower; Upper P Distance in speed zone, m
Sprinting (>25.2 km·h−1) 111 (72) 99; 124 76 (64) 65; 87 0.51 0.26; 0.76 .00 High-speed running (>19.8–25.2 km·h−1 ) 522 (181) 490; 553 432 (182) 400; 463 0.50 0.25; 0.74 .00 Running (>14.4–19.8 km·h−1) 1508 (331) 1450; 1566 1281 (376) 1216; 1347 0.64 0.38; 0.89 .00 Jogging (>7.2–14.4 km·h−1) 4353 (764) 4219; 4487 3638 (763) 3505; 3771 0.94 0.67; 1.19 .00 Walking (>0.7–7.2 km·h−1) 3976 (305) 3922; 4029 4280 (418) 4207; 4353 −0.83 −1.08; −0.57 .00 Standing (0.0–0.7 km·h−1) 25 (8) 23; 26 26 (12) 24; 28 −0.13 −0.37; 0.12 .39
Number of efforts with absolute acceleration
High (>4.0 m·s−2) 64 (16) 61; 67 50 (15) 48; 53 0.87 0.61; 1.12 .00 High (>3.0 m·s−2) 127 (23) 123; 131 107 (25) 102; 111 0.86 0.6; 1.11 .00 Moderate (>2.0–3.0 m·s−2) 113 (16) 110; 115 106 (17) 103; 109 0.37 0.13; 0.62 .01
Low (>1.0–2.0 m·s−2) 166 (19) 162; 169 165 (23) 161; 169 0.01 −0.23; 0.25 .94
Number of efforts with percentage acceleration
High (≥75% amax) 84 (21) 81; 88 66 (20) 63; 69 0.91 0.64; 1.16 .00
Moderate (<75% amax) 90 (14) 87; 92 82 (18) 79; 85 0.48 0.23; 0.72 .00
Low (<50% amax) 183 (21) 179; 187 176 (26) 171; 181 0.28 0.04; 0.53 .06
Very low (<25% amax) 77 (16) 74; 80 85 (20) 81; 89 −0.43 −0.67; −0.18 .00 Abbreviations: amax, maximal voluntary acceleration; CI, confidence interval; ES, effect size (Cohen d). Note: Values are for the entire match. Indicators of 3 different
methods are compared: (1) the speed-based method with the corresponding indicators—distance covered in different speed zones; (2) the absolute acceleration-based method with the corresponding indicators—number of efforts above a given absolute acceleration threshold, and (3) the percentage acceleration-based method with the corresponding indicators—number of efforts above a given percentage acceleration threshold. A positive ES represents a larger mean for elite players. Statistical significance was set at P < .05.
2 Indicators of Physical Load in Relation to Playing Position Di stance in speed zone, m Number of efforts with abso lute acceleration Numbe r o f efforts with percentage acceleration Sprinting (> 25.2 km·h − 1 ) High-speed running (> 19.8 – 25.2 km·h – 1 ) Running (> 14.4 – 19.8 km·h – 1 ) Jogging (> 7.2 – 14.4 km·h – 1 ) Walking (> 0.7 – 7.2 km·h – 1 ) Standing (0.0 – 0.7 km·h – 1 ) Total distance High (> 4.0 m·s − 2 ) High (> 3.0 m·s − 2 ) Moderate (> 2.0 – 3.0 m·s − 2 ) Low (> 1.0 – 2.0 m·s − 2 ) High (≥75% amax ) Moderate (< 75% amax ) Low (< 50% amax )
Very low (<25% amax
) Mean (SD) 92 (57 ) 406 (14 6) 1199 (242) 3908 (573) 4085 (321) 27 (7) 9717 (520) 54 (17) 114 (27 ) 110 (12) 168 (19 ) 69 (23) 84 (15) 183 (21) 84 (14 ) 90% CI 71; 112 353; 460 1110; 1288 3697; 4118 3967; 4203 25; 30 9526; 9907 48; 61 104; 124 105 ; 114 161; 175 61; 77 78; 89 175; 191 78; 89 ES WD − 1.09* − 1.48* − 1.39* − 0.82 0.62 0.11 − 1.62* − 0.59 − 0.55 − 0.32 − 0.03 − 0.74 − 0.34 − 0.25 0.32 CM 0.82 − 0.32 − 2.14* − 1.92* 0.75 1.24* − 2.53* − 1.17* − 1.15* − 0.73 0.15 − 1.39* − 1.01* − 0.26 0.83 WM − 0.43 − 0.42 − 1.32* − 1.19 0.74 0.65 − 1.61* − 0.41 − 0.36 0.05 − 0.14 − 0.79 − 0.14 − 0.08 0.82 A − 0.82* − 1.55* − 1.24* − 0.06 − 0.13 0.09 − 1.11* − 0.71 − 0.69 0.20 0.66 − 0.93* − 0.51 0.75 0.45 Mean (SD) 154 (58 ) 606 (12 4) 1531 (236) 4362 (538) 3925 (184) 26 (8) 10,605 (573) 64 (15) 127 (21 ) 114 (15) 169 (21 ) 84 (18) 88 (12) 188 (19) 78 (21 ) 90% CI 134; 175 562; 649 1449; 1614 4174; 4551 3861; 3990 24; 29 10,405; 10,806 59; 69 120; 134 109 ; 120 161; 176 78; 90 84; 92 181; 195 71; 85 ES CM 2.05* 1.12* − 0.91* − 1.16* 0.30 1.02* − 0.91* − 0.64 − 0.70 − 0.35 0.17 − 0.75 − 0.80 0.00 0.36 WM 0.62 1.20 0.00 − 0.44 0.33 0.48 0.00 0.23 0.24 0.35 − 0.10 − 0.06 0.21 0.20 0.27 A 0.04 − 0.46 − 0.03 0.55 − 0.75 − 0.01 0.17 − 0.10 − 0.19 0.44 0.64 − 0.25 − 0.22 1.01* 0.03 Mean (SD) 52 (37 ) 454 (14 8) 1771 (291) 4992 (553) 3854 (291) 19 (6) 11,143 (606) 74 (17) 141 (20 ) 119 (14) 165 (16 ) 97 (17) 99 (15) 188 (18) 71 (16 ) 90% CI 38; 66 398; 510 1662; 1881 4784; 5200 3745; 3963 17; 21 10,915; 11,371 68; 80 134; 149 114 ; 125 159; 171 91; 104 93; 104 181; 195 65; 77 ES WM − 1.41 − 0.07 0.83 0.66 − 0.01 − 0.57 0.88 0.88 1.05 0.76 − 0.34 0.78 0.92 0.21 − 0.12 A − 1.53* − 1.27* 0.76 1.36* − 0.84* − 0.93* 0.89* 0.58 0.52 0.73 0.58 0.49 0.56 1.02* − 0.41 Mean (SD) 117 (64 ) 464 (95) 1532 (276) 4611 (636) 3857 (274) 23 (7) 10,603 (635) 61 (9) 122 (11 ) 109 (11) 171 (12 ) 85 (10) 86 (12) 185 (12) 73 (9) 90% CI 74; 160 400; 527 1347; 1716 4185; 5037 3673; 4041 18; 27 10,178; 11,028 54; 67 115; 130 102 ; 117 163; 178 79; 92 78; 94 176; 193 67; 79 ES A − 0.41 − 1.18* − 0.03 0.74 − 0.79 − 0.42 0.14 − 0.40 − 0.48 0.15 0.92 − 0.22 − 0.41 0.83 − 0.36 Mean (SD) 151 (90 ) 681 (21 6) 1540 (319) 3957 (989) 4130 (378) 26 (10) 10,486 (888) 65 (13) 131 (21 ) 106 (23) 156 (18 ) 89 (18) 91 (13) 166 (26) 77 (14 ) 90% CI 110; 192 583; 779 1395; 1685 3507; 4407 3958; 4302 22; 31 10,082; 10,890 60; 71 122; 140 96; 117 147; 164 80; 97 85; 97 154; 178 71; 84 evia tions: A, attack ers, amax , max imal volun tary acceleration; C D , central defende rs; CI, con fi de nce interval; C M , cen tral mid fi elders ; ES, ef fect size (Co hen d ); WD, wide defen ders ; WM, wide mid fi elders. Note: Values ar e essed for the entire match for youn g eli te socce r players. Indica tors of 3 differen t method s are com pared: (1 ) the spee d-based meth od with the cor responding indic ators — distance cover ed in different spee d zones, (2 ) the ab solute eleration -based meth od with the corre spondin g ind icators — numbe r o f efforts ab ove a give n ab solute accel eration threshold, and (3) the percentage acceleration-based method with the corr espondin g indicato rs — numb er of rts abov e a giv en perce ntag e acc eleration thre shold . A po sitive ES repr esents a larg er mea n for the ab ove-men tioned po sition. < .05.
http://doc.rero.ch
physical load, a relevant contributor to the physical load in soccer is
disregarded as stated earlier.5–11
By contrast, WD and A covered the greatest distances in the high-speed running and sprinting category compared with the other positions but had a similar number of efforts with high acc-% (except for A and CD). In this case, if only acceleration-based indicators are used, important aspects of these positions are ne-glected. Therefore, an evaluation either only taking indicators of the acceleration-based methods or indicators of the speed-based method into account would misinterpret physical load.
More than one-half of all efforts with acc-3 have initial running
speeds between 0 and 1 m·s−1, and only 14.4 efforts (12.1% of all
acc-3) started from speeds>2 m·s−1. These results are very similar
to already published results.26By contrast, only a third of all efforts
with high acc-% have initial speeds between 0 and 1 m·s−1, and
almost one-third of all efforts with high acc-% have initial running
speeds>2 m·s−1. As soccer players are often already in motion prior
to an accelerated effort to anticipate a match situation or to follow an opponent, it seems logical that a relevant number of efforts are initiated from a speed exceeding standing or walking. Because
even junior soccer players reach values of 6 m·s−2when
accelerat-ing maximally from a standaccelerat-ing position,153 m·s−2may be too low a
threshold for categorizing high acceleration for efforts starting with
a low initial running speed. Therefore, a threshold of>3 m·s−2for
high acceleration misclassifies efforts starting with low initial
running speeds as maximum accelerations even if they are only submaximal. As a consequence, twice as many efforts are counted as efforts with high acceleration when the threshold is set at
>3 m·s−2 than when it is set at >4 m·s−2 (120 vs 59 efforts).
Furthermore, using afixed absolute threshold incorrectly classifies
maximally accelerated efforts starting with high initial running speeds as submaximal accelerations. This is even more pronounced the higher the absolute threshold is set. Therefore, when an absolute
threshold of>4.0 m·s−2was chosen as a high acceleration, only 5.9
efforts (10.1% of all acc-4) started from initial running speeds
>2 m·s−1. The reason for this misclassification was previously
highlighted by showing that the acceleration capacity decreases
with increasing initial running speed.15
The results of our study suggest that the quantification of the
physical load and the nomenclature of the term“high acceleration”
can also be incorrect when an abs-acc method is used. For example,
Varley and Aughey26defined the threshold for maximal
accelera-tions by>2.78 m·s−2. As two-third of all“sprints” (≥6.94 m·s−1)
have accelerations≤2.78 m·s−2, they conclude that during
match-play, a player is not always demanded to accelerate maximally to achieve maximal speed. However, this statement may be imprecise,
as the level of accelerations from “sprints” initiated at higher
running speeds are wrongly classified. For example, efforts
initi-ated from 16.7 km·h−1have maximal accelerations15of 2.29 m·s−2
and would therefore be classified as submaximal. This
misinter-pretation has consequences not only when practitioners need to quantify the load the players are exposed to but also from the point of view of training methodology. The use of the abs-acc method may neglect the need to also train maximally accelerated runs from a higher initial running speed, which involves different muscle
groups and limb movement speeds/step patterns.32
The acc-% method avoids the biases introduced by the abs-acc method. In contrast to the speed-based and the acc-abs methods, it calculates the intensity thresholds either on the basis of individual results or on the basis of a team average. Consequently, a sprint test with maximal accelerations initiated from different running speeds is required to calculate the 25%, 50%, and 75% acceleration
thresholds. This approach has the advantage that the thresholds are performance dependent and are not generic (and arbitrary) values as with absolute thresholds. On the other hand, additional time for
sprints and for analyzing positional data is needed (see
“Measure-ment Methods”). It has to be noted at this stage that effort have been
made to use relative, individualized thresholds for the speed-based
method as well.30,33,34 However, these approaches also require
additional time to determine individual maximum speed or second ventilatory threshold.
Discriminative Ability of Indicators
The number of efforts with high abs-acc and high acc-% discrimi-nates the most between elite and sub-elite junior soccer players, underpinning the importance of a good acceleration ability and the willingness to repeatedly accelerate highly during matches at high performance level. When considering speed-based indicators, it
seems odd atfirst glance that the distance covered in the jogging
category discriminates the best. However, the reason for thisfinding
is based on the fact that elite players have more high accelerations than sub-elite players, and most of these efforts take place in the
speed range between 7.2 and 14.4 km·h−1. Thus, the great
discrimi-native ability of the distance in the jogging category is reinforced by these short, highly accelerated efforts and is not only the result of a large number of continuous runs. Each acceleration that either finishes, starts, or passes through the jogging zone will contribute to the distance covered in the jogging category, although the effort itself is obviously much more intense. In contrast to our study, some studies with adult participants have shown that players with higher performance levels have the greatest difference to players of lower
levels in the distances covered in high-speed zones.19There are also
studies showing that lower ranked teams covered more distance in
the high-speed running category than higher ranked teams.20–23
However, none of these former studies have taken acceleration-based indicators into account.
Strengths and Limitations of the Study
With the limited number of players, there is a lack of repeated measurement, and therefore, the player variation between matches was unable to be accounted for. However, the design of the study has the strength that all matches were played on the same match
location,35using the same measurement system (LPM), the same
playing surface36 and pitch dimensions, and the matches were
played in the same phase of the season37 and under the same
climatic conditions.38 In addition, because many different teams
were included (n= 14), the influence of team tactics as well as
individual player features can be reduced. All these reasons may lead to a reduction of the match-to-match variation. However, the discriminative ability between junior elite and sub-elite players and between different playing positions is limited to the sample used in this study and can only be transferred to other populations with caution.
The sub-elite players were on average 0.9 years older than the elite players (17.9 vs 17.0 y). It might be speculated that the discriminative ability of the indicators may have been even greater when the 2 groups had exactly the same average age.
Despite being muscularly demanding, deceleration phases were not considered in the acceleration-based methods nor ade-quately for the speed-based method. This limitation of the methods should be kept in mind as a practitioner when monitoring the physical load of a training process or a match. Further studies are
needed to analyze the deceleration performance of the players as it is a relevant contributor of the overall physical load.
Furthermore, approaches exist suggesting to use relative and
individualized thresholds for the speed-based method too.30,33,34
This may further improve the sensitivity of this approach to determine physical load based on speed data.
When using the acc-abs and the acc-% methods, the techno-logical aspects of any tracking system may represent a considerable limit. The LPM system seems to be one of the most accurate measurement systems to measure movement patterns in team
sports;39 nevertheless, its limitations are known.40
Practical Applications
• For a complete picture of the physical load in soccer, a combination of the acc-% and the speed-based method is recommended.
• Adjusting the nomenclature of the speed-based indicators would be preferable to avoid confusion about the type of
movements (eg, “low speed” instead of jogging, “very high
speed” instead of sprinting).
• Using acc-abs thresholds to describe efforts with high accel-eration, the number of detected efforts depends on the level of the threshold.
• In strength and conditioning training, attention must be paid to the development of the ability to maximally accelerate, while starting not only from low initial running speeds but also from moderate and high ones as well.
Conclusions
Our results show the relevance of the acceleration ability for high performance in soccer, at least in junior elite players, and the importance of acceleration-based data for the evaluation of physi-cal load. As maximal acceleration depends on the initial running speed, the acc-% method should be favored to acc-abs thresholds. A combination of speed-based and acceleration-based methods is important to get a comprehensive view, as each method on its own misses some important motor efforts. However, further studies are
needed to conclusively determine the definitive procedure to record
the total physical load. Acknowledgments
The authors thank the Swiss Football Association for their supportive collab-oration during the study and the players and their soccer clubs for their committed participation. The authors would also like to thank Marie Javet and Remo Fischer (from the Swiss Federal Institute of Sport Magglingen) for their assistance during testing sessions. The authors declare no conflict of interest.
References
1. Akenhead R, Nassis GP. Training load and player monitoring in high-level football: current practice and perceptions. Int J Sports Physiol Perform. 2016;11(5):587–593. PubMed ID:26456711doi:10.1123/ ijspp.2015-0331
2. Bourdon PC, Cardinale M, Murray A, et al. Monitoring athlete training loads: consensus statement. Int J Sports Physiol Perform. 2017;12(suppl 2):S2161–S2170. PubMed ID: 28463642 doi:10. 1123/IJSPP.2017-0208
3. Malone S, Owen A, Mendes B, Hughes B, Collins K, Gabbett TJ. High-speed running and sprinting as an injury risk factor in soccer: can well-developed physical qualities reduce the risk? J Sci Med Sport. 2018;21(3):257–262. PubMed ID: 28595870doi:10.1016/j. jsams.2017.05.016
4. Di Salvo V, Baron R, Tschan H, Calderon MFJ, Bachl N, Pigozzi F. Performance characteristics according to playing position in elite soccer. Int J Sports Med. 2007;28(3):222–227. PubMed ID:17024626
doi:10.1055/s-2006-924294
5. Akenhead R, Harley J, Tweddle S. Examining the external training load of an English premier league football team with special refer-ence to acceleration. J Strength Cond Res. 2016;30(9):2424–2432. PubMed ID:26817740doi:10.1519/JSC.0000000000001343
6. di Prampero PE, Botter A, Osgnach C. The energy cost of sprint running and the role of metabolic power in setting top performances. Eur J Appl Physiol. 2015;115(3):451–469. PubMed ID:25549786
doi:10.1007/s00421-014-3086-4
7. Gaudino P, Iaia FM, Alberti G, Hawkins RD, Strudwick AJ, Gregson W. Systematic bias between running speed and metabolic power data in elite soccer players: influence of drill type. Int J Sports Med. 2014;35(6):489–493. PubMed ID: 24165959 doi: 10.1055/s-0033-1355418
8. Gaudino P, Iaia FM, Alberti G, Strudwick AJ, Atkinson G, Gregson W. Monitoring training in elite soccer players: systematic bias between running speed and metabolic power data. Int J Sports Med. 2013;34(11):963–968. PubMed ID:23549691doi: 10.1055/s-0033-1337943
9. Ingebrigtsen J, Dalen T, Hjelde GH, Drust B, Wisloff U. Acceleration and sprint profiles of a professional elite football team in match play. Eur J Sport Sci. 2015;15(2):101–110. PubMed ID:25005777doi:
10.1080/17461391.2014.933879
10. Osgnach C, Poser S, Bernardini R, Rinaldo R, di Prampero PE. Energy cost and metabolic power in elite soccer: a new match analysis approach. Med Sci Sports Exerc. 2010;42(1):170–178. PubMed ID:
20010116doi:10.1249/MSS.0b013e3181ae5cfd
11. Akenhead R, Hayes PR, Thompson KG, French D. Diminutions of acceleration and deceleration output during professional football match play. J Sci Med Sport. 2013;16(6):556–561. PubMed ID:
23333009doi:10.1016/j.jsams.2012.12.005
12. Aughey RJ. Australian football player work rate: evidence of fatigue and pacing? Int J Sports Physiol Perform. 2010;5(3):394–405. PubMed ID:20861528doi:10.1123/ijspp.5.3.394
13. Bradley PS, Di Mascio M, Peart D, Olsen P, Sheldon B. High-intensity activity profiles of elite soccer players at different perfor-mance levels. J Strength Cond Res. 2010;24(9):2343–2351. PubMed
ID:19918194doi:10.1519/JSC.0b013e3181aeb1b3
14. Hodgson C, Akenhead R, Thomas K. Time-motion analysis of acceleration demands of 4v4 small-sided soccer games played on different pitch sizes. Hum Mov Sci. 2014;33:25–32. PubMed ID:
24576705doi:10.1016/j.humov.2013.12.002
15. Sonderegger K, Tschopp M, Taube W. The challenge of evaluating the intensity of short actions in soccer: a new methodological approach using percentage acceleration. PLoS One. 2016;11(11):e0166534. PubMed ID:27846308doi:10.1371/journal.pone.0166534
16. Rampinini E, Coutts AJ, Castagna C, Sassi R, Impellizzeri FM. Variation in top level soccer match performance. Int J Sports Med. 2007;28(12):1018–1024. PubMed ID: 17497575 doi: 10.1055/s-2007-965158
17. Bradley PS, Sheldon W, Wooster B, Olsen P, Boanas P, Krustrup P. High-intensity running in English FA Premier League soccer matches. J Sports Sci. 2009;27(2):159–168. PubMed ID:19153866
doi:10.1080/02640410802512775
18. Impellizzeri FM, Marcora SM. Test validation in sport physiology: lessons learned from clinimetrics. Int J Sports Physiol Perform. 2009; 4(2):269–277. PubMed ID:19567929doi:10.1123/ijspp.4.2.269
19. Mohr M, Krustrup P, Andersson H, Kirkendal D, Bangsbo J. Match activities of elite women soccer players at different performance levels. J Strength Cond Res. 2008;22(2):341–349. PubMed ID:
18550946doi:10.1519/JSC.0b013e318165fef6
20. Bradley PS, Carling C, Gomez Diaz A, et al. Match performance and physical capacity of players in the top three competitive standards of English professional soccer. Hum Mov Sci. 2013;32(4):808–821. PubMed ID:23978417doi:10.1016/j.humov.2013.06.002
21. Di Salvo V, Gregson W, Atkinson G, Tordoff P, Drust B. Analysis of high intensity activity in Premier League soccer. Int J Sports Med. 2009;30(3):205–212. PubMed ID: 19214939 doi: 10.1055/s-0028-1105950
22. Di Salvo V, Pigozzi F, Gonzalez-Haro C, Laughlin MS, De Witt JK. Match performance comparison in top English soccer leagues. Int J Sports Med. 2013;34(6):526–532. PubMed ID:23184481doi:10. 1055/s-0032-1327660
23. Rampinini E, Impellizzeri FM, Castagna C, Coutts AJ, Wisloff U. Technical performance during soccer matches of the Italian serie a league: effect of fatigue and competitive level. J Sci Med Sport. 2009; 12(1):227–233. PubMed ID: 18083631 doi:10.1016/j.jsams.2007. 10.002
24. Stevens TGA, de Ruiter CJ, van Niel C, van de Rhee R, Beek PJ, Savelsbergh GJP. Measuring acceleration and deceleration in soccer-specific movements using a local position measurement (LPM) system. Int J Sports Physiol Perform. 2014;9(3):446–456. PubMed
ID:24509777doi:10.1123/ijspp.2013-0340
25. Frencken W, Lemmink K, Delleman N. Soccer-specific accuracy and validity of the local position measurement (LPM) system. J Sci Med Sport. 2010;13(6):641–645. PubMed ID: 20594910doi:10.1016/j. jsams.2010.04.003
26. Varley MC, Aughey RJ. Acceleration profiles in elite Australian soccer. Int J Sports Med. 2013;34(1):34–39. PubMed ID:22895869
doi:10.1055/s-0032-1316315
27. Varley MC, Jaspers A, Helsen WF, Malone JJ. Methodological considerations when quantifying high-intensity efforts in team sport using global positioning system technology. Int J Sports Physiol Perform. 2017;12(8):1059–1068. PubMed ID: 28051343 doi:10. 1123/ijspp.2016-0534
28. Cohen J. Statistical Power Analysis for the Behavioural Sciences. Hillsdale, MI: Lawrence Erlbaum; 1988.
29. Batterham AM, Hopkins WG. Making meaningful inferences about magnitudes. Int J Sports Physiol Perform. 2006;1(1):50–57. PubMed
ID:19114737doi:10.1123/ijspp.1.1.50
30. Abt G, Lovell R. The use of individualized speed and intensity thresholds for determining the distance run at high-intensity in professional soccer. J Sports Sci. 2009;27(9):893–898. PubMed
ID:19629838doi:10.1080/02640410902998239
31. Fessi MS, Zarrouk N, Di Salvo V, Filetti C, Barker AR, Moalla W. Effects of tapering on physical match activities in professional soccer players. J Sports Sci. 2016;34(24):2189–2194. PubMed ID:27065344
doi:10.1080/02640414.2016.1171891
32. Schache AG, Dorn TW, Williams GP, Brown NA, Pandy MG. Lower-limb muscular strategies for increasing running speed. J Orthop Sports Phys Ther. 2014;44(10):813–824. PubMed ID:
25103134doi:10.2519/jospt.2014.5433
33. Gabbett TJ. Use of relative speed zones increases the high-speed running performed in team sport match play. J Strength Cond Res. 2015;29(12):3353–3359. PubMed ID: 26020710doi:10.1519/JSC. 0000000000001016
34. Murray NB, Gabbett TJ, Townshend AD. The use of relative speed zones in Australian football: are we really measuring what we think we are? Int J Sports Physiol Perform. 2018;13(4):442–451. PubMed
ID:28872423doi:10.1123/ijspp.2017-0148
35. Lago C. The influence of match location, quality of opposition, and match status on possession strategies in professional association foot-ball. J Sports Sci. 2009;27(13):1463–1469. PubMed ID: 19757296
doi:10.1080/02640410903131681
36. Andersson H, Ekblom B, Krustrup P. Elite football on artificial turf versus natural grass: movement patterns, technical standards, and player impressions. J Sports Sci. 2008;26(2):113–122. PubMed ID:
17852688doi:10.1080/02640410701422076
37. Kempton T, Sullivan C, Bilsborough JC, Cordy J, Coutts AJ. Match-to-match variation in physical activity and technical skill measures in professional Australian Football. J Sci Med Sport. 2015;18(1):109–113. PubMed ID:24444753doi:10.1016/j.jsams. 2013.12.006
38. Mohr M, Nybo L, Grantham J, Racinais S. Physiological responses and physical performance during football in the heat. PLoS One. 2012;7(6):e39202. PubMed ID:22723963doi:10.1371/journal.pone. 0039202
39. Hoppe MW, Baumgart C, Polglaze T, Freiwald J. Validity and reliability of GPS and LPS for measuring distances covered and sprint mechanical properties in team sports. PLoS One. 2018; 13(2):e0192708. PubMed ID:29420620doi:10.1371/journal.pone. 0192708
40. Ogris G, Leser R, Horsak B, Kornfeind P, Heller M, Baca A. Accuracy of the LPM tracking system considering dynamic posi-tion changes. J Sports Sci. 2012;30(14):1503–1511. PubMed ID:
22906154doi:10.1080/02640414.2012.712712