Publisher’s version / Version de l'éditeur:
Journal of Thermal Insulation, 10, Apr, pp. 243-255, 1987-04
READ THESE TERMS AND CONDITIONS CAREFULLY BEFORE USING THIS WEBSITE. https://nrc-publications.canada.ca/eng/copyright
Vous avez des questions? Nous pouvons vous aider. Pour communiquer directement avec un auteur, consultez la première page de la revue dans laquelle son article a été publié afin de trouver ses coordonnées. Si vous n’arrivez pas à les repérer, communiquez avec nous à PublicationsArchive-ArchivesPublications@nrc-cnrc.gc.ca.
Questions? Contact the NRC Publications Archive team at
PublicationsArchive-ArchivesPublications@nrc-cnrc.gc.ca. If you wish to email the authors directly, please see the first page of the publication for their contact information.
NRC Publications Archive
Archives des publications du CNRC
This publication could be one of several versions: author’s original, accepted manuscript or the publisher’s version. / La version de cette publication peut être l’une des suivantes : la version prépublication de l’auteur, la version acceptée du manuscrit ou la version de l’éditeur.
Access and use of this website and the material on it are subject to the Terms and Conditions set forth at
Moisture transport through glass-fibre insulation in the presence of a
thermal gradient
Kumaran, M. K.
https://publications-cnrc.canada.ca/fra/droits
L’accès à ce site Web et l’utilisation de son contenu sont assujettis aux conditions présentées dans le site LISEZ CES CONDITIONS ATTENTIVEMENT AVANT D’UTILISER CE SITE WEB.
NRC Publications Record / Notice d'Archives des publications de CNRC:
https://nrc-publications.canada.ca/eng/view/object/?id=e653517f-9488-4d30-8282-bd280b963a62 https://publications-cnrc.canada.ca/fra/voir/objet/?id=e653517f-9488-4d30-8282-bd280b963a62
Ser
i
TH1
/
National Research Conseil national N21d Council Canada de recherches Canada n o *1487p
Institute for lnstitut dec. 2 Research in recherche en
BLDG Construction construction
Moisture Transport through
Glass-Fibre Insulation
in
the
Presence of a Thermal Gradient
I
by M.K. KurnaranReprinted from
Journal of Thermal Insulation Vol. 10, A ri1 1987
p. 243
-
25g
(IRC Paper No. 1487)
N R C
-
C I S T IL I B R A R Y
Price $4.00 NRCC 28451JAN
11
1986
B I B L I O T H ~ Q U E
I
I .
I R C
C N W C-
ICiST~ S U M B
On a u t i l i s e un t h e r m o f l u x m i ? t r e p o u r m e s u r e r l e f l u x t h e r m i q u e d a n s u n e e p r o u v e t t e humide d ' i s o l a n t e n f i b r e d e v e r r e B f a i b l e d e n s i t e . L e s r e s u l t a t s o n t r e v 6 1 6 q u e l a p S n 6 t r a t i o n d e l ' h u m i d i t 6 d a n s l t 6 p r o u v e t t e s e f a i t e s s e n t i e l l e m e n t p a r d i f f u s i o n d e v a p e u r d ' e a u . On p r o p o s e u n r n o d e l e thermodynamique r e p r e s e n t a n t c e p r o c e s s u s d e p S n 6 t r a t i o n . Ce m o d e l e p e r m e t d ' o b t e n i r d e u x c o e E f i c i e n t s d e p 6 n C t r a t i o n d e l ' h u m i d i t 6 q u i s o n t c a r a c t e r i s t i q u e s d e 1 ' 6 p r o u v e t t e . - - - - - - - --
r-
-
1
Moisture Transport Through
Glass-Fibre Insulation in the Presence
n-.
nal Gradient
M. K. KUMARAN
B ~ ~ i l d i n g Sevvices Section Institutejk Research it1 Conrtrtrcrion National Res~avch Co~rncil of Canada Ottawa, Oi~tario, Canada, K I A OR6
ABSTRACT
A heat flow meter apparatus is used to monitor the hcat flux across a moist speci- men o f a low density glass-fibre insulation. Thc results indicate that moisture is transported through the specimcn,predominately by vapour diffusion. A thermo- dynamic model is suggested to represent the transport process. This model leads to t w o moisturc transport coefficients characteristic of the spccimen.
.
,KEY WORDS
. .
...
Thermal insulation, molsturc, heat flux, vapour pressure, enthalpy, enthalpy of vaporization, diffus~on, thermal diffusion.
INTRODUCTION
T
HEORETICAL M O D E L S FOR the calculation of heat transfer through a moist building material require accurate knowledge of the :heat and moisture transport characteristics of the material. A survey of literature ' 0 reveals a current lack of this knowledge. This paper aims at a quantitative understanding of the mositure transport characteristics of one of the most widely used thermal insulations, namely glass-fibre. For this purpose, a set-.
of experiments were carried out systematically~on a specimen oclow density glass-fibre insulation. Although some of these experiments are similar to those reported by Langlais [I], the experimental results from the present in-vestigation are used to calculate two moisture transport coefficients, which are characteristic of the specimen. These calculations use equations from classical thermodynamics.
EXPERIMENTAL METHODS AND RESULTS
A sample of low density glass-fibre insulation with a bulk density of 17 kg.m+ that had been exposed to laboratory conditions for two to three years was chosen for the experiments. A specimen was prepared from this
sample having an area of 58 x 58 cm and an average thickness of 8.55 cm.
The initial mass of the specimen was 493 g. This specimen was dried in an oven at 378 K for approximately 100 h. This resulted in a specimen mass loss of 5 g, which is attributed to the moisture adsorbed during its exposure to laboratory conditions. Six different sets of experiments were done on the specimen. The principal measurement was that of heat flux through the specimen as a function of time for selected pairs of hot and coId tempera- tures on the surfaces. This was done in a horizontal "24 inch heat flow meter (HFM) apparatus" [2] with a metering area of 30.5 x 30.5 cm. The direction
of the heat flux was always upwards. Heat fluxes were recorded at both sur- faces of the specimen. The six different sets of experiments conducted are summarized below:
Experiment No. 1
The dry specimen was sealed in a polyethylene bag and placed in the HFM apparatus with the hot surface temperature a t (312.5
*
0.1) K and the cold1 0
0 0. 3 0. 6 0. 9 1 . 2 1 . 5 T I M E , h
FIGURE l(a). Heat flux through specimen as a function of t i ~ n c , Expcrimcnt No. 1 .
l-
I
T,, = 312.5 K-
T C = 2 8 4 . 6 K M O I S T U R E = 0 g-
-
1 2 . 6 W. m - 2-
1 I1
surface temperature at (284.6
*
0.1) K. The history of the mean heat flux asmonitored in 2 min intervals is shown in Figure l(a). The specimen attained
the steady state in 45 min and the steady state heat flux was (12.6 0.2)
W-m-2.
Experiment
No.
2Next the specimen was removed from the polyethylene bag, placed in a plexiglass chamber and exposed to a stream of moist air with an RH of 75%
at 296 K for 24 h, and then \vcighed. The increase in mass was 6 g. It was
immediately sealed in the polyethylene bag and placed in the H F M appara-
tus. The surface temperatures were the same as in experiment no. 1. The
specimen again attained the steady state in 43 min. The heat flux monitored was identical to that shown in Figure l(a). The steady state heat flux was
once again (12.6
+
0.2) W.rn-2.Experiment
No.
3The specimen was once again removed from the polyethylene bag and ex-
posed to an air stream of RH 90'X) at 396 K for 2-4 h. I t gained only 1 g of
moisture at this stage. An increase of the RH to approximately 93% had no noticeable effect on the adsorption. So in order to introduce more moisture,
the specimen was laid flat and at each of 23 evenly distributed points 2 cm3
of water was injected into the specimen with a hypodermic syringe. The total moisture content was thus increased to 57 g. It was then sealed in the
bag and placed in the HFM apparatus with the surface on which the water
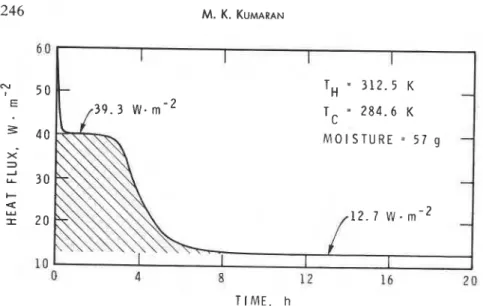
was injected closer to the hot surface. The heat flux was monitored for 30 h . .3 3 0 2 6 E % 2 2 M O I S T U R E = 5 7 g X 3 1 8 C u
%
1 4I
11
0 8 16 2 4 3 2 4D TIME, hI
I T,, = 3 1 2 . 5 K-
T C = 2 8 4 . 6 K M O I S T U R E = 5 7 g-
-
1 2 . 7 W . m - 2-
I I 4 8 12 1 6 2 0 TIME, hFIGURE l(c). Hear flux through specimen as a function of time. Exper~menr No. 4. for the same pair of surface temperatures as in experiment no. 1. The history of the mean heat flux is shown in Figure l(b). Within one hour, the specimen attained an initial steady state, which lasted for approximately 14 h. Then it moved o n to the final steady state. The heat flux for the initial steady state
was (18.1
*
0.2) W.m+ and the final value was once again (12.6+
0.2)W-m-2.
Experiment No. 4
The specimen from the final steady state of experiment no. 3 was turned upside down in the H F M apparatus and the heat flux once again monitored until the steady state was reached. The history of this is shown in Figure l(c). Again the system went through a well defined initial steady state but with a
higher heat flux of (39.3 0.4) W-m-2, which lasted for about 3 h. The
final steady state was again characterized by a constant heat flux of (12.7
*
0.2) W.m-'.
Experiment No. 5
The specimen was removed from the bag once again and an additional amount of water was injected at the colder surface of the specimen. The total amount of water was thus increased t o 91 g. It was put back in the polyeth- ylene bag and placed in the H F M apparatus with the surface on which water was injected closer to the hot plate. The surface temperatures were the same as those in the previous experiments. The heat flux was recorded as a func- tion of time and is shown in Figure l(d). The specimen went through an ini- tial steady state as in experiment no. 4 and then through an intermediate
6 0
I
1
T,, = 3 1 2 . 5 K 5 0-
-
T C = 284.6 K M O I S T U R E = 9 1 g-
-
16. 8 W . rn-' 12.6 W. rn-' 1 0 I I I 0 7 14 2 1 2 8 3 5 T I M E , hFIGURE l(d). Hrdt tlus through spccimcn .IS J function of tlmc. Espcrimcnt No. 5. injcctcd sidc up. 6 0 5 0 E 4 0 M O I S T U R E = 9 1 g X 3 3 0 C a 20 10 0 4 8 12 16 2 0 T I M E , h
FIGURE l(e). Hcar tlux through spcclmcn as a t i ~ n c t ~ o n of tlrnc, E x p e r ~ r n c i ~ t N o 6. lnjccted s ~ d c down.
stage which was not well defined, as seen from Figure l(d); after 30 h it at-
tained the final steady state with the heat flux equal to (12.7
+
0.2) W-m-2.At this stage the sample was turned upside down in the HFM apparatus 2nd the heat flux monitored as shown in Figure l(e). The system went through a very well defined initial steady state as in experiment no. 4 with
a heat flux of (38.9
+
0.4) W-m-', which lasted for approximately 5.5 h.The final steady state was once again (12.6
+
0.2)Experiment No. 6
In this experiment the heat flux was monitored for three different pairs of surface temperatures, the moisture content in the specimen being the same as in experiment no. 5 . The aim was to examine the effect of different tempera- ture and vapour pressure gradients on the initial and final steady states. In all three cases the heat flux indicated a well defined intermediate steady state, as shown in Figure l ( f ) . The results of these measurements are sumnlarized in Table 1.
DISCUSSION
Though these experiments were not aimed at the study of adsorption characteristics of glass-fibre insulations, they throw some light on these properties. The specimen was exposed to the laboratory conditions (say 294 K and 30 to 50% RH) for a long time and the amount of moisture adsorbed
by it was very small-approximately 5 g for 487 g of insulation. Exposure
of the material to streams of moist air of up to 93% R H resulted only in an
TIME, h
FIGURE l(f). Heat flux through specimen as a function of time, Experimenr No. 6, 3 pairs
Moisture E a ~ s p o r t Throilgh Glass-Fibre I~isrrlation 249
Table 1 . Experimental data on hot surface temperature (TH), cold surface temperature (Tc), heat flux (q,) a t the initial steady state, heat flux at the final steady state (qF), the equilibrium vapour pressures PH and PC a t TH and Tc and
the approximate duration (t,) of the moisture transport*: n is the mass flux calculated using Equation (2).
TH Tc QI QF PH PC t , n
(K) (K) (W.m-2) ( W . m 2 ) (Pa) (Pa) (h) (g.m-2.s-')
'The time corresponding to the mid-point of the transient process that links the initial and final steady states is considered here as the approximate duration of the moisture transport.
insignificant amount of moisture being adsorbed; experiments 1 and 2 show that this adsorption has negligible effect on the heat transfer characteristics of the material.
All the experiments show beyond doubt that in the presence of the ther- mal gradient, moisture is transferred from the hot surface and deposited at the cold surface. In the process represented by Figure l(b), water is already midway between the hot and cold surfaces because of the manner in which it was introduced in the specimen. The amount of moisture present in this case is identical to that involved in the process represented by Figure l(c). Both these processes are characterized by an initial steady state but the heat flux at the initial steady state in the latter case is higher (39.3 W-rn-" than that in the former (18.1 W.m-2). This is simply because in the latter case, moisture has to traverse a larger distance, the full thickness (and hence a larger temperature gradient) of the specimen. At the same time the energy involved in these moisture transfers is identical, as is estimated from the shaded areas in Figures l(b) and l(c); in each case this energy is 370 kJ-m-2. Thus, apparently, the extra energy involved depends only on the amount of moisture and not on the initial region of its occurrence in the specimen. Once the moisture is transferred completely to the colder surface, the mate- rial behaves identically to the dry material and moisture no longer contrib- utes to the heat transfer through the insulation.
In the process represented by Figure lid), water is initially present in two different regions and the total moisture transfer is achieved through two dif- ferent intermediate stages; the first of these is similar to that in Figure l(c)
--
and represents the transfer of moisture closer to the hot surface. The otherone represents the transfer of the moisture introduced by injection. In the process represented by Figure l(e), whlch involves the same amount of moisture as in Figure l(d), the total transfer is achieved in a single stage.
-
250 M. K. KUMARAN
This is identical to that in Figure l(c) except that the initial steady state is longer (about 5% hr) in comparison with the 3 h in Figure l(c). This is simply because more water is to be transferred in this process. The total en- ergy involved in this process is 640 kJ.m-', in comparison with 370 kJ.m-2 in Figure l(c); the total amount of moisture involved here is 91 g, in compar- ison with 57 g in Figure l(c). To a first approximation, the total energy in- volved in the moisture transfer is directly proportional to the amount of water transferred.
All the three processes represented by Figure l ( f ) are identical, except for the hot and cold surface temperatures. The most important feature of these processes is that, during the initial steady state, moisture is transferred from the hot surface to the cold surface at a steady rate. This steady rate is main- tained as long as both surfaces contain liquid water. From the theory of ir- reversible processes, the actual rate at which the transfer occurs should de- pend on the difference in temperature and on the difference in the chemical potential (Gibb's free energy) of water at the two states. For all these studies the temperatures chosen are appreciably lower than the normal boiling tem- perature of water and it may be hypothesized that the chemical potential can be adequately represented by the vapour pressure of water at the surface temperature. This hypothesis will be particularly valid when the vapour pressure is significantly lower than atmospheric pressure. The initial steady state process in these cases may be schematically represented as follows:
Diffusion through insulation
Vapour (TH, pH)
-
Vapour (Tc, PC)t
Vaporisation1
CondensationWater (TH, pH) Water (Tc, PC)
The result of this process is that water is transferred from one temperature point to another through the specimen. Let us assume that this is achieved as follows. Water is evaporated at a constant rate at TH, the vapour is driven through the specimen and condensed back into water at T,. As stated earlier, in all the experiments the heat fluxes were monitored at both surfaces. -, Within the limits of the precision of these measurements, at each initial and - final steady state, the difference between the heat fluxes at the hot and cold surfaces was negligible. Hence it may also be hypothesized that at the initial steady state, the rate of evaporation at the hot surface is equal to the rate of
--
condensation at the cold surface. This thermodynamic model neglects any possibility of the condensed water returning to the hot surface. The moisture content in all the experiments was less than 1%) by volume of the insulationand it is believed that the above condition is not violated. Furthermore, the
I
identical final steady states attained by the dry and moist specimens in ex-I periments 1 and 3 also suggest that the above condition is fulfilled. Suppose
the rate of vaporization and condensation is r r . Thermodynamically the heat
i
(q,) transported in this process will bewherc
A;H
is the average specific enthalpy of vaporization betweenTH
andTc,
HH
is the specific enthalpy of water atTH,
andHc,
that atTc.
It is assumed that the enthalpy change involved in this process as a result of the resistance offered by the material is negligible.In Equation (I),
A;H
may be estimated as a mean value for the tempera- ture rangeTH
toTc
by the application of the Clausius-Clapeyron equation. Thus Equation (1) may be written aswhere R is the gas constant, and
PH
and PC are equilibrium vapour pressure of water a tTH
andTc.
From the experimental measurements
where q, and q, are the heat fluxes at the initial and final steady states. The quantities
P,,
PC,
HH and H, are available from standard tables [3] and the only unknown quantity, n , in Equation (2) can be calculated.This calculation was carried out with the data corresponding to Figures l(e) and l ( f ) and the results are summarized in Table 1.
The validity of this hypothetical calculation can be checked as follows. From the values for n from Table 1, knowing the total amount of water in- volved in the transport process and the area of the specimen, the duration of
-.
the moisture transport process can be calculated and compared to the ex-perimental values. The total amount of moisture is 91 g, distributed over an area of 0.3364 m2. Hence the total moisture to be driven across the specimen
"
can'be expressed as 270.5 g.m-'. For the process represented by Figure l(e),
rz = 0.01027 g.m-2.s-'. Hence the moisture should be driven within 7.3 h. Similarly, the processes represented by Figure l(f), the moisture should be transferred within 6.6 h, 4 h and 3.1 h. It can be seen from Table 1 that these
calculated values agree very well with the values estimated from Figure l(f). Let us now examine the dependence of n on AP = P,
-
PC and AT =TH
-
Tc. From data in Figure 2, n appears to be linearly dependent on A P . A linear least squares analysis of the data gave the equationwhere K, = 1.06 x g,m-2.s-' and
K 2
= 1.58 x g.rn-'-~-~-l)rr-'with a linear correlation coeficjent = 0.9998. Equation (4) reveals a non-
zero intercept and suggcsts that cven in the absence of a vapour pressure gra- dient, moisture transfcr may c x i s t , In other words a driving force other than
AP is also rcsponsiblr for the moisture transport. The obvious choice for the seco~id potential in the present rxperimcntal investigation is AT.
Thus rr = r r (LIP, A T ) . For a narrow range of pressurc and tcmpcrature one may assume a linear relationship such as
A least-squares analysis showed that, in comparison with Equation (4), the
data in Table 1 are equally well represented by Equation (5) with Kd = 1.58 x g.m.s-'.Pa-' and K4 = 2.745 x lo-' g.m-2.s-'.K-1. Further, the constants K 3 and K4 in Equation (5) have physical significance: K 3 is the water vapour permeability and K4 is the coefficient of thermal vapour difTu-
A P . P a
FIGURE 2. Linear dependence o f moisturc flux ( 1 1 ) o n vapour prcssurc difference (AP) across the specimen.
ERRATA
'
Moisture Transport through Glass-Fibre Insulation in
the Presence of a Thermal Gradient, by M.K. Kumaran
Journal of Thermal Insulation, Vol. 10, April 1987
Page 252
Paragraph
immediately
following
Equation
5:
Second line: Please change
Kd
=1.58
x
g - r n * s - l - ~ a - l
t o
K 3
=1.58
xg * m - 2 * s - 1 * ~ a - 1
Table 2 . Experimental results from the measurements on the second specimen of
glass fibre insulation; the symbols have the same meaning as in Table 1 .
sion. TWO separate determinations of K 3 of the specimen by the standard dry-cup method [4] gave the values 1.5 x and 1.6 x g.m-'.s-'- Pa-', in good agreement with K , = 1.38 x g.m-2.s-'.Pa-' calculated from the thermal measurement.
Admittedly, the data in Table 1 do not represent a large variation in A T and hence do not establish the need for A T term in Equation (5). Therefore, to confirm the validity of Equation (5) another series of measurements, as in experiment no. 6, was done on a second specimen of glass fibre insulation with a bulk density of 30.0 kg.m-3 and average thickness 5.47 cm. The results of these measurements are summarized in Table 2. Analysis of the data in Table 2 in terms of Equation (4) resulted in
with a linear correlation coefficient equal to 0.9996. This once again estab- lishes the non-zero intercept in Equation (4) and leads to Equation (5) as dis- cussed earlier. Reanalysis of the data in terms of Equation ( 5 ) yielded
with an overall correlation coefficient equal to 0.9993.
CONCLUSIONS
Adsorption of moisture from air with RH up to 93% in the form of water vapour does not significantly affect the thermal performance of the speci- men. In this specimen water is apparently transferred predominantly as
water vapour in the presence of a thermal gradient. Once the transfer is
,
complete, the insulation performs as if it were a dry material. For a given specimen, the rate of moisture transfer is defined by the difference in the vapour pressure at the two points of transfer.The heat flux measurements done on this material are used to calculate two moisture transport characteristics that describe the transport of mois- ture in the presence of a thermal gradient. It may be possible to formulate a test method based o n these experiments, applicable to wet glass-fibre insula- tion in which all the moisture is initially at the hot surface. In such a test method, two moisture transport characteristics in addition to the conven- tional apparent thermal conductivity will be determined using a heat flow
meter apparatus. These thrcc material characteristics. used together in prc-
dictive models for simultaneous heat and moisture transfer, should give more realistic description of the rranport processes through glass-tibrc In-
sulation, in conlparison with the traditional mcthod of using an " ~ p p ~ r c n r thermal conductivity of ,I moist thermal insulation." To exploit this. more
measurements must be done for a wider temperature range, not only on other specimens of glass-fibre insulation, but on all materials that are used as thermal insulation.
ACKNOWLEDGEMENTS
I
The author gratefully acknowledges the technical assistance of Mr. R. G. Marchand and Mr. J. G. Theriault. This paper is a contribution of the Insti- tute for Research in Construction, National Research Council of Canada.
REFERENCES
1 . Langlais, C . , M. Hyrien and S. Klarsfeld. "Moisture Migration in Fibrous In- sulating Materials Undcr the Influence of a Thermal Gradient and its Effcct on Thermal Resistance," i140isturr Mieration in Buildings, ASTM special technical pub- lication 779, p. 191 (1982).
2. ASTM standard test method C518. "Standard Test Method for Stcady-State Thermal Transmission Properties by Means o f the Heat Flow Meter." 1981 An- nual book of ASTM standards, p. 224.
3. C R C Handbook of Chemistry arzd Physics. 66th edition, pp. D-171 and D-189 (1985).
4. ASTM standard test method C355. "Standard Test Method for Water Vapor Transmission o f Thick Materials." 1981 Annual book o f ASTM standards, p. 124.
BIOGRAPHY
Dr. M . K. Kumaran is an Associate Research Officer at the Institute for Research in Construction. National Research Council of Canada. He
received his BSc (Chemistry and Physics) and MSc (Pure Chemistry) degrees from Kerala University, India, in 1963 and 1967 and Ph.D. (Chcmi- cal Thermodynamics) degree from University College, London, England, in 1976. He worked as a Lecturer in Chemistry at Sree Narayana College, Can- nanorc, India (1967-1980) and as a Research Fellow a t Massey University, New Zealand (1980-1981) before he joined the NRCC as a Research Asso- ciate in the Division of Chemistry. He joined the research staff of IRC in
T h i s paper i s being d i s t r i b u t e d i n r e p r i n t form by t h e I n s t i t u t e f o r Research i n C o n s t r u c t i o n . A l i s t of b u i l d i n g p r a c t i c e and r e s e a r c h p u b l i c a t i o n s a v a i l a b l e from t h e I n s t i t u t e may be o b t a i n e d by w r i t i n g t o t h e P u b l i c a t i o n s S e c t i o n , I n s t i t u t e f o r R e s e a r c h i n C o n s t r u c t i o n , N a t i o n a l Research C o u n c i l of C a n a d a , O t t a w a , O n t a r i o ,
KlA OR6.
Ce document e s t d i s t r i b u 6 sous forme de t i & - & p a r t p a r 1 ' I n s t i t u t de r e c h e r c h e e n c o n s t r u c t i o n . O n peut o b t e n i r une l i s t e d e s p u b l i c a t i o n s de 1 ' I n s t i t u t p o r t a n t s u r l e s t e c h n i q u e s ou l e s r e c h e r c h e s e n m a t i e r e d e b a t i m e n t e n 6 c r i v a n t 3 l a S e c t i o n d e s p u b l i c a t i o n s , I n s t i t u t de r e c h e r c h e e n c o n s t r u c t i o n , C o n s e i l n a t i o n a l d e r e c h e r c h e s du Canada, Ottawa ( O n t a r i o ) , K1A OR6.