Cluster expansion and optimization of
thermal conductivity in SiGe nanowires
The MIT Faculty has made this article openly available. Please share
how this access benefits you. Your story matters.
Citation
Chan, M.K.Y. et al. "Cluster expansion and optimization of thermal
conductivity in SiGe nanowires." Physical Review B 81.17 (2010):
174303. © 2010 The American Physical Society
As Published
http://dx.doi.org/10.1103/PhysRevB.81.174303
Publisher
American Physical Society
Version
Final published version
Citable link
http://hdl.handle.net/1721.1/58591
Terms of Use
Article is made available in accordance with the publisher's
policy and may be subject to US copyright law. Please refer to the
publisher's site for terms of use.
Cluster expansion and optimization of thermal conductivity in SiGe nanowires
M. K. Y. Chan,1,2J. Reed,3D. Donadio,4T. Mueller,2Y. S. Meng,2,5 G. Galli,4and G. Ceder2
1Department of Physics, Massachusetts Institute of Technology, Cambridge, MA 02139, USA
2Department of Materials Science and Engineering, Massachusetts Institute of Technology, Cambridge, MA 02139, USA 3Lawrence Livermore National Laboratory, Livermore, CA 94551, USA
4Department of Chemistry, University of California, Davis, Davis, CA 95616, USA 5Department of NanoEngineering, University of California, San Diego, La Jolla, CA 92093, USA
共Received 29 July 2009; revised manuscript received 27 March 2010; published 7 May 2010兲 We investigate the parametrization and optimization of thermal conductivity in silicon-germanium alloy nanowires by the cluster-expansion technique. Si1−xGexnanowires are of interest for thermoelectric applica-tions and the reduction in lattice thermal conductivity共L兲 is desired for enhancing the thermoelectric figure of merit. We seek the minimization ofLwith respect to arrangements of Si and Ge atoms in 1.5 nm diameter
关111兴 Si1−xGex nanowires, by obtainingLfrom equilibrium classical molecular-dynamics共MD兲 simulations
via the Green-Kubo formalism, and parametrizing the results with a coarse-grained cluster expansion. Using genetic algorithm optimization with the coarse-grained cluster expansion, we are able to predict configurations that significantly decreaseLas verified by subsequent MD simulations. Our results indicate that superlattice-like configurations with planes of Ge show drastically loweredL.
DOI:10.1103/PhysRevB.81.174303 PACS number共s兲: 68.65.⫺k, 63.20.dh, 63.22.Gh, 65.80.⫺g
I. INTRODUCTION
A. SiGe nanowires for thermoelectric applications
Minimizing the thermal conductivity in silicon-germanium nanowires through nanostructuring is of interest for thermoelectric applications. Bulk SiGe alloys have been used for thermoelectric power generation for several de-cades, most notably in NASA space missions since the 1970s. The mass disorder in Si-Ge causes enhanced phonon scattering, thereby reducing the thermal conductivity without significant modification of the electronic properties. Since proposed by Hicks and Dresselhaus1,2 in the 1990s, lower
dimensional systems such as quantum wells,3 thin films,4
superlattices,5nanocomposites,6,7 and nanowires8 have been
actively investigated for improved thermoelectric properties. Thermoelectric performance is measured by the figure of merit ZT = S2T/共e+L兲, where S is the Seebeck coefficient,
is the electrical conductivity, T is the temperature, ande
andLare the electronic and lattice contributions to thermal
conductivity, respectively. A key attribute of nanostructuring is the possibility for achieving high ZT by reducing L
through the confinement and enhanced scattering of phonons, without a concomitant reduction in or S. This may be possible because of the disparate wavelengths and scattering lengths of electrons vs phonons.9Experimental
re-sults show nanostructuring to be effective at reducingL. For
example, silicon nanowires with diameters from 20 to 100 nm show a thermal conductivity of 10–40 W/m K at 300 K,10 compared to 124 W/m K for bulk Si.11Si/SiGe
super-lattice nanowires show a further fivefold reduction in thermal conductivity compared to pure Si nanowires of similar diameters.12In SiGe nanocomposites consisting of 10 nm Si
nanoparticles in a Ge host, Lhas been measured to be less
than 2 W/m K.13Pure Si nanowires with roughened surfaces
have been measured to have L as low as 1.2 W/m K,14
consistent with results of molecular-dynamics 共MD兲 simula-tions for thin wires with disordered surfaces. Nanowires with rough, amorphous surfaces, and crystalline cores are
particu-larly attractive for thermoelectric applications since crystal-linity is beneficial to charge mobility. The various experi-mental results show that Ldepends sensitively not only on
the size of the nanostructures but also on the type and ar-rangement of atoms therein. In this paper we address the question of what arrangements共i.e., configurations兲 of Si and Ge atoms in the crystalline core of a SiGe nanowire give the lowest possibleL, as an ultimate form of nanostructuring. In
order to understand nanoscale effects on phonon spectrum, dispersion, and interactions, as well as interfacial and alloy-ing effects, it is essential to model the dynamics at the ato-mistic level. We also model surface roughening through the control of the size of the simulation cell. We pursue the op-timization problem by expanding calculated thermal conduc-tivities in a basis of site-occupation variables and by per-forming optimization with genetic algorithm.
B. Extending the cluster-expansion technique to thermal conductivity
Cluster expansion,15 whereby properties are expanded in
terms of the distribution of atoms on a topology of sites, is a powerful technique for the optimization or ensemble averag-ing of properties. Its most common use is in the parametri-zation of total energy and derivatives thereof, although there have been extensions to other properties such as band gaps16
and, more recently, tensorial quantities.17The cluster
expan-sion of total energy has been used extensively, often with ab
initio calculations, to build effective Hamiltonians for the
prediction of thermodynamic18and kinetic properties.19 Un-like atomic potential models, which are rapidly evaluated but require extensive chemistry-dependent parametrization and are not universally available, or ab initio calculations, which are 共almost兲 universally available but are computationally intensive, the cluster-expansion approach is a widely appli-cable parametrization method which allows rapid evaluations for a large number of different atomic configurations. In ad-dition, the fitting parameters of the expansion, called effec-1098-0121/2010/81共17兲/174303共7兲 174303-1 ©2010 The American Physical Society
tive cluster interactions共ECIs兲, often give important physical insights on the system.
It is desirable to investigate the applicability of the cluster-expansion approach to properties of crystalline mate-rials not based on total energy, such as thermal conductivity. Since the evaluation of thermal conductivity is computation-ally intensive, even using classical molecular dynamics, the ability to parametrize the results for subsequent rapid evalu-ations would enable the otherwise prohibitive sampling of atomic configurations for optimization purposes. While the cluster expansion is formally exact with the inclusion of all possible clusters, in practice it is necessary to truncate the expansion to a finite number of clusters. Completely ac-counting for the contribution of a cluster of sites requires the determination of the ECI共s兲 not only for the given cluster but for all subclusters as well.20,21 Therefore, truncation of the
expansion generally leads to an inclusion of only short-ranged effects. In addition, it is not a priori clear whether thermal conductivity can be parametrized by local configu-rational variables alone.
The purpose of our work is hence twofold: to optimize atomic configurations in SiGe nanowires for low lattice ther-mal conductivityL and to evaluate the applicability of the
cluster-expansion technique for the optimization of L. Our
strategy is to determine the values of L for a test set of
atomic configurations using equilibrium MD simulations, use the cluster-expansion technique to allow rapid evaluation of Lfor any configuration, and thus predict structures with the
lowestLthrough genetic algorithm optimization. The
valid-ity of the technique is finally checked with the direct evalu-ation of Lof the predicted optimal structures using MD.
II. THERMAL CONDUCTIVITY FROM MOLECULAR DYNAMICS A. Computational procedures
We obtain, using equilibrium classical MD simulations, the thermal conductivity of Si1−xGex nanowires. The
nano-wires in our study are in the关111兴 orientation, have a circular cross section with a diameter of 1.5 nm, and have varying Ge concentration 共0.03⬍x⬍0.2兲 and Si/Ge configurations. The surfaces of the wire are not terminated by hydrogen atoms. Simulations are carried out at 300 K. An example of a simu-lation cell is shown in Fig.1.
TheXMDmolecular-dynamics program developed by Jon Rifkin,22 modified to output the heat flux for systems
incor-porating Si and Ge, was used to perform the MD simula-tions. Interactions were described by a bond order Tersoff potential23designed for C-Si-Ge systems that varies
chemi-cal bond strength according to the lochemi-cal coordination envi-ronment, given by
Vij= fc共rij兲关fr共rij兲 + bijfa共rij兲兴. 共1兲
Here fc is a smooth cutoff function, fr and fa are repulsive
and attractive pair potential terms, and the bond order term
bijis a function of the number of neighboring atoms as well
as bond angles and lengths. Upon initial NVT共constant par-ticle number N, volume V, and temperature T兲 equilibration,
NVE共constant N, V, and total energy E兲 simulations are
per-formed with a time step of 0.8 fs. The thermal conductivity for each nanowire along the axial direction 共z兲 was calcu-lated using the Kubo-Green formula
zz= V kBT2 lim t→⬁
冕
0 t 具Jz共t⬘
兲Jz共0兲典dt⬘
, 共2兲where J is the heat current.
B. Modeling the effects of surface roughness
It has been reported24that with simulation cells of length Lⱖ10 nm, the values ofLcomputed for thin, pure Si
nano-wires with ordered surfaces are as much as half that of bulk Si, in stark contrast to the 100 reduction in L from bulk
values for nanowires with amorphized surfaces. These com-putational results are consistent with experimental measure-ments on Si nanowires with smooth and roughened surfaces.14 We are interested in investigating further
reduc-tion in the lattice thermal conductivity due to Si/Ge configu-rations in nanowires with roughened surfaces. However, computations with simulation cells of Lⱖ10 nm and wires with roughened surfaces are extremely expensive.
In the interest of computational feasibility, we mimic the effect of surface roughness by using simulation cells of 2 nm long along the axial direction. Qualitatively, the effect of using small cell sizes is the same as that of surface rough-ness: long-wavelength phonons cannot and do not contribute to heat transport. To verify that 2 nm共short兲 simulation cells may reproduce 10 nm 共long兲 simulation cells with surface roughness, we compare the values ofLin pure Si nanowires
for short, pristine vs long simulation cells with and without surface roughness. Surface roughness is produced by adding silicon atoms on the surface in two regions of 2.5 nm, at intervals of 2.5 nm. In such regions we create a disordered monolayer of Si atoms by saturating 80% of the surface dan-gling bonds. The system is annealed at 1600 K and then gradually quenched to room temperature, so as to stabilize the newly generated structure. The whole annealing and quenching process lasts 1.5 ns and causes no structural modi-FIG. 1. 共Color online兲 An example SiGe nanowire simulation cell共side view兲. Red, larger spheres denote Ge while blue, smaller spheres denote Si.
CHAN et al. PHYSICAL REVIEW B 81, 174303共2010兲
fications either in the crystalline core of the nanowires or in the regions where the surface has not been modified. An example of the long simulation cells with surface roughness is shown in Fig. 2. We find that the value of L for short,
pristine simulation cell共4.1⫾0.3 W/m K兲 is much closer to that of the long simulation cell with surface roughness 共2.6⫾0.2 W/m K兲 than that of the long, pristine simulation cell 共50⫾7 W/m K兲. Therefore, we carry out the calcula-tion of L for nanowires with different SiGe configurations
using short, pristine simulation cells. Further verifications of the validity of this approach will be provided in Sec. V.
C. Summary of MD results
The calculated thermal conductivities of the 104 SiGe nanowires in the training set are shown in Fig.3. The train-ing set configurations are selected to cover a range of com-positions up to 22% Ge and provide a large variety in the distribution of Si and Ge atoms. For each configuration, the MD simulation is repeated several times and the standard deviation of the resultant L is taken as the uncertainty. In
general the uncertainties are larger with largerLand are on
average about 10% ofL. The calculated values ofLrange
from 0.55 to 3.0 W/m K, with a mean and standard deviation of 1.1 and 0.5 W/m K, respectively. For comparison, the measured values of L at 300 K are 9–25 W/m K for bulk
Si1−xGex alloys 共0.05⬍x⬍0.22兲,25 15–40 W/m K for 37–
115 nm diameter Si nanowire with smooth surfaces,10 and
1–8 W/m K for 50–150 nm diameter Si nanowires with roughened surfaces.14Figure4plots the values of
Lagainst
Ge composition for each configuration and it is clear that there is no strong dependence ofLon the concentration of
Ge. Therefore, the variation inLis due predominantly to the
Si/Ge configuration.
III. THERMAL-CONDUCTIVITY CLUSTER EXPANSION A. Traditional cluster expansion
A traditional cluster expansion15,17for a binary alloy is an
Ising-like model in which each site i in a lattice is assigned a value i=⫾1 depending on the occupying species.
Polyno-mials of iof all orders form a complete orthonormal basis
set in which to expand any configurational-dependent physi-cal quantity Q, i.e.,
Q =
兺
␣
V␣
冉
兿
i苸␣
i
冊
, 共3兲where the sum is over all possible distinct clusters of sites␣ and the coefficients of the expansion V␣ are fitting param-eters known as ECIs. In practice, the ECIs are obtained by fitting Eq. 共3兲 to the calculated values of Q 共e.g., by MD
simulations in the case of L兲 for a number of sample
con-figurations. The expansion can then be used to predict values of Q for any configuration. As mentioned, a cluster expan-sion is necessarily truncated to clusters of reasonably small order. Symmetry is used to reduce the number of ECIs.
B. Coarse-grained cluster expansion
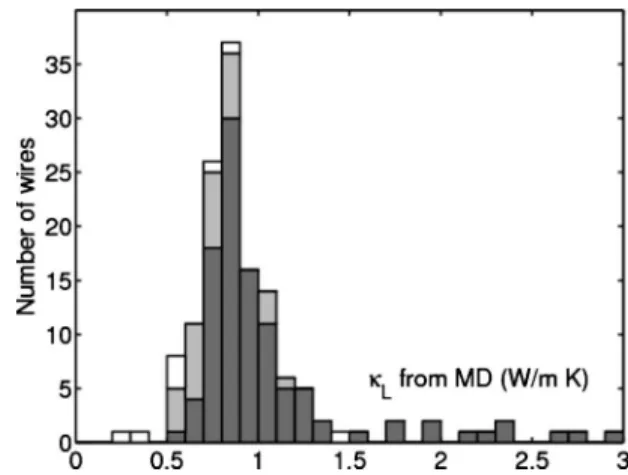
For both physical and practical reasons, we perform a coarse graining of the cluster expansion. Physically, it is ex-pected that clusters similar in location, size, and orientation would give a similar contribution to the thermal conductivity. Practically, we are limited by the number of relevant param-FIG. 2. Histogram of lattice thermal conductivity calculated
us-ing MD for the trainus-ing set of 104 nanowires with different Si/Ge configurations.
FIG. 3. Lattice thermal conductivity of nanowires with different Si/Ge configurations vs Ge composition. For SiGe nanowires in the training set, there is stronger dependence of L on configurations
within the same Ge composition range than on Ge composition.
(b) (a)
FIG. 4. Examples of clusters considered equivalent in the coarse-grained cluster expansion:共left, side view兲 two pair clusters that are both surface and along, and共right, end view兲 two triplet clusters that are both intermediate and across.
eters that can be extracted. The low symmetry in a nanowire leads to a large number of symmetrically inequivalent clus-ters and therefore a large number of ECIs 共V␣’s兲. Together with the inherent noise in the values ofLdue to the
stochas-tic nature of MD simulations, such a large number of param-eters leads to over-fitting and diminished predictive power of the cluster expansion. Recently, approaches have been devel-oped to deal with such low-symmetry situations by imposing nonuniform prior probability densities on the ECIs.26 We will, however, use a coarse-graining approach as described below.
1. Coarse-graining procedures
Coarse-graining procedures are performed to group physi-cally similar, but symmetriphysi-cally inequivalent, clusters 共points, pairs, and triplets兲 in the nanowire. All clusters in a group are considered equivalent in the coarse-grained cluster expansion and their ECIs have the same value. Equivalent clusters have共a兲 similar distance from the axis of the nano-wire and, for pairs and triplets only,共b兲 similar extents along the length of the nanowire. For classification 共a兲, clusters entirely within the inner 10% of the cross-sectional area of the nanowire are considered core, those entirely outside the inner 90% are considered surface, and the rest are considered
intermediate. For 共b兲, clusters contained in planes parallel/
nearly parallel to nanowire cross sections are considered
across while those in planes parallel/nearly parallel to the
nanowire axis are considered along, and all others are
oblique. The coarse-graining procedure gives, for the
simu-lation nanowires described in Sec. II, 40 coarse-grained point, pair, and triplet clusters, with a maximum spatial ex-tent of 4.5 Å. Figure 5shows examples of clusters that are considered equivalent in the coarse-graining procedure.
2. Fitting procedures
The ECIs in the coarse-grained cluster expansion are ob-tained by the following procedures: we expand the values of Lfor the N wires in the training set as
Ln=
兺
 V冓
兿
i苸␣ in冔
 ⬅兺
 V⌽n, 共4兲 where n = 1 , . . . , N,labels a coarse-grained cluster, and具·典 refers to average over all clusters ␣ coarse grained into .The ⌽n’s are then orthonormalized, i.e., Eq. 共4兲 is
trans-formed into Ln=
兺
⬘ V ˜ ⬘⌽˜⬘n, 共5兲where兺⬘⌽˜⬘m⌽˜⬘n=␦mn. Note that each
⬘
now representsa linear combination of coarse-grained clusters. The values of the transformed ECIs V˜⬘are obtained from least square fitting of Eq.共5兲. Unlike the ECIs in the cluster expansion of
total energy, which are expected to fall off as a function of distance, there is no a priori known behavior for the values of V˜⬘. In order to screen out irrelevant parameters, the least-square fit is repeated N times leaving one configuration out each time. For each 
⬘
, the value of V˜⬘ varies with each leave-one-out fit, with a mean V¯⬘ and standard deviation ⬘. A linear combination of clusters ⬘
is consideredirrel-evant and removed if兩V¯⬘兩⬍⬘. Roughly a quarter of the 40 ECIs 共corresponding to the 40 coarse-grained clusters de-scribed above兲 are removed by this approach. The fit is then redone with the remaining set of 
⬘
and the resultant V˜⬘ transformed to obtain the original ECIs V.3. Meta cluster expansion
Because of the noise inherent in the MD values ofL, it is
difficult to ascertain the accuracy of any set of ECIs from a single fit. Figure 6 shows an example of the values of L
predicted from coarse-grained cluster expansion关Eq. 共5兲兴 vs
those calculated from MD. In this fit, the root-mean-squared error is 0.13 W/m K and the cross-validation score is 0.16 W/m K. In light of such uncertainties, we record multiple sets of ECIs obtained from different leave-one-out fits and different fitting procedures 共e.g., different thresholds for choosing relevant linear combination of clusters 
⬘
, or dif-ferent subset of data by range of calculatedLvalues or Geconcentration兲. Instead of a single cluster expansion we ob-tained a group of expansions—a meta cluster expansion— with different sets of ECIs 兵V其, all of which are consistent with the given MD results, as measured by the root-mean-squared and cross-validation errors. For any configuration, there is a range of predicted values of Lfrom the different
FIG. 5. After performing the fitting procedures, the values ofL predicted from coarse-grained cluster expansion 关Eq. 共5兲兴 vs those
calculated from MD.
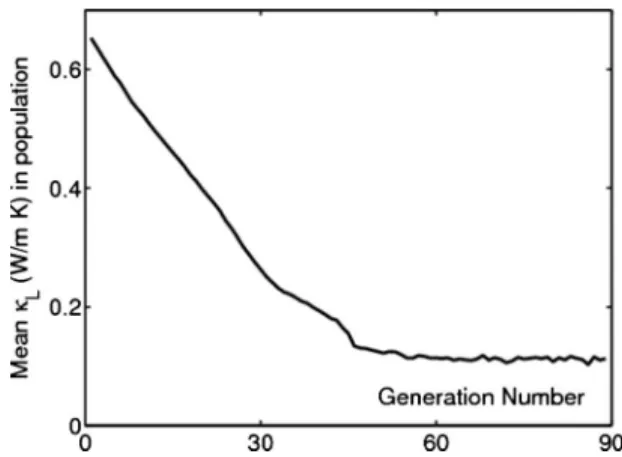
FIG. 6. Convergence of Lwith generation number in genetic algorithm optimization.
CHAN et al. PHYSICAL REVIEW B 81, 174303共2010兲
sets of ECIs in the meta cluster expansion, which are used together in the optimization procedure described below.
IV. THERMAL-CONDUCTIVITY PREDICTION AND OPTIMIZATION
A. Optimization by genetic algorithm
We use the thermal conductivity meta cluster expansion together with a genetic algorithm to evolve a trial population into configurations with optimal共lowest兲L. As in standard
genetic algorithm implementations, pairs of nanowires with different Si/Ge configurations are mated by joining lateral or cross-sectional halves of each parent and mutations are sto-chastically introduced to the resultant offspring. The fitness of each configuration, i.e.,Lwhere a lower value is
consid-ered more fit, is evaluated by the meta cluster expansion obtained in Sec.III. We require that the predicted values are robust, i.e., the different sets of ECIs in the meta cluster expansion predict consistent values of L, or else we
con-sider the prediction unreliable and the configuration is dis-carded. To determine the consistency of predicted values of L, we calculate the uncertainty in the predicted values based
on the uncertainties in V, which are in turn derived from ⬘. If the difference in two predicted values is larger than
the uncertainties added in quadrature, the predictions are not consistent. At each generation, the fittest configurations are kept and a random sample of the remainder added in to en-sure genetic diversity. Any exact duplicates are removed and the genetic algorithm optimization is carried out until con-vergence of the mean value of L among the wires in the
population is reached, which generally occurs within 100 generations. An example of the evolution of the mean value of Lwith generation number is shown in Fig.7.
It is important to note that while the meta cluster-expansion approach is able to predict low-Lstructures, the
predicted values ofLfor these structures are often
unphysi-cal, i.e., very close to zero or negative. The error in predicted values ofLcan be traced back to errors in the ECIs, which
in turn originate from the noise inherent in values of L
calculated from MD. Nonetheless, we use the meta cluster expansion and genetic algorithm optimization as a tool in finding optimal configurations rather than to predict precise values ofL. To check the effectiveness of this approach, we
use MD to obtain values ofLfor a selected sample of
pre-dicted low-Lconfigurations.
B. Predicted low-Lconfigurations
Figure8shows an example of a configuration predicted to have low L at the end of genetic algorithm optimization.
While one might expect disordered configurations to have lowerL, the meta cluster expansion and optimization
algo-rithm predicts otherwise. Many predicted low-L
configura-tions consist predominantly of Ge clusters of the across type, i.e., have almost complete planes of Ge perpendicular to the direction of the wire, instead of a randomized distribution. Such configurations are reminiscent of the Si/SiGe superlat-tice structures previously proposed,5albeit ones with
single-atomic layers of Ge rather than segments.
To check the validity of the cluster expansion, the pre-dicted low L configurations, as well as those with perfect
planes of Ge, are investigated using MD simulations. Figure
9 shows theLvalues of these configurations obtained from
MD as compared to those of the training set. Out of 28 configurations predicted to have low Lby the meta cluster
expansion and genetic algorithm optimization, one has L
lower than all configurations in the training set, 16 共57%兲 have L at or below the tenth percentile among the training
set, and 24共86%兲 are at or below the 50th percentile. There-fore, we can see that although the meta cluster expansion did not yield a particular configuration with drastically lowerL,
it is effective in constructing a population of low-L
configu-rations; this means that the expansion captures some physical factors governing configurational dependence of thermal conductivity. More remarkably, one of the superlatticelike configurations with complete planes of Ge共see Fig.10兲,
de-rived from idealizing the predicted configuration shown in Fig.8, is found to haveL= 0.23⫾0.05 W/m K, compared
to a minimum of 0.55 W/m K and a mean of 1.1 W/m K for FIG. 7. 共Color online兲 An example of a configuration found by
cluster expansion and genetic algorithm optimization and verified by MD to have lowL共side view兲.
FIG. 8. Histogram ofLcalculated with MD for共a兲 the original
training data共dark gray兲, 共b兲 predicted low-Lconfigurations from cluster expansion and genetic algorithm optimization 共light gray兲, and共c兲 configurations with perfect planes of Ge 共white兲.
the training set. The reason why this specific superlatticelike configuration with very low L was not obtained from the
genetic algorithm optimization may stem from noise in the ECIs or limitations of the optimization procedures. The fact that the superlatticelike configuration is so similar to a con-figuration predicted to have lowLconfirms that cluster
ex-pansion is a viable approach for the search of structures with optimal thermal conductivity.
V. SHORT-RANGE ORDERING FOR REDUCINGL
In this section we offer heuristic arguments for the mecha-nisms by which L is reduced and by which the
coarse-grained cluster expansion is able to predict low-L
configu-rations. We note the similarity of the values of L in two
cases: the ones computed with MD 共mean=1.1 W/m K兲 and those measured in 52-nm-diameter Si nanowires with surface roughness on the scale of several nanometers 共1.2⫾0.1 W/m K兲.14 In both cases, the
L values are near
or below the bulk amorphous minimum thermal conductivity limit,27 similar to what have been observed in other
nano-crystalline systems,28 despite unambiguous crystallinity. In
both cases, the values ofLare an order of magnitude lower
than in similar wires with longer-range order关longer simu-lation cells in MD 共Refs. 24 and 29兲 or smooth-surfaced
nanowires in measurements14兴.
A. Removing long-range order lowersL
In the case of our MD simulations, using 2-nm-long simu-lation cells excludes thermal transport by longer wavelength phonons; introducing longer-wavelength phonons by
increas-ing the simulation cells length to, e.g., 12 nm increasesLby
an order of magnitude. In a qualitatively similar fashion, in wires with rough surfaces,14 heat-carrying long-wavelength phonons are strongly suppressed by surface scattering and their contribution toLis greatly reduced, thus dramatically
lowering the thermal conductivity compared to long, pristine wires without surface disorder.
To verify that the suppression of long-range order is the key reason for the values of L we obtained for the SiGe
alloy nanowires and that the use of 2-nm-long 共short兲 simu-lation cells adequately capture the consequences of such a suppression, we compute L by the Kubo-Green approach
for 10-nm-long共long兲 simulation cells with and without sur-face roughness at ⬃2.5 nm intervals. The procedures for introducing surface roughness are as described in Sec. II B. We perform the simulations on SiGe alloy nanowires corre-sponding to the lowest thermal conductivities in the short simulation cells 共e.g., as shown in Figs. 8 and10兲. The
re-sults are summarized in Table I. We find, as previously reported,24and as in the case of pure Si nanowires described
in Sec.II B, that long cells with pristine surfaces have bulk-like thermal conductivity. We find also that long cells with surface roughness retain the same range of L as short cells
with pristine surfaces. The results are consistent with the postulate that removal of long-range order by using short simulation cells captures most of the effects of a roughened surface.
B. Cluster expansion allow for further optimization ofL
Given that low values ofLnear the amorphous limits are
likely achieved with the exclusion of long-wavelength phonons, it is reasonable that a coarse-grained cluster-expansion approach which includes only local ordering would be able to treat the effects of further variations in L
arising from atomic configurations. In fact, from TableI, we find that L has little or no configurational dependence for
long cells with pristine surfaces共the three values in column 2 are not significantly different兲 but has similar configurational dependence for long cells with roughened surfaces as for short cells 共columns 1 and 3 correlate兲. This result strongly FIG. 9. 共Color online兲 Superlatticelike configuration with the
lowest value ofLas computed by MD共side view兲.
FIG. 10. 共Color online兲 A 10-nm-long simulation cell with sur-face roughness at 2.5 nm intervals 共side view兲. The SiGe alloy configuration is superlatticelike as in Fig.9.
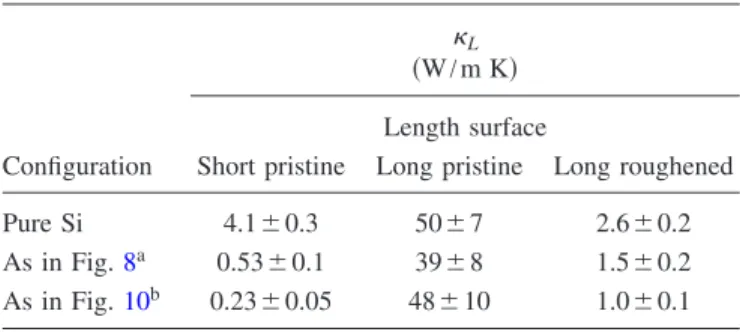
TABLE I. Comparison of L共W/m K兲 as obtained by MD for
nanowires with different SiGe configurations using short 共2 nm兲 simulation cells and long共10 nm兲 simulation cells with and without surface roughness.
Configuration
L
共W/m K兲 Length surface
Short pristine Long pristine Long roughened Pure Si 4.1⫾0.3 50⫾7 2.6⫾0.2 As in Fig.8a 0.53⫾0.1 39⫾8 1.5⫾0.2
As in Fig.10b 0.23⫾0.05 48⫾10 1.0⫾0.1 aA structure found by cluster expansion and genetic algorithm
op-timization to have a lowL.
bAn idealization of the above, with complete planes of Ge.
CHAN et al. PHYSICAL REVIEW B 81, 174303共2010兲
suggests that the local cluster-expansion approach is appli-cable for systems with reduced long-range order and that the physical effects of surface roughness can be adequately ap-proximated by the exclusion of long-wavelength phonons us-ing short simulation cells.
The precise mechanism for the configurational depen-dence ofLin SiGe nanowires with reduced long-range
or-der is not known. Fourier analysis of the heat flux and ex-plicit computation of the phonon modes and dispersion reveals persistent nonpropagating 共zero-velocity兲 modes at 1–4 THz. Further analysis of the contributions of coherent, phononlike vs incoherent, diffusive heat transport, as well as phonon lifetimes and phonon-phonon interactions are needed. Such analysis may also shed light on the reasons for the low values ofLfor structures with complete planes of
Ge.
VI. CONCLUSION
We demonstrate in this paper the feasibility of using the cluster-expansion technique to parametrize and optimize thermal conductivity. Compared to the total energy E, the computation of lattice thermal conductivityLis much more
expensive; therefore an efficient parametrization is highly
desirable. Yet the computation of L is also fraught with
more uncertainties than that of E, which makes such a pa-rametrization difficult. We find that instead of using a tradi-tional cluster expansion, in which each symmetrically in-equivalent cluster enters, a coarse-grained approach is effective; instead of using a single set of cluster-expansion parameters, a meta cluster-expansion approach can be adopted to take into account variations due to noise in the data as well as choice of fitting parameters. Using these ap-proaches, we are able to discover populations with generally lower L as well as configurations similar to those which
drastically lower thermal conductivity. We find that configu-rations with complete planes of Ge atoms have the lowestL
compared to other configurations. We find strong evidence that the lowLvalues obtained, close to the bulk amorphous
limit, are due to the absence of long-range order in the simu-lations and that such absence allows a local cluster-expansion approach to optimizeLin this low-Lregime.
ACKNOWLEDGMENTS
The authors acknowledge funding from DARPA-PROM program under Grant No. W911NF-06-1-0175. In addition, D. Donadio and G. Galli acknowledge funding from DOE SciDAC under Grant No. DEFC02-06ER25794.
1L. D. Hicks and M. S. Dresselhaus, Phys. Rev. B 47, 12727
共1993兲.
2L. D. Hicks and M. S. Dresselhaus, Phys. Rev. B 47, 16631
共1993兲.
3L. D. Hicks, T. C. Harman, X. Sun, and M. S. Dresselhaus,Phys.
Rev. B 53, R10493共1996兲.
4R. Venkatasubramanian, E. Siivola, T. Colpitts, and B. O’Quinn,
Nature共London兲 413, 597 共2001兲.
5Y. Wu, R. Fan, and P. Yang,Nano Lett. 2, 83共2002兲.
6J. P. Heremans, C. M. Thrush, D. T. Morelli, and M.-C. Wu,
Phys. Rev. Lett. 88, 216801共2002兲.
7B. Poudel, Q. Hao, Y. Ma, Y. Lan, A. Minnich, B. Yu, X. Yan, D.
Wang, A. Muto, D. Vashaee, X. Chen, J. Liu, M. S. Dresselhaus, G. Chen, and Z. Ren,Science 320, 634共2008兲.
8A. Abramson, W. C. Kim, S. Huxtable, H. Yan, Y. Wu, A.
Ma-jumdar, C.-L. Tien, and P. Yang,J. Microelectromech. Syst. 13, 505共2004兲.
9D. Cahill, K. Goodson, and A. Majumdar,ASME J. Heat
Trans-fer 124, 223共2002兲.
10D. Li, Y. Wu, P. Kim, L. Shi, P. Yang, and A. Majumdar,Appl.
Phys. Lett. 83, 2934共2003兲.
11CRC Handbook of Chemistry and Physics, 88th ed., edited by D.
R. Lide共CRC Press/Taylor & Francis, Boca Raton, FL, 2007兲.
12D. Li, Y. Wu, R. Fan, P. Yang, and A. Majumdar,Appl. Phys.
Lett. 83, 3186共2003兲.
13M. S. Dresselhaus, G. Chen, M. Y. Tang, R. G. Yang, H. Lee, D.
Z. Wang, Z. F. Ren, J. P. Fleurial, and P. Gogna, in Materials and Technologies for Direct Thermal-to-Electric Energy Con-version, MRS Symposia Proceedings No. 886 共Materials
Re-search Society, Warrendale, PA, 2005兲.
14A. I. Hochbaum, R. Chen, R. D. Delgado, W. Liang, E. C.
Gar-nett, M. Najarian, A. Majumdar, and P. Yang,Nature共London兲
451, 163共2008兲.
15J. M. Sanchez, F. Ducastelle, and D. Gratias,Physica A 128, 334
共1984兲.
16A. Franceschetti and A. Zunger, Nature 共London兲 402, 60
共1999兲.
17A. van de Walle,Nature Mater. 7, 455共2008兲.
18F. Zhou, T. Maxisch, and G. Ceder,Phys. Rev. Lett. 97, 155704
共2006兲.
19A. Van der Ven, G. Ceder, M. Asta, and P. D. Tepesch, Phys.
Rev. B 64, 184307共2001兲.
20M. H. F. Sluiter and Y. Kawazoe, Phys. Rev. B 71, 212201
共2005兲.
21N. A. Zarkevich and D. D. Johnson,Phys. Rev. Lett. 92, 255702
共2004兲.
22http://xmd.sourceforge.net/about.html 23J. Tersoff,Phys. Rev. B 37, 6991共1988兲.
24D. Donadio and G. Galli,Phys. Rev. Lett. 102, 195901共2009兲. 25B. Abeles,Phys. Rev. 131, 1906共1963兲, and references therein. 26T. Mueller and G. Ceder,Phys. Rev. B 80, 024103共2009兲. 27G. A. Slack, in Solid State Physics, edited by F. S. H. Ehrenreich
and D. Turnbull共Academic Press, New York, 1979兲, Vol. 34, p. 1.
28C. Chiritescu, D. G. Cahill, N. Nguyen, D. Johnson, A. Bodapati,
P. Keblinski, and P. Zschack,Science 315, 351共2007兲.