Publisher’s version / Version de l'éditeur:
Canadian Geotechnical Journal, 22, May 2, pp. 166-71, 1985-05-01
READ THESE TERMS AND CONDITIONS CAREFULLY BEFORE USING THIS WEBSITE. https://nrc-publications.canada.ca/eng/copyright
Vous avez des questions? Nous pouvons vous aider. Pour communiquer directement avec un auteur, consultez la première page de la revue dans laquelle son article a été publié afin de trouver ses coordonnées. Si vous n’arrivez pas à les repérer, communiquez avec nous à [email protected].
Questions? Contact the NRC Publications Archive team at
[email protected]. If you wish to email the authors directly, please see the first page of the publication for their contact information.
NRC Publications Archive
Archives des publications du CNRC
This publication could be one of several versions: author’s original, accepted manuscript or the publisher’s version. / La version de cette publication peut être l’une des suivantes : la version prépublication de l’auteur, la version acceptée du manuscrit ou la version de l’éditeur.
Access and use of this website and the material on it are subject to the Terms and Conditions set forth at
The temporal and spatial variation of snow pressure on structures
Larsen, J. O.; McClung, D. M.; Hansen, S. B.
https://publications-cnrc.canada.ca/fra/droits
L’accès à ce site Web et l’utilisation de son contenu sont assujettis aux conditions présentées dans le site LISEZ CES CONDITIONS ATTENTIVEMENT AVANT D’UTILISER CE SITE WEB.
NRC Publications Record / Notice d'Archives des publications de CNRC:
https://nrc-publications.canada.ca/eng/view/object/?id=00156539-c178-4103-a76a-4a59a3c07b78 https://publications-cnrc.canada.ca/fra/voir/objet/?id=00156539-c178-4103-a76a-4a59a3c07b78Ser
TH1 I
N21d
,
no.
1390
National Research
Conseil national
c. 2
1
Council Canada
de
mhercha Canada
BILDG
1
Institute for
lnstitut de
- -
Research in
recherche en
Construction
construction
The Temporal and Spatial Variation
of Snow Pressure on Structures
by J.O. Larsen, D.M. McClung and S.B. Hansen
Reprinted from
Canadian Geotechnical Journal
Vol.
22, No. 2, 1985
p. 166-171
(IRC Paper No. 1390)
Price $2.00
NRCC 26057
ANALYZEDnrrc
-
c mBLDG. RES.
L I B R A R Y
National Research Conseil national
I
+
Council Canada de recherches CanadaReprinted from
Canadian
Reimpression du
Geotechnical
Journal
canadienne
de
The temporal and spatial variation of
snow pressure on structures
Volume 22 Number 2 1985
Pages 166-171
The temporal and spatial variation of snow pressure on structures
JAN OTTO LARSENNorwegian Geotechnical Institute, P.O. Box 40 Taasen, 0801 Oslo 8 , Norway
DAVID M. MCCLUNG
National Research Council of Canada, 3904 West 4th Avenue, Vancouver, B.C., Canada V6R IP5 AND
SVEIN BORG HANSEN
Norwegian Geotechnical Institute, P . O . Box 40 Taasen, 0801 Oslo 8 , Nonvny
Received June 29, 1984 Accepted December 14, 1984
Measurements of snow creep pressure on an avalanche-defence structure in western Norway are presented. Two different types of measurement methods are described and evaluated. Pressure data from four winters are correlated with the following measured snowpack properties: density, snow depth, snowpack temperature, and snowpack stiffness. The results show that maximum and average pressures are strongly dependent on the product of density and snow depth as well as snowpack stiffness. The highest pressures were observed in spring prior to melting of the snowpack.
Key words: snow pressure, snowpack parameters, slope inclination, structures.
Des mesures de pression de fluage de la neige sur une structure pare-avalanches dans I'ouest de la Norvbge sont prCsentCes. Deux types difftrents de mkthodes de mesure sont prisentts et CvaluCs. Les donnCes de pression recueillies durant quatre hivers sont mise en corr6lation avec les propriCtts mesurCes du couvert de neige: densite, Cpaisseur de neige, tempCrature et rigiditt. Les rksultats montrent que les pressions moyenne et maximum dCpendent CnormCment du produit de la densitt par l'tpaisseur ainsi que de la rigidit6 du couvert de neige. Les pressions maxima ont CtC observCes au printemps, avant la fonte du couvert de neige.
Mots elks: pression de neige, parambtres du couvert de neige, inclinaison de la pente, structures.
[Traduit par la revue] Can. Geotech. J . 22, 166-171 (1985)
Introduction
Snow creep pressures are an important consideration in the design of structures placed on mountainsides subject to deep snow cover. Originally, avalanche-defence supporting struc- tures provided the motivation for the study of this problem. More recently, structures such as ski lift towers and power line masts have received attention. The simplest problem to analyse is prediction of pressures exerted at the centre section of a long supporting structure such that edge effects may be ignored. This two-dimensional treatment has been of interest for many years (Bader etal. 1939; Haefeli 1948; McClung 1976; Salm 1977). It is important to understand this two-dimensional problem thoroughly before attempting analysis of more-complex struc- tures in which three-dimensional considerations may be re- quired.
Measurements are described using two techniques: (1) construction of force, shear, and moment diagrams from strains measured in the steel beams of the structure and (2) direct estimates using pressure cells. Both of these methods are new in relation to snow pressure work.
Analyses of the pressure data in relation to measured snowpack characteristics provide descriptive information on the pressure distribution as the winter proceeds and the properties of the snow cover change. It is believed that this analysis gives information that will be useful in the formulation of a theoretical model of the action of snow on structures in mountainsides.
Description of field experiments
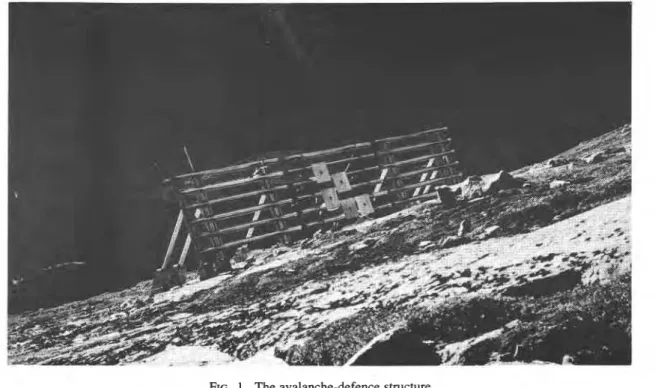
In the fall of 1975 an avalanche-defence supporting structure was erected on a slope with an average angle of 25" at an elevation of 1170 m in Grasdalen, Norway. A comparatively smooth rock surface was chosen to give a good foundation for
the structure, and because it provided a region upslope with nearly constant incline for a distance of approximately six times the expected maximum snow depth on the mountainside.
The supporting structure itself consists of three sections, each 5 m long and 3.4 m high (Fig. 1). The instrumented centre section is constructed of upright steel beams and horizontal cross pieces of aluminium. Measurements were taken from the centre section of the structure to eliminate the complexity due to shear forces and boundary effects towards the ends of the structure.
Vibrating-wire strain gauges (Geonor P-200) were mounted in pairs every 0.55 m on both sides of the upright steel beams, and at both ends of the support beams (Fig. 2). Results from these gauges are sufficient to enable construction of moment diagrams for the upright beams, and for calculation of the axial forces in the support beams. To provide accurate estimates of pressure it was found necessary to calibrate the beams in the field.
All the instruments were connected through a cable to a recording station 700 m away. This enabled the data to be read at any time. Observations were normally taken weekly. However, when the snow cover approached an isothermal condition, they were taken daily and sometimes more frequently.
The other measurement method consisted of pressure cells mounted in the centre of 0.8 x 0.8 m plates at the front of the structure. The cells are 0.11 m in diameter and contain Geonor P-100 vibrating-wire strain gauges. For the 1975-1976 winter one pressure cell was located 0.8 m above the ground surface. For later winters five pressure cells were mounted at different heights on the structure (Fig. 1).
The pressure cells do not always produce satisfactory results. When the snowpack is dry, the cells produce values comparable
LARSEN ET AL. 167
FIG. 1 . The avalanche-defence structure.
-.-
r-----
---- ,
r'..---- ----.a- ----.a. a----
---
bdiurnal variations. m e estimated pressures can approach zero during theday and then rise to unreasonably high values at night during periods of refreezing. Larsen (1982) provides examples of such data. It is suggested that these results correspond with thawing a d fmezhg on the pressure plates. Because of the
many comp1ications, the pressure cell data were not used in the analysis.
Estimated p s u r e s were related to snowpack properties by taking snow pzoiiles and snow depth measurements at intervals of approximately 1 month throughout the winter. The snow profile observations consisted of density, temperature, ram- sonde hardness measurements through snow cover, snow crystal type and moisture content. Average values of these properties were obtained at the location of the structure as well as in the area upslope within the zone in which the structure is expected to influence the snow cover.
Glide or slip of the snow cover over the ground was estimated by measuring the displacement of glide shoes upslope from the structure. Periodic readings showed that there was negligible glide at the site.
Calculation of snow pressures from strain gauge data
Since the strain gauges were mounted in pairs it was possible to calculate moments and axial forces given the modulus of the steel beams and support members. The moment diagrams for the beams and axial forces for the support members then enabled the construction of shear force and load diagrams that were compatible with the measured strains. From this information two pressure diagrams were determined, one for each main upright beam of the centre section of the structure. The pressures were determined by averaging these two diagrams.
Some sources of error influence the results: (i) eccentric connection between the steel beams and supporters; (ii) shear forces acting perpendicular to the ground in the snow-wall interface; and (iii) shear forces at the top of a buried structure. In the determination of the moment diagrams it has been possible to correct for the eccentric connection between the steel beams and supporters as the axial forces in the supporters were measured. It has been more difficult to eliminate the inaccuracy caused by the other factors.
Description of snow pressure results
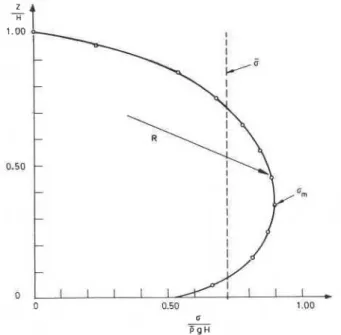
The strain gauge data from the beams provide reliable results throughout the winter whenever there is enough snow to produce mean pressures in excess of about 5 kPa. For the early part of the winter when the snowpack is shallow, there is normally not sufficient loading to bend the steel beams of the structure enough to provide reliable stress data from the strain gauges. This effect also accounted for the loss of data from three complete winters that were characterized by shallow snowpacks. The analysis of the strain gauge data provides information about the distribution of pressure as well as the average pressure, maximum pressure, and position of the resultant force on the structure as the winter proceeds. Figure 3 shows typical results calculated from 1981-05-1 1. The average pressure, u ,
maximum pressure, om, and the resultant, R , are identified. The resultant is depicted as perpendicular to the snow-structure interface because the load has been assumed to act normal to the structure. In reality, the resultant will act at an acute angle to the
0 5 10 15 20 u ( k P o 1 PRESSURE
FIG. 3. Snow creep pressure estimated for 198 1-05-1 1.
FIG. 4. Pressure distribution calculated from a plane-strain finite element analysis.
snow-structure interface that depends upon snow properties and boundary conditions.
As a hypothetical example of the way the resultant may behave, Fig. 4 shows a pressure distribution calculated from a planestrain finite element analysis. The assumptions are "no slip" on the structure-snow interface, no glide on the ground, and a constant average density. The snow was assumed to deform as a linear compressible Newtonian viscous fluid, with the static fluid pressure term neglected. For the calculations for Fig. 4 the ratio of shear to bulk viscosity was defined by assuming a viscous analog of Poisson's ratio equal to 0.25.
LARSEN ET AL.
r
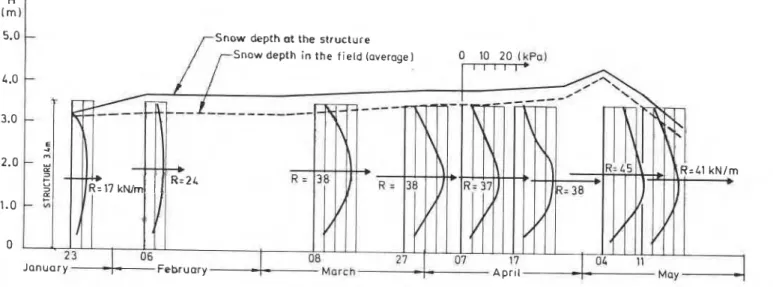
Snow depth at the structureFIG. 5. Snow creep pressure on the supporting structure during the winter 1981.
data with continuum models are discussed by McClung et al. (1984).
Figure 4 shows that, given the assumptions, the resultant is approximately in the middle portion of the snowpack, inclined downward at an angle of 24" from the normal to the structure. This analysis is merely illustrative because the modelling chosen for the snow deformation is highly simplified.
Figure 5 gives an example of typical pressure distributions during a winter. This shows that the resultant acts near mid-depth of the snowpack when the snow depth does not exceed the structure height. If the snow depth exceeds the struc- ture height the resultant acts slightly above mid-depth of the structure. As the snowpack becomes wet and dense in spring, the resultant force appears to act lower on the structure. Figure 5
also shows that significant shear Forces develop at h e top of the
structure for those later cases. Larsen (1982) gives similar data for the years 1976 and 1979.
The location of the maximum pressure is close to the location of the resultant during the course of the winter, that is, about the mid-depth of the snowpack, and has a value that increases with snow depth and density. The snow pressure increased through- out the winter and seemed to reach the highest values just before the snowpack became wet (Fig. 5 and Table I). This appeared usually in the beginning of May when the snow depth and density also were at the maximum. The stiffness of the snowpack seemed to increase parallel with the snow pressure throughout the winter, but decreased quickly when the tempera- ture rose to zero.
Statistical analysis of snow pressure results
For the statistical analysis, three indices of snowpack properties have been defined from snow profile data. The body force index, R , is given as p g H (in kPa) where
0
is depth- averaged snow density, g is acceleration due to gravity, and H is snow depth measured perpendicular to the snow-rock intehce. The stiffness index, S, is defined as the total energy (kJ) required to drive a ramsonde through the snowpack. An index of snowpack temperature, T , was defined as the temperature ("C)at mid-depth in the snowpack. Table 1 gives the measured values of these indices as well as estimated values of average pressure, 6 , and maximum pressure, a,, for six years of data
TABLE 1. Snow creep pressures and snowpack parameters Date H (m) T ("C) PgH (kPa) S(kJ) a, (kPa) 6 (kPa)
1976
-
1982-
02-17 1.8 -3.8 5.9 1.2 7 4 03-05 2.1 -3.0 7.0 0.7 7 4 03-25 1.7 -3.0 6.2 1.4 7 4 04-07 2.1 -0.4 7.2 0.9 8 6 04-14 2.2 -1.0 7.3 1.1 8 6 05-09 2.3 0 8.9 1.3 9 6NOTE: H = snow depth measured perpendicular to ground surface; p =
average density; S = stiffness index = total energy to drive a ramsonde through the snowpack; g = acceleration due to gravity; T = temperature at mid-depth in the snowpack; om = maximum snow pressure; 13 = average snow pressure.
170 CAN. GEOTECH. J. VOL. 22, 1985
J A N F E B MARCH A P R I L MAY FIG. 6. Variations in snow pressure with snowpack parameters. from 1976- 1982. No values were obtained for 1977, 1978, and
1980 owing to insufficient snow depth.
Figure 6 depicts the relationship between snow pressure and measured snowpack properties for the winter of 198 1. Regres- sion analysis has been carried out to estimate the correlation between the snow pressures and the body force index, B, and stiffness index, S.
It is expected that the equations in the regression analysis which follows will change as more data become available. However, it is felt that there are enough data in Table 1 to illustrate the trends between snow pressure variation and snowpack properties.
Linear regression analysis
Linear regression analysis for all of the data in Table 1 gave the following predictive equations (where
2
is the correlation coefficient squared and SD is the standard deviation of the residuals):where B is expressed in kPa and S in ki.
This analysis shows that a, and 6 are nearly linear with B, but they do not correlate as well with S. Polynomial regression analyses were also erformed with respect to B and
a
S including terms as high as B and S4 without significant improvement in the correlation coefficient or standard deviation of the residuals.*
I k Pal
3
ul
,"
FIG. 8. Average pressure as a function of the body force index B.
Power law regression analysis
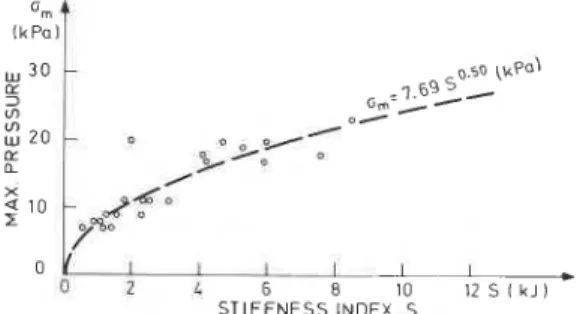
Power law regression analysis gave the following relation- ships:
These equations show that power law regression analysis does not provide a better prediction than the linear analysis for B, but there is an improvement with respect to S, and it can be concluded that pressures are approximately proportional to
a.
In regard to both average pressure and maximum pressure it was found by a multiple regression analysis that T in linear combination with B, S, or
f i
singly or together did not improve the correlation for either the linear or the power law regression analysis.Figures 7- 10 depict the data from Table 1 along with the best single-variable predictive equations from the regression an- alyses ([I], P I , [61, and 181).
Motivated by the similarity of the dependence of a, and 6 on
fi,
a multiple regression analysis was performed for a, and 6as functions of
f i
and B. This analysis gave the following equation:[91 a, = 1.00B
+
1 . 7 2 f i - 1.45 Kpa;r 2 = 0.95; SD = 1.2 kPa
which indicates that addition of
a
as a variable improves the prediction of a,.A
similar analysis with respect to 6 did not, however, result in a better equation for 6.There appears to be a correlation between body force index, B, and the stiffness index, S. The power law regression analysis gave the expression
LARSEN ET AL. 171
U 2 L 6 8 10 1 2 S f k J l
STIFFNESS INDEX, S
FIG. 9. Maximum pressure as a function of the stiffness index S.
STIFFNESS INDEX, S
FIG. 10. Average pressure as a function of the stiffness index S.
The correlation coefficient for linear regression of In S with respect to T was -0.12. Combining T with B did not improve the correlation.
Conclusions
Conclusions from the experiments and analysis presented are as follows:
(1) Of the two experimental methods used to determine snow pressure, the one in which load diagrams are constructed from the values of strain measured in the beams of the structure is preferred. It gives an accurate estimate of the average pressure and pressure distribution with depth.
(2) Analysis of the data shows that the resultant force on the structure acts near the mid-depth of the snowpack when the snow depth is less than or equal to the height of the structure. If the snow depth exceeds the structure height, the resultant force acts above the mid-height.
(3) Regression analysis of the data shows that the average pressure, 6, and the maximum pressure, a,, can be approxi- mated by linear functions of body force index, B (= pgH),
and square root of stiffness index,
fi
( S = total energy to drive a ramsonde through the snowpack). Power law regression of the snowpack data alone showed that S a B with r2 = 0.73 ( r =correlation coefficient). The data show little or no dependence of a, and 6 on T (temperature in mid-height of the snowpack). (4) The maximum values of average pressure and maximum pressure normally occurred in late spring (around the first of May) at the observation site. This is at the time when B is a
maximum. Since the maximum value in the pressure distribu- tion also appears to be affected by the snowpack stiffness, it is possible that highest pressures could be expected when B is highest and before the stiffness is decreased by warming temperatures and melting of the snowpack.
Discussion
Determining pressure diagrams from measurements of strains in the steel beams of the structure is laborious and does not provide a unique picture of the pressure distribution. The advantage of the method is that it provides an accurate measurement of the average pressure under any snowpack water content condition and a fairly reliable descriptive picture of variations in snow pressure with time and snowpack properties. The proposed dependence of snow pressure on the snowpack indices should be applied with caution. It is expected that the equations might well change as more data become available. In addition, these results may be highly dependent on the nature of the snowpack. The snowpack at the observation site is deep and normally remains cold throughout the winter. This is considered to be typical of the high alpine zones of a maritime snow climate. Experience shows that cold, thin snowpacks in continental snow climates are not nearly as stiff as the one studied here, and snow pressure characteristics may differ considerably.
Acknowledgements
We are grateful to K. Kristensen, Norwegian Geotechnical Institute (NGI), for assistance with the fieldwork. Partial funding was provided by the Norwegian Water Power and Electricity Board (NVE), and we are thankful for this support. This paper is a joint contribution of the Norwegian Geotech- nical Institute and the National Research Council of Canada and is published with the approval of the directors of these institutions.
BADER, H., HAEFELI, R., BUCHER, E., NEHERER, J., ECKEL, O.,
THAMS, C., and NIGGLI, P. 1939. Der Schnee und seine Metamor- phose, Beitrage zur Geologie der Schweiz. Geotechnische Serie,
Hydrologic, Lief 3 (German, English translation, U.S. Snow, Ice and Permafrost Establishment, Trans. 14, 1954).
HAEFELI, R. 1948. Schnee, Lawinen, Firn und Gletscher. In Ingenieur- Geologie. Edited by L. Bendel. Springer-Verlag, Vienna, pp. 663-735.
LARSEN, J. 0 . 1982. Snaens sigetrykk mot konstruksjoner i bratt terreng. Report No. 75420/58110-1. Norges Geotekniske Institutt, Oslo, Norway.
MCCLUNG, D. M. 1976. Snow pressure on rigid obstacles. Journal of Glaciology, 17(76), pp. 277-285.
MCCLUNG, D. M., LARSEN, J. O., and HANSEN, S. B. 1984. Comparison of snow pressure measurements and theoretical predic- tions. Canadian Geotechnical Journal, 21(2), pp. 250-258. SALM, B. 1977. Snow forces. Journal of Glaciology, 19(80), pp.
T h i s paper i s being d i s t r i b u t e d i n r e p r i n t form by t h e I n s t i t u t e f o r Research i n C o n s t r u c t i o n . A l i s t of b u i l d i n g p r a c t i c e and r e s e a r c h p u b l i c a t i o n s a v a i l a b l e from t h e I n s t i t u t e may be o b t a i n e d by w r i t i n g t o t h e P u b l i c a t i o n s S e c t i o n , I n s t i t u t e f o r Research i n C o n s t r u c t i o n , N a t i o n a l Research C o u n c i l o f C a n a d a , O t t a w a , O n t a r i o ,