Publisher’s version / Version de l'éditeur:
ASTM Special Technical Publication, 740, pp. 164-179, 1981
READ THESE TERMS AND CONDITIONS CAREFULLY BEFORE USING THIS WEBSITE.
https://nrc-publications.canada.ca/eng/copyright
Vous avez des questions? Nous pouvons vous aider. Pour communiquer directement avec un auteur, consultez la première page de la revue dans laquelle son article a été publié afin de trouver ses coordonnées. Si vous n’arrivez pas à les repérer, communiquez avec nous à [email protected].
Questions? Contact the NRC Publications Archive team at
[email protected]. If you wish to email the authors directly, please see the first page of the publication for their contact information.
Archives des publications du CNRC
This publication could be one of several versions: author’s original, accepted manuscript or the publisher’s version. / La version de cette publication peut être l’une des suivantes : la version prépublication de l’auteur, la version acceptée du manuscrit ou la version de l’éditeur.
Access and use of this website and the material on it are subject to the Terms and Conditions set forth at
A servo system for controlled stress path tests
Law, K. T.
https://publications-cnrc.canada.ca/fra/droits
L’accès à ce site Web et l’utilisation de son contenu sont assujettis aux conditions présentées dans le site LISEZ CES CONDITIONS ATTENTIVEMENT AVANT D’UTILISER CE SITE WEB.
NRC Publications Record / Notice d'Archives des publications de CNRC:
https://nrc-publications.canada.ca/eng/view/object/?id=6f529520-b94d-432e-85bd-cb6726b9e911 https://publications-cnrc.canada.ca/fra/voir/objet/?id=6f529520-b94d-432e-85bd-cb6726b9e911Conseil national d e r e c h e r c h e s d u Canada S er
'
TH1
N21d no.989-
c . 2 1 BDFA SERVO SYSTEM FOR CONTROLLED STRESS PATH TESTS by K.T. Law
Reprinted f r o m
A m e r i c a n Society f o r Testing and M a t e r i a l s Special Technical Publication 740, 1981 p. 164
-
179DBR P a p e r No. 989
Division of Building R e s e a r c h
Dans le present article, on dScrit un servo-mScanisme
capable d'imposer une trajectoire d6terminee aux contraintes, lors de
l'etude du comportement des sols au laboratoire. On a examin6
diverses conditions: 1) des trajectoires des contraintes semblables
5 celles observEes in situ, 2) le cisaillement produit par des deformations axiales et des dCformations biaxiales, 3) 1'6tat crde par une importante d6formation ou l'etat succ6dant P la rupture (ou h 1'6coulement).
Le servo-mecanisme est constitu6 de deux parties principales:
un mini-ordinateur et un transducteur Blectrique-pneumatique (E/P). Le mini-ordinateur recueille et traite les donn6es pendant le d6roulement
de l'experience. Les signaux electriques appropries sont transmis au
transducteur E / P , qui r6gularise la pression imposge 5 la conduite de contre-pression de l'appareil de mesure des d6formations biaxiales ou
triaxiales. Lorsque la charge axiale est appliquee 1 vitesse de deformation constante, il est possible de mesurer dans sa totalit6 le
comportement contrainte-diSformation, m8me lors de d8formations 6lev8esY le long d'une trajectoire predbtermin&e des contraintes.
On a r6alisB une s6rie d'essais pour illustrer les possibillttgs du servo-m6canisme. Dans le cas particulier de l'analyse de la stabiLitE des pentes, on a effectue une autre s6rie d'essais, qui ont permis
Path Tests
REFERENCE: Law, K. T.. "A !Servo System for Controlled Stress Path Tests," Labomtory Shear Strength of Soil, ASTM STP 740, R. N. Yong and F. C. Townsend, Eds., American Society for Testing and Materials, 1981, pp. 164-179.
ABSTRACT: This paper describes a servo system capable of imposing a prescribed stress path for the study of soil behavior in the laboratory. Various conditions were examined: (I) stress paths resembling those in the field, (2) both axisymmetric and plane strain shear- ing. and (3) large strain or post failure (or yield) state.
The sew0 system is corn@ of two main parts: A m m i m p u t e r and an etectric- pneumatic (E/P) transducer. The minicompuim collects and processes data while the ex-
periment is in progress. The appropriate electrical signals are transmitted to the E/P
transducer. which wgulates the pressure connected to the back-pressure line of the triaxial or plane strain apparatus. With the axial load appfied at a constant strain rate, kt is possi- b k to measure the mmplete stress-strain behavior, including that at large strains, along a
prescribed stress path.
A series of tests was carried out to illustrate the capability of the servo system. For the particular case of slope stability analysis, another series of tests was conducted from which peak and post-peak strength envelopes were obtained.
KEY WORDS: servo system, computerized soil tests, controlled stress paths, triaxial tests, plane strain tests, strength envelopes, peak, post peak
Prediction of soil behavior under load is an essential requirement of engi- neering design. One way to improve such prediction is to examine the behavior of the soil by various test methods that yield results applicable under field conditions.
The stress path involved in shearing soils is an important factor influencing
soil behavior and is receiving growing attention. A stress path, a line drawn
through points on a stress plot, denotes the sequence of stress changes ex- perienced by a soil element during the shearing process. Under field situations
it starts from the point representing the in situ stress condition and proceeds to
other points, as dictated by the type of structure being considered and the geometry and characteristics of the entire subsoil. The effects of stress path
'Research Officer, National Research Council of Canada, Ottawa, Ontario, Canada.
were recognized as early ax I948 when Taylor
[/I2
pointed out the likelihood of being able to obtain the correct strength by reconsolidating soil specimens in the laboratory to the in situ pressures. Bozozuk and Leonards 121 and Bjemm[31 provided evidence that such reconsolidated specimens do yield more consis-
tent information than unconsolidated ones far estimating soil behavior under the fading condition. Fol towing reconsolidation, shearing along different
stress paths produces vatying effects on different aspects of soil behavior. The general experience 14-61 has been that stress paths do not greatly influence cohesion (c
'1
or the angle of internal friction(9');
on the other hand [7-91,they strongly affect the deformational characteristics. Based on the second observation, Lambe [10,11] formulated the stress path method for solving deformation problems.
A number of methods have been used for shearing soils under a controlled stress path condition. Some have used the triaxial cell with minor modifica- tions [12-141. Others 115-17) have employed a special apparatus designed and built to test certain soil types. The above test equipment, however, per- mits only one mode of shearing; that is, incremental loading or controlled stress loading. It is not possible to shear soil specimens under a controlled strain rate condition as is required for study of rate effect and the post-peak stress-strain relation for a brittle soil. The equipment described in Ref 16 can impose constant strain rqte shearing, but the control of stress path is lost. With computer technology it is now possible to build a system that is capable of controlling the stress path under controlled strain rate conditions in the shearing of soil specimens. Such a system is described herein.
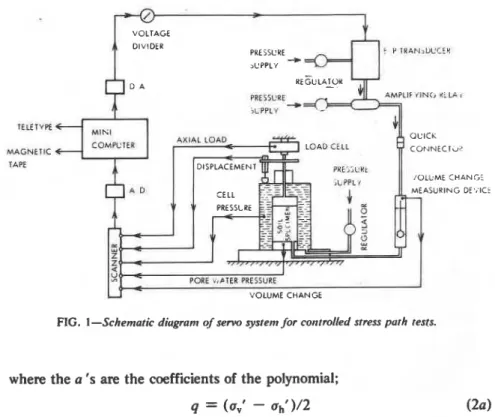
Description of Apparatus
Figure 1 is a schematic diagram of the complete apparatus. Basically it consists of a servo system and a loading cell (triaxial or plane strain). The servo system is composed of two main parts: a minicomputer and an electric- pneumatic
(E/P)
transducer. Figure 2 shows a plane strain test conducted using the servo system.Operation Principle
The principle of operation of the servo system can be illustrated by means
of a constant strain rate test conducted along the stress path represented by a 1
fourth-degree polynomial: I
IELEIYR
MAGNETIC TAPE
I
VOLTAGEf
PRESSURE AMPLIF <IN<, *.LA I
1
PORE '<,ATE# PRESSURE
J
VOLUME CHANGE
FIG. I-Schematic diugrant of servo systent for controlled stress puth tests.
where the a ' s are the coefficients of the polynomial;
p' = (a,'
+
ahf)/2 (2b)and a,' and ah' are the vertical and horizontal effective stresses.
In a compression test a,' and ah' are the major and minor effective prin- cipal stresses al' and a3', respectively; while in an extension test, they are 03'
and a, ', respectively. Definingp ' and q in terms of a, ' and oh ' instead of a, '
and a3' gives a sign convention to q that is positive in compression shearing and negative in extension shearing.
By assigning appropriate values for the coefficients in Eq 1, curved and linear stress paths can be applied to soil specimens. Some examples of com- pression and extension tests are shown in Table 1.
The application of q on the soil specimen is achieved by straining the soil specimen at a constant rate on the load press. The horizontal effective stress,
ah ', is applied using the servo system in such a way that p ' and q closely satisfy Eq 1. In the present test system ah ' is equal to the difference between the cell and the back pressures. While the cell pressure is kept constant, the back pressure is regulated by the servo system to produce the appropriate ah
'.
This procedure eliminates the need to correct for any load applied to the piston as a result of cell pressure changes. The back pressure regulation will also affecta,' (a,' = 29
+
ah') and hence p', resulting in an actual stress path some- what different from the prescribed one (Fig. 3). The allowable deviation E be-1 . Load cell 2. Displacement transducer 3. Rotating bushing 4. Piston 5. Electric/pneumatic transducer 6. Volume change tramduccr 7. Plane strain cell 8. Hanger for anisotropic consolidation 9. Specimen 10. u2-transducer I I . Pressure amplifying relay 12. Back-pressure
line 13. Load press 14. Cell pressure line FIG. 2-A cottrrolled stress puth plutte struitt test.
tween the stress paths, however, can be reduced to a tolerable value to be given in a later section.
The complete task of regulating ah ' in accordance with Eq 1 involves three steps: ( I ) monitoring responses, (2) processing data, and (3) changing the back pressure.
Response Monitoring
Electrical transducers (Figs. 1 and 2) are used to monitor load, pressure, axial displacement, and volume change during the experiment. These quan- tities, measured in terms of voltage, are transmitted through an ana- logue/digital (A/D) converter to the minicomputer for processing. A load cell far more rigid than the soil specimen is used to remove possible problems arising from loading system flexibility, particularly when measuring post-
0 9 a 0 0 0 B M m 0 0.3 8 0
-
9 S d A k+
-
0=
'o 9 9 9 9- -
- -
A A 0.-
-
e
"E
.
-
" aZ g
-
c-
C C U a d s c-
-
-.-
e
ad
d
8 g E-9
C f9 E E E-
" .- E .-.-
w-
z at; .g u u X r c c .m 2 2 2 a a a "3 s h e .--- -
P R E S C R l U f D-
A C T U A L / , / P ' ' t q l-
FIG. 3-Rescribed utrd uctuul stress puths irr u corrtmlled stress puth test urrder coirsturtt struirr rute.
peak behavior. This load cell can take compressive and tensile loads so that both compression and extension tests can be carried out. The cell and back pressures are registered using pressure transducers of the unbonded strain gage type. Both transducers yield values of absolute pressure and the effect of barometric pressure changes is cancelled out because ah ' is equal to the dif- ference in back and cell pressures. The axial displacement is recorded by means of a direct-current differential transformer (DCDT) transducer, the volume change by a float-displacement instrument as described by Mitchell and Bum 118).
Minicomputer
The minicomputer performs two main tasks: ( I ) data acquisition and pro- cessing, and (2) transmission of a pertinent electrical signal to the E/P transducer. Raw experimental data are accepted at a certain frequency con- trolled by a variable to be fed into the computer. Engineering quantities such as stress and strain are computed following the standard method 1121. Values of p ' and q are deduced using Eqs 2a and 2b.These engineering quantities are displayed on a teletype or stored on a magnetic tape. Substituting q in Eq
1 yields the theoretical value p, ' required to follow the prescribed stress path. The difference between p ' and p , ' is evaluated and compared with the
allowable limits
f
6 . If the difference exceeds the limits, a numerical incre- ment [ is added to or subtracted from the current number being sent through the digital/analogue (D/A) converter to the E/P transducer. Consequently, the pressure from the E/P transducer to the back-pressure line will be modi- fied in accordance with the change in the current number. As the checkingfor deviation from the prescribed stress path and the subsequent pressure modification (if necessary) are done sufficiently frequently, it is not necessary for the E/P transducer to behave linearly. This has proved to be very useful because usual problems such as nonlinearity, hysteresis, or minute drifting in characteristics will impose no effect on the overall performance of the servo system.
Electric-Pneumatic Transducer
The E/P transducer, also shown schematically in Fig. 1, is a device that regulates pressure in proportion to the voltage it receives. A voltage divider is installed between the D/A converter and the E/P transducer to reduce the voltage to an acceptable range. The basic E/P transducer delivers a pressure ranging from 20 to 100 kPa, and for practical purposes a pressure-amplifying relay is used to expand it to 80 to 400 kPa. The basic device and the relay are each supplied by a constant pressure about 30 kPa higher than the respective maximum output pressures. That from the relay is the back pressure sup- plied to the soil specimen via a quick connector, which facilitates switching the servo system from one shearing apparatus to another.
At present three E/P transducers have been installed. Three controlled stress path tests can therefore be run at the same time, along with seven con- ventional triaxial or plane strain tests, all linked to the minicomputer.
Operation Frequency and Other Parameters
The operation of the servo system may be performed at a frequency of up to once per second. Between operations, the voltage on the E/P transducer and hence the back pressure remain at the level of the last operation. The minicomputer and the E/P transducer use an a-c power of 105 to 125 V at 50 to 60 Hz, and both are equipped with standby batteries that immediately cut in and maintain operation in the event of power failure.
The frequency of operation, allowable deviation 6 , and numerical incre- ment
E
(which controls the size of change in ah ') are all adjustable, depending on the behavior of the soil specimen during shear. By adjusting them to- gether the prescribed stress path can be closely followed. In testing Leda clay, for instance, the specimen responds relatively rapidly in the early part of the test and the following have been found adequate:frequency 1 operation/30 s
allowable diviation e 0.25 kPa
size of back pressure change 0.3 kPa
At the later stage of testing the frequency may be reduced to once every 1 to 5
Test Description and Results
Two test series were conducted: ( I ) to illustrate the capability of the servo system in soil testing. and (2) to obtain strength envelopes for stiff Champlain Sea clay for natural slope stability considerations. The majority of tests in the first series were carried out along linear stress paths, although curved ones were also possible by assigning appropriate values to the coeffi- cients of the polynomial (Eq I).
All specimens were trimmed from 127-mm-diameter Osterberg samples and were enclosed in thin Ramses rubber membranes; all were 80 mm high and 36 mm in diameter for triaxial tests, and 36 by 36 mm in cross section for plane strain tests. Side drains were provided and a strain rate of 3.5 percent axial strain per day (calculated by the method of Bishop and Henkel [12]) was used to allow adequate pore pressure equalization within the specimen.
A Geonor triaxial cell with a rotating bushing to reduce piston friction was employed in the triaxial compression and extension tests. Specimen prepara- tion and mounting were identical to preparation for an ordinary triaxial test. No cell modification was required in the compression tests, but some ac- cessories were made for the extension tests.
The arrangement for triaxial extension tests is shown schematically in Fig.
4. Fastened to the piston is a circular plate on which weights are placed to balance the cell pressure acting on the piston. The piston is screwed to the top stainless steel loading platen for application of pulling force. After con- solidation, a coupling is mounted to connect the load cell to the piston, and shear can be started by lowering the load press at a constant rate. The coup- ling is designed to allow for possible small misalignment between the piston and the load cell. A correction of 0.75 kg is made in the data processing to account for the top platen weight and extension of the rubber membrane.
The cell for performing plane strain tests has been described in detail by Bozozuk [ 1 9 ] . It is similar in principle to the triaxial cell except that provi- sions are made to maintain zero strain in the intermediate principal stress direction. This is done by mounting in the cell two side blocks that can be brought into contact with the specimen. Load cells are installed at the end of the blocks for measuring the intermediate principal stress during the test. Again, anisotropic consolidation can be applied, but only plane strain com- pression tests are possible.
Anisotropic consolidation can be applied by different methods (Fig. 5).
For vertical consolidation pressure exceeding the horizontal, the standard Geonor hanger system (Fig. 5A) may be used, but it requires frequent ad- justments to keep the arm of the hanger level. It is simpler to put appropriate weights on the piston (Fig. 5B) in addition to those for balancing cell pressure. For horizontal pressure greater than the vertical. the position of the Geonor hanger system is modified (Fig. 5C) so that a pulling force can be in-
-
L O A D CELL
+d
R O T A T I N G
STAINLESS
FIG. 4-Awurrgenrerrt.for rriuxiuf exterrsio~r tests.
troduced to the piston. This method again necessitates frequent adjustment of the hanger arm. A simpler method is to take away appropriate weights from the pistons (Fig.
5D)
already in use for balancing cell pressure. (It should be noted that there is one advantage in using the hanger system: larger loads can be more easily applied because of the moment arm ratio.)The tests in the first series for illustrating the capability of the servo system are summarized in Table 1, and the corresponding stress paths are shown in Fig. 6. Except for Test 8, all tests were conducted on a stiff, fissured, and brittle Champlain Sea clay from Rockcliffe, Ottawa, Canada. Its moisture content ranged from 65 to 70 percent; other detailed characteristics have been given by Mitchell [20]. In Tests 1, 4, and 6, the consolidation ratio K of the horizontal to vertical consolidation pressures was assigned a value greater or less than 1.0, with a subsequent shearing across thepl-axis.,This resulted in a reversal of shear stress direction or a 90-deg rotation in principal stress. Anisotropic behavior can be studied and it is possible to simulate, in the laboratory, the stress paths corresponding to situations such as building em- bankments on soft clays and cutting slopes in stiff clays.
LAW ON SERVO SYSTEM FOR STRESS PATH TESTS 173
----
P L A N E S T R A I N-
I R I A X I A LFIG. 6-Exurnples of srress purhs corrducted by nreurrs o f t h e servo s.vstenz.
Test 7 is a plane strain test with the vertical stress held constant. It is ap- plicable to a long vertical cut, either standing freely or supported by a retain- ing structure that allows the active pressure to develop.
Test 2 is a constant ,a I compression test; Tests 3 and 4 are constant stress
ratio tests in both the compression and extension stress space. All are useful for studying the fundamental behavior of the clay.
Typical pl-q plots for triaxial and plane strain tests (Tests 5 and 6) are shown in Fig. 7. They are computer plots showing the entire stress path realized during the tests. Deviation from the prescribed stress path is negligi- ble so that the objective of controlling the stress path is achieved. The same is also true of all the other tests listed in Table 1.
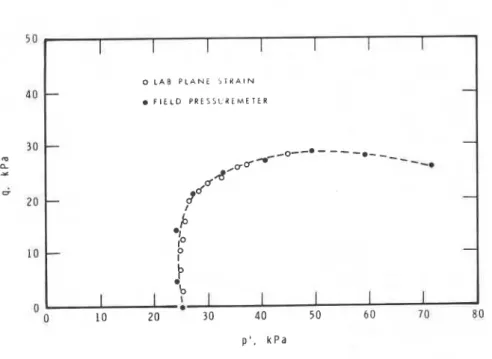
Test 8 involved a nonlinear stress path and was performed on an undis- turbed, soft, sensitive marine clay (its properties have been given by Bozozuk and Leonards [ 2 ] ) . This test was designed for studying the in situ behavior of clay subjected to a self-boring pressuremeter test, as described by Eden and Law [21]. The nonlinear stress path (Fig. 8) was deduced from the in situ test for the soil at the pressuremeter-soil interface, where the strains, radial pres- sures, and pore pressures were monitored by means of electronic transduc- ers. In the laboratory the soil specimen was trimmed horizontally and mounted in the cell in such a way that plane strain condition was maintained in the original in situ vertical direction, as was true also in the pressuremeter test. After consolidation, appropriate values were assigned to the coefficients
FIG. 7-Tvpicul stress purhs Jurirrg tests.
in Eq 1, causing the subsequent shear to follow the nonlinear stress patn (Fig. 8). Figure 9 shows the stress-strain and volume change-strain curves for the laboratory test (Test 8). A significant volume change was found to take place. Although it is not possible to measure volume change during a pressuremeter test, the laboratory test indicates that shearing along the observed effective stress path involved some drainage. This is in contrast with the usual assumption of undrained shear for this in situ test. The deduced pressuremeter strength will therefore be generally higher than the undrained strength and will yield an unsafe design if used directly for some engineering applications.
The second test series was also carried out on Rockcliffe clay. Plane strain and triaxial tests were conducted in a relatively low stress range, in which most natural slope failures occur. Various stress paths were used to simulate those possible in the field [22]. All specimens were sheared to a large strain (about 8 percent) for observing post-peak behavior.
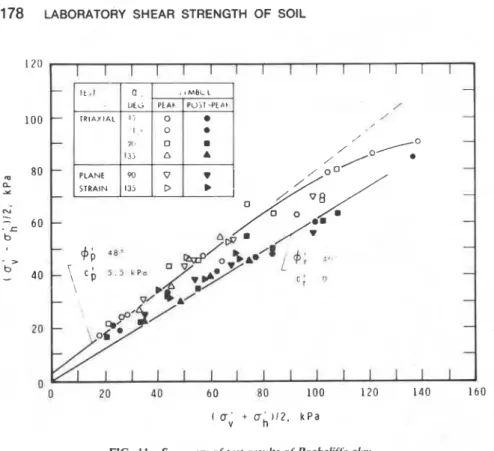
Typical stress-strain and volume change-strain curves for triaxial and plane strain tests conducted at constant p ' are shown in Fig. 10. Dilatancy exists around the peak strength, which is followed by a drop to post-peak strength. The peak and post-peak values for all the tests are presented on a p '-q plot in Fig. 11. Two distinct strength envelopes can be obtained, one for peak and the other for post-peak. They do not appear to depend on the stress paths or on the mode of straining, plane strain, or axisymmetric strain. For natural slope stability considerations they can be characterized by
6,'
= 48 deg, c,' = 5.5 kPa&'
= 40 deg, cr ' = 0 kPa0 L A B P L A N E S T R A I N
-
-
4 F I E L D P R E S S L R E M E T E R-
-
-4--0--m---
-m-- -
4 . ~ b--.
-
fU
-
b
41 lo-
P
-
1
I
I b l
I
II
-
0 10 2 0 3 0 4 0 50 6 0 70 K O p ' , k P aFIG. 8-Effective stress putlrs /or Itrhoruron~ crrrd,field pressrtrerrrc,trr tests.
I
I I I I I i-
-
- 0/
/4,*.
-
2
-
fl
1
AXlAL STRAIN. %-
r" I 2 3 4 5 -0-0-d. I I I I 0 . O\ 0, O x 0-
' 0-
1 V O L U M E I N C R E A S E 0' \o-
1
\o-
I II
I IFIG. 9-Shrur stress-uxirl srrcrirr trrrd ~~olrrr~ietric strtrirr-trxitrl srrctirr rrlcrrir~rrs tlrrrirrg crrr~zd stress puth test urrdrr plcrrre strtrirr co~rdiriorr.
LAW ON SERVO SYSTEM FOR STRESS PATH TESTS 177
A X I A L S T R A I N , %
FIG. 10-Typicul stress-srruirr u ~ r d volunie change-struirt curves.
I I I I I I I I I
-
-
P L A N E S T R A I N T E S T
-
p ' 9 8 k P awhere 4 ' and c ' are the angle of internal friction and cohesion in terms of ef- fective stresses, respectively; and subscripts f and r refer to peak and post- peak stages.
- 1 I
I
I
Summary and Conclusions
/-',
\
'\\[
T R l A X l A L T E S T
p ' 8 3 k P o
A description is given of a servo system for shearing soil specimens along
linear or curved effective stress paths, as defined by a fourth-degree polyno-
1
---
\----__
I I I-
I r-
-
-
I
I
I
t
l
!
t
l
l
J--
--,-,----
-
1 1 1 1 1 1 1 1 1-FIG. I I - S t r r ~ t n t u ~ of test rvsulfs of R(wkcli[f~ cluy.
mial. The servo system comprises a minicomputer and an electric-pneumatic transducer. It can be conveniently connected to the conventional triaxial and plane strain cells in such a way that compression and extension tests can be performed at constant strain rate under the axisymmetric or plane strain mode of straining. Tests on a stiff Champlain Sea clay yielded the following observations:
1. The stress paths realized closely followed the given paths.
2. The post-peak stress-strain relation was determined for this brittle clay along various stress paths.
3. Peak and post-peak strength envelopes were obtained for natural slope stability considerations. These envelopes are independent of stress paths and modes of straining.
Acknowledgments
The author expresses his appreciation to D. C. MacMillan, Technical Of-
ficer, for suggestions during the design of the servo system and for writing the computer program in assembly language for use in the minicomputer. This
paper is a contribution from the Division of Building Research, National Re- search Council of Canada, and is published with the approval of the Director of the Division.
I l ] Taylor. D. W.. Furrdunaerrruls of Soil Mechortics. Wiley. New York, 1948.
121 Bozozuk. M. and Leonards. G. A. in Auceedirrgs. Specialty Conference on Performance of
Earth and Earth-Supported Structures. Purdue University, Lafayette, Ind.. 1972, Vol. I, Part 1. pp. 299-317.
I31 Bjermm. L. in hceedirrgs. Eighth lnternational Conference on Soil Mechanics and Foun-
dation Engineering. Moscow. Vol. 3. 1973. pp. 111-159.
141 Henkel. D. J . in Auceedirrgs. American Society of Civil Engineers Research Conference on
Shear Strength of Cohesive Soils. University of Colorado. Boulder. Colo.. 1960, pp. 533- 554.
151 Lade. P. V. and Duncan. I. M.. Jourrrul of the Geotechaicul Errgirreerittg Divisiort. Pro-
ceedirrgs. American Society of Civil Engineers. Vol. 102, No. GTI, 1976, pp. 51-68.
161 Olson. R. E.. Geotechrrique. Vol. 12. No. 1. 1962, pp. 23-43.
[ a
Campanella. R. G. and Vaid. Y . P. in Auceedirrgs, Eighth International Conference onSoil Mechanics and Foundation Engineering. Moscow. Vol. I. Part 1. 1973. pp. 85-92.
181 Simons. N. E. in hxeedirrgs. Roscoe Memorial Symposium. Cambridge University, 1971,
pp. 241 -252.
191 Yudhbir and Mathur. S. K. in Auceedirrgs. Ninth lnternational Conference on Soil Me-
chanics and Foundation Engineering. Tokyo, Vol. 1. 1977, pp. 353-356.
1/01 Lambe. T. W.. Jourr~ul o j the Soil Mechurrics utrd Four~dutiotrs Divisiort
.
hceedirrgs,American Society of Civil Engineers. Vol. 90. SM5. 1964. pp. 43-68.
1111 Lambe. T. W., Jourr~ul of the Soil Mechurrics urrd Four~d~tiotrs Divisiort, Proceedi~zgs.
American Society of Civil Engineers, Vol. 93. SM6. 1%7. pp. 309-332.
1\21 Bishop. A. W. and Henkel. D. I.. The Meusuremerrt of Soilhperties irt the Tricrxiul Test,
2nd ed.. Edward Arnold Lid., London. 1962, 219 p.
1/31 Ladd. C. C. and Varallyay, J.. "The Influence of Stress System on the Behavior of Satu- rated Clays During Undrained Shear," Research Report R65-11. Massachusetts Institute of Technology. Cambridge, Mass., Department of Civil Engineering. 1965.
1\41 Wong, P. K- K. and Mitchell, R. J., Georechrtique, Vol. 25. No. 4. 1975, pp. 763-782.
I151 KO. H-Y. and Scott, R. F., Geotechnique. Vol. 17, No. 1. 1967, pp. 40-57.
1/61 Bishop. A. W. and Wesley, L. D., Geotechnique, Vol. 25, No. 4. 1975. pp. 657-670.
( 1 4 Wong. P. K. K., "Strength and Stress-Strain Relations of a Sensitive Clay." Ph.D thesis. "Queen's University, Kingston. Ont.. Can., Department of Civil Engineering, 1972.
1/81 Mitchell. R. J. and Bum, K. N., Cunudiorr GeotechnicalJourrral. Vol. 8, No. 2. 1971. pp. 34-345.
1/91 Bozozuk. M.. "The Gloucester Test Fill," Ph.D thesis, Purdue University, Lafayette, In- diana. 1972.
1201 Mitchell, R. J.. Cunudiarz GeotechrriculJourrrol. Vol. 7, No. 3. 1970, pp. 297-312.
121) Eden. W. J. and Law. K. T.. Cur,odion Geotechtzicul Journal, Vol. 17. No. 3, 1980, pp. 369-381.
Canada. It should not be reproduced in whole or in part without permiamion of the original publisher. The Di- vision would be glad to be of assistance in obtaining such permission.
Publications af the Mviaion may be obtained by mail- ing the appropriate remittance (a Bank, Express. or Post Office Money Order, or a cheque, made payable to the Receiver General of Canada. credit NRC) to the NationalResearch Council of Canada. Ottawa. KIA. OR6. Stamps a r e not acceptable.
A list of all publications of the Division is available and may be obtained from the Publications Section, Division
of Building Research. National Research Council of