Publisher’s version / Version de l'éditeur:
Engineering Journal, pp. 3-7, 1963-07-01
READ THESE TERMS AND CONDITIONS CAREFULLY BEFORE USING THIS WEBSITE. https://nrc-publications.canada.ca/eng/copyright
Vous avez des questions? Nous pouvons vous aider. Pour communiquer directement avec un auteur, consultez la première page de la revue dans laquelle son article a été publié afin de trouver ses coordonnées. Si vous n’arrivez pas à les repérer, communiquez avec nous à [email protected].
Questions? Contact the NRC Publications Archive team at
[email protected]. If you wish to email the authors directly, please see the first page of the publication for their contact information.
NRC Publications Archive
Archives des publications du CNRC
This publication could be one of several versions: author’s original, accepted manuscript or the publisher’s version. / La version de cette publication peut être l’une des suivantes : la version prépublication de l’auteur, la version acceptée du manuscrit ou la version de l’éditeur.
Access and use of this website and the material on it are subject to the Terms and Conditions set forth at
Probability charts for predicting ice thickness
Williams, G. P.
https://publications-cnrc.canada.ca/fra/droits
L’accès à ce site Web et l’utilisation de son contenu sont assujettis aux conditions présentées dans le site LISEZ CES CONDITIONS ATTENTIVEMENT AVANT D’UTILISER CE SITE WEB.
NRC Publications Record / Notice d'Archives des publications de CNRC:
https://nrc-publications.canada.ca/eng/view/object/?id=79aed560-1fc3-49f6-aeb8-8116aa487477
https://publications-cnrc.canada.ca/fra/voir/objet/?id=79aed560-1fc3-49f6-aeb8-8116aa487477
no.
190
c .
2BLDG
NATIONAL
RESEARCH
COUNCIL
C A N A D A
DIVISIC)N O F BUILDING RESEARCH
PROBABILITY CHARTS
FOR PREDICT1
G . P. Williams M.E.I.c.,
Research Officer, Snow and Ice Section,
Division of Building Research, National Research Council of Canada, O t t a w a
R E S E A R C H PAPER NO. 190 O F T H E
DIVISION O F BUILDING RESEARCH
lieprinted from the Et~gii~eeriizg Jolrrtlol, J111le l!)(i3 The Jour~lal of the E l ~ g i ~ ~ r c r i ~ l g lllslitutc of C:;~n;~da
P R I C E 10 C E N T S
OTTAWA
JULY 1963
PROBABILITY CHARTS FOR P
TlFJG
16E
TI#IICI(NESS
.
G. P. Williams M.E.I.c., Research Officer, Snow and Icc Section,
Division of Building Research, National Research Council of Canada, O t t a w a
I
N RECENT YEARS there Iias bccn an increase in availalde informa- tion on tlie thickness of ice covers at various sites in North America. In 1953 Curriel made a s t ~ l d y of ice tliickness and snowfall for the Prairie Provinces and the Northwest Territo- ries; in 1954 Ryder2 co~npiled ice tliic~kiicss ~cc-orcls i l l tlie Nortl1c:rnIIc~rii.\pllcrc lor tlic A~~ieiicali (:c:o- grapliical Society; a ~ i t l during the wintcr of 1958-59 tlie Meteorological Branch of the Department of Trans- port established a continuing program of weekly ice thick~icss measurements on bodies of water adjacent to sel- ected meteorological statio~is in Can- ada3.
Tliere are a nrimbcr of rcasons for this rccent increase. i l l ice tl~ickness
observations. Empirical and tlieoreti- cal stridies havc sliown that tlie bear- iiig c;1pacity of :in ice cover is pro- portional to the square of the ice thickness4. Before tlic Ilearing capa- city of an ice slieet can be estimatctl, tli(~roforc. tlic tliick~icss must be mcas- rlred or estimated. Ice tliickness rec- ords arc also required by engineers for predicting possible ice prcssrire against dams and for consideration in designing water supply intakes where the solirce of supply is a frozen lake, river or harbour. A record of expcctctl ice tliickness is uscfr~l also to hytlrol- ogists concerned with river run-off or the prc(lic1ion of tlie amount of i1.c: tli;it \\fill I,c ~ n c l t c d during tlie spri~lg brclak-up of lakcs and rivers.
T h e most satisfactory method of ob- taining illformation or1 ice tliickrless is Ily routine mc;isrircmcnt of ice ~liick- ness for a nriml~er of years at a nrirn- 1,er of sites. In C;~natla, with its tliou- sands of lakes, rivers and haibours frozen for many m o ~ i t h s of tlie year, however, it will always be difficult to have ari adecluate nurnl~cr of thesc ice observation stations. Oftcn it \\fill I)e necessary to estimate ice thickness at sitcs several hundrcd miles away from the ~learcst ice o I ~ s ~ r v ; i t i o ~ i stalioii.
from ice thickness obscrv. ,I t' 1011s ~ i o w availal~le in North America are pre- scntctl. ?'hese cliarts provide informa- tion on tlie probable rate of increase of ice thickness during the ice growth periotl and the probable maxim~im thickness that will b e attained under
;t wide variety of site contlitions in
No1 t l i Amctric,n.
Formation of Natural Ice Covors , 1
.
o :~l)prcciatc tlic limitations ofprollability charts or more elaborate mctl~ods for pretlicting ice thickness it is necessary to understand the various \\lavs an ice cover can form. As several authors have described the formation and development of natural ice covers i l l leta ail"*^, only a brief
outline \\rill be given in this paper. Under normal coritlitioris there is a teinperat~ire gradient in the ice cover. Heat flow along this gradieiit leads to ail i~icrcase in the thickiicss of the cover Ily the formation of ice at the intr1f;ice between the ice and water. If tlic ic-c is thin and the air tem- peratlire much below freezing, the temperatrlre gradient and associated heat flow will b e relatively large and
a rapid increase in ice thickness will resiilt. As the ice cover i n c r e a s s in tliickncss the temperature gradient usually decreases and the ice g r o w s a t a progressively slower rate. Fre- quently, die average air temperathre tlecreases at the same time and partly offsets the effect of increasing ice tl~ickness on tlie temperature gradient. If l l ~ c r c is ail iiisulatilig Iaycr of s i ~ o w 011 t l ~ e ice cover it will retluce
tlic: tenipcralure gratlieiit through tlie ice ant1 t l ~ c late of growth will de- crease accordingly. If the snow cover is deep enough, the temperature at the ice-snow interface can b e very close to 32°F and ice growth will b e negligible. As tlie insulating value of
.
s ~ i o w can be as much as ten times that of ice, depe~iding on its density, S I ~ O \ Y cover on tlie ice has an import-. ant ilifluence oil the rate at which all ice cover thickens.Ice docs not always grow down- ward from its lower surface. If tlie snow cover is heavy enough the upper sri~face of the ice can be tlcpresscd beneatli the hydrostatic water level so that water is forced u p through holes : ~ n d cracks and floods the sur-
d-?
U ~ i d c r tllcsc circrimst;inc~cs it is usu:iI to esti~nate ice tliick~ic~ss iisi~ig formr~lac that rcl;itc ice gro\vth to mcleorologic;~l fnc.tors. 111 Illis ]xipisr a11 ;~ll(~r~iati\~c! ~ i ~ i ~ l l ~ o c l of ])~xs(li(sti~~p, icx: lllic:kl~c~ss :illd ].at(. of gro:\ltl~ is
Analysis Procedure
I I ' i i ~I i:; corn ,
~;II;III\VI>. Ii111t~ ~!i:;l)l:~c,(.~~:L 111 i i : t 1 1 ~
0
2
5
'10
2 0 4 0 6 0 8 0 9 0PERCENT OF
.TIMEG R O W T H
R A T E
ISEXCEEDED
S I T E S W I T H I C E2
A
ALL
REGIONS SHALLOWICE
C O V E R
ALL
-
FRESHW A T E R
LAKES A N D RIVERS REGIONS3&4
V A R Y I N G
R A N G E
-
OFICE
0
THICKNESS2
5
10
20
40
6 080
9 0PERCENT OF
T l M E G R O W T H R A T E
ISE X C E E D E D
8
2
5
10
20
40
6 080
9 0PERCENT
OF
TIME
G R O W T H
RATE ISEXCEEDED
I
40' AND GREATER- SALT-WATER HARBOURS REGIONS5 8 6
V A R Y I N G
R A N G E
OF I C E '
THICKNESSFig. 2-Ice growth rates plotted as probobility curves for different regions in North America
plots showing lhe cffcct of snow t l c p ~ h on ice-growth rates. Pro1):lbility c.urvcs 11:ivc been prcpnrctl showing ice-gro\\lth rates wit11 sllow covcr dcpths less than 2 i l l . ant1 6 in. or
morc for all s t n t i o ~ ~ s wllcrc s ~ l o w tlcptll nz:ls rccordrd.
1;igllrc On sllo\vs that tllc nvcrugc ratc of ice gro\\411 with sllow covc:r lcss
~ I I ; I I I
'7 ill., for ice tl~icknc~ssc~s froln 0 to 20 ill., is from '7 to '7.5 ( ~ I I I ( ' S ;IS great as ll'lat- w11o11 Lllc cl(~pt11 of s ~ r o w cxcectls 6 i l l . T h e limitctl rc:cortls avnilal)lc for analysis illtlic:tl(.:tl tl1;lt the rate of sen-icc growtll \\J;I.s 1ligllc.r t1la11 111:lt of f~.c.sh-wnlcr ic.c: for 111c.sc:sult of tllc lower hcnt of fusion of sea-ice.
1:igrlrc 3 b shows tllnt for nn ice tllick~lcss range of 20 to 4 0 i l l , the
nvcrag': ralc of ice g r o w t l ~ \\rill1 snow cover less ll1:111 2 in. is more than lwicc the g r o w t l ~ r;llc \\,ill1 :I snow covcr 6 ill. tl(:c:p or g r ( ~ ~ t c , r .
111 lliis ; ~ ~ l a l y s i s of t l ~ c cffcct of s ~ l o w c.o\,cl. on ice-gro\\,ll~ r ; ~ ( c s a t It~:lst 11lrlY: c;lscs \vc:rc l l O L ( ~ t 1 \vllcl~c
1 1 1 ~ ic(:-gro\vtl~ r:11(: \V:IS cxlr(~111t;ly Iligl~ a l t h o ~ ~ g l ~ snow covcr \vns elocl).
,
.
1l1c:sc \vcrc, not ~~sc:tl i l l prcpnring
Pigs. O:t :111tl 31). 'Tl11: gro\\,tl~ r;~tc*s ( i l l tllc~sc: c;~sc*s) v:~rics(l I'l.oln S to 10
tlcr 90 ill. 1)urillg tllcsc pcriotls of r;lpitl g r o w t l ~ tllc: rc~l~ortctl tlcplll of s ~ i o w tlccrcasctl fl-on1 I 0 to G i l l . or
I(:ss. It wo11lt1 ;q)pc:nr t l ~ n t thcsc icc- g ~ . o \ v t l ~ rate : ~ r l o ~ ~ ~ : ~ l i c . s \\,arc, rc1:llctl to
\ v l l i t ( ! ic.c: or " s ~ ~ o w icc:" formntioll. 11' 111c:tcorologic:11 collditiolly u ~ c Iligl~ly f;~vor:ll~I(: for ice growtll, pnr- tic.r~lilrly \vllcn ll~c: ice: covcr is t l ~ i n , I:u.gc: r i ~ t c s of icc growth can prol~nbly o c c ~ ~ r (111ring one or t\vo-tlny pcriotls. It is 11111ik(:ly tllnt se~c,h c:x~rcnit! (>on- t l i t i o ~ ~ s \ v o ~ ~ l t l ( Y ) I I ~ ~ I I I I ~ for t\vo \\,ccks. ,
.
Ill(: prol);~l)ility c~u.vc:s s l ~ o w ~ l on Jigs.
9 :~ntl 3, lI~c~.c.forc:, give llic nvc,r;lgc: r ~ l ~ l ) ( ' r ; l l l ( l
I ~ \ v c ~ .
li~nits of icc-gi.owtl,r;~tc,s th;lt ran I)c cxpcctcd fol two- \vc,rk pcriotls. It \\ro~.~ltl I)e cxpcctetl 111:lt t 1 1 ~ tlc\~i:~liolls on citllrr sitlc of
I l l ( : 50%) (in)(! l i ~ ~ c : sl~olrltl corrc:l;~tc
\viIl~ 1111; ( I ( v i ; ~ l i o ~ ~ of (]I(! ; I ( % I I I ~ I nvt:r- i~g(! \ v ( - : ~ t l ~ r r for tli(: l)(:rio(l fl.0111 111c
c:liun~tologic~;~l :~vcl.:~gc:. ~ J I ~ ~ O I . ~ I I I I : ~ L ( : I ~ , lllc nun1l)cr o l ice ~l~ickoc!ss rc!ci)rtls
:~v:lil:tl)le wns not srlfficic~lt to chcck this Il!~potl~esis.
Use of Probability C h a r t s t o Predict Ice-Growth Rates
1'rol)nl)ilily charts arc b:lscd on ob- sc:rv;~liolls t:tkon from tllc timc: ice first starts to form ulltil mnximllm ice tl~ickllcss is clc\~elopctl ant1 are vnlitl for this l)crio(l only. With thcsc cll:~rt.s the 1)rol)ablc s:lte of ice growth and ice tllickncss can I)c cstimntctl at n site : ~ t a n y timc d11sing this icc growth 1x:riotl.
If. for example, the ic-c cover on a frcsll-w:~tcr 1:tkc is 6 i l l . thick, and I 6
in. is rcrl~lirctl for :I givcw lo:~tl, Ilow l o ~ l g \\:ill it t;lke for the thickncss to incrc,;lso from G to tllc rcquirctl 16 in.? 1"rom Fig. 21) olle c:un say tllnt
50% of thc timc tllc ire covrr \\iill
gro\v ; ~ t n rate of
5
i11./14 (lays. T l l ~ ~ so n the uvcragc it \\fill tnkc f o u l \vci:ks to incrcasc 1 0 in. in thickncss. If, Ilo\vcvcr, tllcrc is tlcep sllo\v on thc icx: ant1 tllc: w o : ~ t l ~ c r is rclnti\rcly lniltl tllo growth ].ate could be as low as
2
i11./13 tlnys (90% of time). Convcr- srly, if tllc ;lir tcmpcrnt~lre is below norll~nl (luring this prriotl nnd thcrc is I I O s ~ l o w covcr tile gro\\,th rate c , o ~ ~ l t l
I)(:
as high ns 1 0 in./l.L days or gl.c;~tc>r (10% of timc:), ;111tl tllq rc- cluil.c>tl g ~ - o \ \ j t l ~ \ \ ~ o ~ ~ l d occur in two\ \ ~ ( V ~ ~ S .
I1 is c : ~ i t l ( ~ l ~ t t11:lt the rntc of'icc gro\vl11 C Y I I I ir:1ry \vi(l(~l!~, (lc,p(!~ltli~~g
0 1 1 s11ow e ~ \ ~ c ~ i . nl~tl \vc~ntl~or. co~ltli-
tiolls. \\'ill1 lllc ;lit1 of p:lst ~vc~utllc~r ~oc~orcls : ~ ~ l t l ~)rctlictctl \vcnthrr c!o~ldi- l i o ~ ~ s , all ol)sc:r\rcr call l x ~ t limils on
t l l ( ! (~xl)t~cltYl r;lI(, of icc gro\i,lll nll(1
i w t l ~ i c ~ k ~ ~ ( ~ s s ol)t;li~)cs(l I'ronl 111c: pro-
l ) ; t I i i l i ~ \ . t.11i11.t~
;III(I
I I I ; I ~ ( > o l ) ( ~ r ; ~ t i o ~ l ; l l ~ l ( . c . i \ i ~ ~ ~ ~ s I ) ; ~ s c ~ l 011 illis i ~ ~ l ' o r ~ i ~ : ~ l i o ~ ~ .RATE
OF ICE GROWTH
( 1 ~ . / 1 4
DAYS)
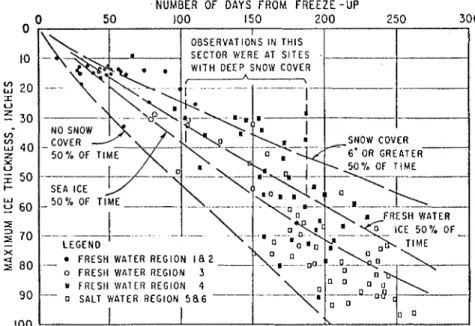
f r o ~ n frcczc-r~p to the timc (if ~ n ~ x i - mum i t r tl~ick~lcss. 'I'llc o1)sc~rvrtl vnlucs la11 wi~llin the limits obtair~ed
3
A
REGIONS 3,4,5,6
I N I T I A L ICE
THICKNESS
0 - 2 0 IN.
V2
5
10
20
4 0
6 0
8 0
9 0
PERCENT
OF
T l M E GROWTH RATE I S EXCEEDED
lroln t l ~ c prol):~l)ility cllrves. It wits notctl tl1:11 for :~rc.:~s in t l ~ c Far North plottc(1 ~ ) o i l ~ I s 1t!11c1 to I)e nc!~r the 11l)pt:r li~nit o l 110 S I I O \ \ ~ cover. AII cx- p l ; ~ n n t i o ~ ~ coulel 1)c that a t t l ~ c s c north- crn'sitcs icc c,o\vcrs are: l)lo\vr~ clear of snow; a c:ovc:r grc:~tc,r tlrar~ 6 in. sel-
dom pc,~.sisls lor tllc elltire ice lorma- 1io11 pc:riotl. Simil;~rly, in so11tl1j~11 rc- gions plott~:e\ 1)oi11ls 1c.11tI to l)c ll(,:lrcr t l ~ c lo\vcr l i r ~ ~ i t , i ~ ~ t l i c ; ~ t i ~ ~ g t11:1t sig- n i l i c a ~ ~ t s ~ ~ o w covcr occ:urs morE fre- qr~cntly oil icc in t l ~ c s c nrc;+s. It s l ~ o u l d bc notcd t l ~ : ~ t tllere is a n upper limit to n i ; ~ s i ~ n r ~ r n ice tt~ickncss a t evcry site, govcrnc:tl partly by the 1c:ngtll of t l ~ e ice-growth pcsiotl; this varies lrom a lcw we~c~ks in 111~: sorit11
An cstimatc of n ~ a x i ~ n l ~ ~ n ice thick- nc:ss is oftcln rc%el~~irc:tl i l l s11c11 cngi-
n c . c r i ~ ~ g prol)le.~rrs ;IS 111~: tl(:sit;n of dams for ~ n : ~ x i n r ~ ~ r n icx: I)rc!ssllrc or 111~:
3
B
to :IS m11c11 :IS 250 t l ; ~ ~ s i l l tho Par12
REGIONS 3 , 4 , 5 , 6
Nortl~. ,is ~ n a s i m u m icc thickness a t a( A L L
STATIONS)
particular site will vary from season to scason, ol)scrvcd maximum ice8
ICE THICKNESS
thickrresscs s l ~ o ~ ~ l t l be nsed w l i e ~ ~ e v e r20-
4 0 IN.
;~v:~ilnblc i l l prc:lcrc~~ce to o t l ~ c r in-.
formation. 111 a r c c c ~ ~ t circular the
4
hlctcorologic;~l Branch compiletl in- formation~ I I lnaximr~m icc thicknesses
o n Ii~kcs :u~tl rivcrs i : ~ C:an:~dab. Bilcllo ]):IS prcp;uetl prcliminarv clirn;ctologi-
0
cal maps of m n s i m r ~ ~ n icc tl~ickncsses2
5
10
2 0
4 0
608 0
9 0
for Arctic a ~ ~ d ~111)-Arctic rcgionsD.PERCENT
OF T I M E GROWTH RATE I S EXCEEDED
I7or sitcs \\tlrrsc i i ~ : ~ r i ~ n ~ ~ ~ r i ice tl~ick-. IICSS oI)s(~rv:itie~~~s : ~ r c riot :~v:~il:tl~lc tlrc Fill 3-Ice growfli probability curves sliowinu effect of snow cover on ice growth rates limits S ~ O \ V I I 011 Fig.4
~ f l 1 . 1 pro\,itler~scful inlornration that may I)c satis- factory lor many dcsigr~ prol~lcms. T h e merits of removing the snow b e ohtained from the information on
covcr or of accclcrating ice growth by the r ; ~ t c of icc g r o ~ \ ~ t l ~ compiled in ~~~t ~ ~ ~~ d h ~ ~~ +~ i ~ ~ ~~ h floodir~g or snow compaction can be this study. Using average ice-growth ice
covers
more readily assessed with this k ~ ~ o \ \ r l - r:~tcs it is possible to relate ice thick-
edge of the possiblc limits of natural ness to t11c length of the period of I t is possil~lc to cstirnate the limits ice growth. i(:c gso\vtll. ~h~ average rates of o l tllc cspc<:tcd heat loss by C O I I ~ U C -
gro\\ttll for average wcatllcr con&- ti011 tllSOl1~h CQ\'CrS
1))'
i.OllveI't- It should b e kept in mint1 that the"laill reasOll for vari;ltion i n ol,scr,,cd t i o ~ ~ s , snow cover less than 2 in. and ing icc-gl'o\\'th rat('s given in t l ~ Pro-
$no.\\, ('o\rcr grc3tc.r thrill ill., h a v e , b;~l)ilit! c l l ; ~ ~ t s to o l heat 1;~s. icc-gro\\.tl~ r:ltes is t l ~ e natural ria-
lIccyn Llscd to plot tlrc icc-gro\vtll lines T l ~ i s i~~fornlation might b e usc~Eul for tion that occurs i l l sno\\. tlcpth and
slro\\rn o n Fig.
4
c c r t : ~ i ~ ~ tlcbign psoblclns. \vratl~e~r c*ontlitions. 'l'l~is n n t ~ ~ r a l v;~ri-atie,ll illtsOtltlc.c~s l l l l c c ~ s t n i l l t y into esti- O I ) s c r v a t i o ~ ~ s o ~ ~ I ~ I : I S ~ I ~ ~ I I I ~ I ice tllick- T ; ~ l ) l c I1 givcs t l ~ e prol)ability of Inales of icc-growt~l ratcs, w ~ , c t ~ , c r ncss for cnsc:s \ \ ~ l ~ c r e t l ~ c date of occurrcncc of a given 11c;ll loss cstinlatc,s lnatlc lIy llsc for- fr(:(,xr-111> \\'as rc(.or(lctl were plottcd thror~gh frcsl~\v:~ter ice, assuming the
nlul;lc or lIy probal,ility c.,arts, prc- 011 Iiig. 2 1 : I ~ : ; I ~ I I S ~ t 1 1 ~ ~ ~ r ~ m b c r of days 11t*:1t of h ~ s i o n for icc is 14.1 Utu/lb.
t l i c t i o ~ ~ of icc-growth ratcs from pro-
T A I i I , E
I
bal~ility c l ~ a r t s I)asctl on :1(.t11:11 o1)scr-
vatior~s arc prol)al)ly a t le;lst ;IS rcli- I , o c : a ~ i o ~ l :rl~cl N u ~ l l t , c ~ -
of
O b s c ~ * v a t i o i i s o fIc:e
.
. .
a t ~ l e a11t1 r~srlally more: convc:nic~~t t11;1n
1
l l i c k ~ l c s s Usccl ill A i i a l y s i sprcclictibns b;~sctl on f o r ~ n r ~ l ; ~ ~ . . . .. .... . . --- . . - .. .. - .- .
tlr:sig~~ of \\latcsr intitkcs o l ~ c l . : ~ ~ ing Iln- dcr \vintcr conditior~s. If ice thickness n / ~ s i ~ r \ ~ ; ~ l i o n s : ~ r ( . r~ e ~ t :~vnil>l)l(~ :I[ n ,sit(,, : I I I ~ . C ~ I ~ I I I : I I ( * 01' 1 1 1 < ~ I ~ I ~ ~ ~ ! , I I ( ~ : ; ~ ; I , . I I I M a x i m u m Ice Thickness -- - - - - . -. .- . . . - -. -. . . -. - . ..
No.
o fI
Ol)scr~,alior~s (,'lnssiJcn/iot~ .. .. - . - -. .. - . . . - . . - -. .- . . . . - . .. - - -NUMBER OF DAYS FROM FREEZE-UP
0 O 50 100 150 I 200 250 300
OBSERVATIONS I N THIS SECTOR W E R E AT SITES WITH DEEP SNOW C O V E R
I
- -- -- SNOW C O V E R 6' OR G R E A T E R SEA ICE FRESH W A T E R ICE 5 0 % OF- LEGEND ?. 0 0 Fig. 4-The relationship b o ~ w e o n tha number of days from frceza-up to maximum icothicknasr
The c a l c u l a t i o n w a s not c a r r i e t l out for s c ; l - i c e ; this calculation is not tlif- ficult, l ~ u t it docs require a k n o \ v l - c t l g c of tllc dependence of tlne heat of fusion of sea w a t e r on salinity a n t 1 of tlne d c p c n d e l ~ c e of t l i c specific heat
of sca-ice on t c m p e i . a t u s e a n d salinity.
For slnortcr p c r i o t l s lneat c o n t l u c t e d t l l r o i ~ g h the cover can esccc~tl the
r:~tcs listetl in Table 11, but for p c r i o t l s
of two \ v c c k s or n ~ o r c tlnc valuc!s g i \ . c ~ l s l ~ o t l l t l
I)(:
c l ~ ~ i t c rc:prcx:"t;~ti\~t: of t11(: IIV(~I;I&!(~ I I I * ; I ~ loss t11;1f \\till O(X.III..I n the
F;IY
North whcrc thcrc is nos h o r t - \ \ r a v e s o l a r radiation ( l u r i n g tlne m i t l - \ \ l i n t e r months, t l i c Ineat conduc- tcil t l i r o ~ ~ g h the covcr ec~uals tlnc heat losses tlrlc to l o n g - w a v e r a t l i a t i o n , c \ 3 a p o ~ ; ~ t i o n a l l d convection. 111 s o u t l i - ern areas the a m o u n t of s h o r t - \ v n v e radi;ltioll a b s o r l ) e t l by a s n o \ r r or ice s u r f a c e s l n o r ~ l t l Ijc a t l t l c t l to tlrc \ ~ : ~ l u c s in T a l ) l e I1 to give th(> c o l n l ~ i n e t l lneat loss t l r ~ c t o c v i i p o r a t i o n , convcctio~~ iund l o ~ ~ g - \ \ ' ; ~ \ ~ c r n t l i ; ~ t i o n . I n 1)cccm- 1)er a t I a t i t ~ l d e 45"N t l l c a v e r a g e short-wave r a d i a t i o n absorbed by a n ice covcr M ~ O I I ~ ~ l)e about 200 to 275 I3tu/sq ft/% Ilr, or a b o u t cclrl;~l to t l l c 50% villtle listed in 'I'ablc 11. CONCLUSIONS
This analysis of ice-thickness obser- vations on a regional basis intlic,atcs that p r o 1 ) a b i l i t y ch:~rts c i u i be u s c t l to o1)t;iin a rcasonablc c s t i ~ n ; i t c of the 1)rol)nl)le rate of icc g r o \ \ 4 l i nlltl ice ~ l ~ i c , k ~ ~ c s s a t a n y sitc in (:;III(~;I. 'l'i~c ; I V C : I - ; I ~ c : icc growtl~ r;lIc:s sl10\\,11 011 tlnc p r o b a b i l i t y charts c a n also I)c tlsctl
to relntc n ~ a x i m ~ ~ n ~ ice thickness to the Icngth of the period of ice g r o \ v t h .
The icc g r o \ v t h rntcs can also bc con- \ l e r t c t l into a\.er;igc Incat loss from tlnc ice covcr to provide i n f o r m a t i o n on the rate of 11e;lt loss from icc: covers in different regions.
Dopth of S I I O \ \ ~ covcr on ice is s h o \ v n to I l a v e n m a r k e t 1 cffcct o n t l l c rate of ice g r o \ \ , t l l . T l ~ c n\.cr;lgc r ; l t e \\,it11 ;I s ~ l o w c o \ . c r of
G
i n , o r more is : ~ l ) o u t o ~ ~ c - t h i r d to o n c - I n a l l t l ~ ; ~ t \vitln l l e n ~ I.oss ' I ' h r o l 1 ~ 1 1 I: ~ . c . s l l - \ \ ! ; ~ ~ c ~ -1c:c Covers
(fol. a l l r c g i o ~ l s , a l l s l ~ o \ v c . o \ f c ~ - c . o l n ( l i ~ i o l l s , :111(1;111
1.;111;cs ol' i l ~ i l ial icsc ~ l l i c * l i n c : s s )
;I s ~ ~ o w covcr u n t l c r 2 in.
B c . c ~ ; ~ ~ r s c thc r ; ~ t c of ice g r o w t l l de- p c ~ ~ ( l s on I ~ i g l l l y v a r i : ~ l ) l e snow a n d \vc.:~tllcr c o ~ ~ ( l i t i o ~ ~ s , t l l c only sure way of o l ) t ; ~ i ~ l i l ~ g s:ltisf:~ctor)f information ~ I I ic,c c~ontlitiolls :lt :I p a r t i c u l a r site is to 111;1kc nppropri;~tc m c u s ~ ~ r c ~ n c n t s of icc t l l i c - k ~ l c s s f o r ;L r l r ~ l n l ) c r
of
yc:arsH'. As t11c:sc rc:c,o~.tls i ~ n p r o v c i c x t l ~ i c k ~ r o s s c ~ s (.;LII t11c11 I)cstI)(:
c s t i ~ n ; ~ t c b t l ill t l l c s;llrlc \ \ x y :IS a i r t c n ~ l ~ c ~ r i ~ t u r c is I I O \ \ ~ c s t i l n ~ t t r d from c l i m a t o l o g i c a l r c c o r t l s . \1'lrc11 sricll records a r c 'not av;nil;~l)lc a t ;I s i t c , ice prol):ll)ility C.~I:II.IS rlscd \ v i t l ~ t l i s c r o t i o ~ ~ (.;LII p r e -vitlc ;I 11sc:f111 rnotllotl of prrtlillg limits oil t11(1 r;ltc: of icc g r o w t l l and rnaxi- n111n1 ice tllickncss to be c x p c c t c t l . '
Acknowlcdgcments
l'llc. \ \ f o r k of tlnc m a l l y o l ) s c r v e r s
wllo ol)t;lillc:tl t l l c ice t l l i c k n c s s ol)sc:r- v ; ~ l i o ~ ~ s 11sc~1 ill this 1);lpcr is gr;rIc:- f ~ r l l y : i c k ~ ~ o \ v l c t l g c t l . Tlnc o ~ ~ t l ~ o r also \vislles to n c k l ~ o w l c t l g e tlnc help of h.11.. P. X,lontford it1 analvsing m a n y of the o l ) s c r v ; ~ t i o n s , ;11lt1 t l ~ c cncouragc- ment of L. W. Colt1 in thc prc:l)ar- ;Ition of this paper. This is a c o n t r i l ~ u - tion f r o m thc D i v i s i o ~ ~ of 1311iltling I l c s e a r c ~ l n , N a t i o n a l Ilcsc;~rcl~ C o u n c i l , O U ~ \ \ J ; I , a11t1 is p ~ ~ l ) l i s h c t l with tlnc np- '
1)rovaI of t l l c Ilir.c%ctor of thr 1)ivision.
Rcfercnccs
1. C ~ l r r i c , B . W. P r a i r i c Provinces a n d Norlhwcst Tcrrilorics; Icc Thlclrncsr nnd Soil T c m p c r a l i ~ r c s . S : i s l ~ : i l ~ ~ n n . S ; ~ s l < . , Il~iivcrhily ~f S : ~ s l c i i t ( . l l c ~ ~ ; ~ ~ ~ , 1)cl)t. o l Physics. 195:j.
2. Rytlcr. T. Cornpilalion a n d S t u d y of Ice Thiclrncsses in l h c N o r l h c r n Heml- sphcrc. Nc\v York. A l n c r ~ c n n Geo- ~ r ; i l > h i r a l Society. J u n c 1954.
3. Cnnntln. D e p a r t m e n t o l T r a n s p o r t , Mc- tcorolol:icnl B r a n c h . Ice Thickness D a t a f o r Canadian Sfations. C ~ r c u l ; i r No. 3337, October 1961.
4 . Cold. I,. W. Ficld S t u d y o n l h e Load D c s r i n q Capacily of Icc Covers. Nn- tion:~l Rcsc;irrh Ccx~ncil. Division of Builtling I<esc:lrch. NI<C 5712, 19GO. 5. Dc\.il:. 0 . Ice F o r m a l i o n in Lalrcs a n d '
Rivers. I'roccctlinfs. Intcl.n;~tional As- soci:illon of Scicntilic I<srl~.olocv. I n t e r - nation;il Union oC Gcobcs). i i l d C c o - ~)Ilyslcs. Vol. 11. 19~111. p.:j59-'3~(i.
6 . C;ill:l\\'ny, E. R . A n Analysis of En- v i r o n m c n l a l F a c t o r s Affcclinq Ice Growlh. \ \ ' a s h i n ~ l o n , D C.. U.S. N a v v 1Iytlrogr:~phic Ollicc. T c r h n i r a l Rcl)oit No. 7, Sc[>tcml)cr 1!154.
7.1311r1iitl!!c. 1:. E. a n d J . R. 1,:iirder. A Preliininary Inven1iqation inlo Drcalc- u p a n d Prcczc-up Conditions in Ean- ada. 1)t~l):irlmcnt o l 'Yr:~nsport. .Me- I c I I I ~ ~ I I ~ I ~ : I ~ ~ : I I 13r;111c11, C I ~ ~ L I I : I ~ N o 2:I:lLl. .July l!l57.
0, C : I I I : I ~ ~ ~ I , ~ ) L ~ I ) : I ~ I I I I ~ I I L I I ~ T r ; ~ ~ i s l ) o r t . Me-
tc-c>rc>lo!:it~:~l 1\r;111cIi. Miixin~tirn W i n l c r Icc Tlricl;nc:;:;~.s in n i v c r s a n d Lalccs in. Canada. C ~ I . ( , L I I . I ~ N O . :11!15, 1!15!1. 8. liilcllo, hl. ,\. luc Tlric1;ncss Obscrva-
v;~!ions ilr l h c Plorlli Amcrican Arctic nlrd Sub-Arctic i o r 1950-59, 1959-G0.lJ.S. A I . I I ~ ) , CIIICI I<<.;:IIIIIS lt~:::e:irtsl~ ;1!1tL KII-
L : I I I C Y ~ I I I ) : L,;il~or:ilo~~y, I<q)orL Pic). 43* l!ll;l.
10. Ail<l!.~.\\x. . I . '1'. V;lri;:bilily of Lalrc Icc Grorvllr a n d Qu.ilily in I h c ScIr6ffcr- villc licqion. (~1~111r;11 1.:i1~i~;1(1~11~-1.11i::;1vil~
. I O \ I I ~ I I , I ~ 111' (;1.1(.1111t~:.y. Val. .I. NO. 3:j.
0 1 ~ 1 1 1 1 1 ~ ~ 1 ~ l!ll;". I).:!:,'; :;I;.