HAL Id: hal-00515334
https://hal.archives-ouvertes.fr/hal-00515334
Submitted on 10 Sep 2015HAL is a multi-disciplinary open access archive for the deposit and dissemination of sci-entific research documents, whether they are pub-lished or not. The documents may come from teaching and research institutions in France or abroad, or from public or private research centers.
L’archive ouverte pluridisciplinaire HAL, est destinée au dépôt et à la diffusion de documents scientifiques de niveau recherche, publiés ou non, émanant des établissements d’enseignement et de recherche français ou étrangers, des laboratoires publics ou privés.
Liquid andparticles retention in foamed suspensions
Sylvain Guignot, S. Faure, M. Vignes-Adler, Olivier Pitois
To cite this version:
Sylvain Guignot, S. Faure, M. Vignes-Adler, Olivier Pitois. Liquid andparticles retention in foamed suspensions. Chemical Engineering Science, Elsevier, 2010, 65, pp.2579-2585. �10.1016/j.ces.2009.12.039�. �hal-00515334�
Liquid and particles retention in foamed suspensions
Sylvain Guignot1, Sylvain Faure1, Michèle Vignes-Adler2 and Olivier Pitois2*. 1
Advanced Decontamination Processes Laboratory, Commissariat à l’Energie Atomique (CEA Marcoule), CEA, DEN, SPDE, LPAD, 30207 Bagnols sur Cèze, France.
2
Université Paris-Est, Laboratoire de Physique des Matériaux Divisés et des Interfaces, UMR CNRS 8108, 5 bvd Descartes, 77454 Marne la Vallée Cedex 2, France.
* Corresponding author: Fax:+33 1 60 95 72 97 *E-mail address: [email protected]
Abstract
This article describes a new strategy to modify the drainage behaviour of aqueous foams with solid nanoparticles. While for high particulate concentrations the liquid flow can be slowed down owing to viscosity effects, we show that much less concentrated systems, but possessing peculiar physicochemical properties, can also strongly modify the drainage behaviour. Taking advantage of the agglomerated state of pyrogenic silica in aqueous media, highly porous
macro-particles are specifically prepared in the initial foaming solutions. It is shown that their
typical size and their intrinsic yield-stress properties enable them to be captured by the bubbles during the foam generation stage and subsequently to be retained in the foam channels, according to a geometrical criterion based on the particle/bubble sizes ratio. The drainage curves of the foams display significant retention rates for the suspension during several hours, an effect that is enhanced for higher particles concentrations. This has been related to the high internal porosity and hydrophilic character of the macroparticles, acting as liquid-traps in the foam microstructure.
Keywords: Bubble columns, foam, particulate processes, non-newtonian fluids, filtration, porous media.
1 INTRODUCTION
An aqueous foam can be viewed as a dispersion of gas bubbles in a liquid, stabilized by surface-active species adsorbed at the gas-liquid interfaces. The foam structure is described by the Plateau rules stating that the liquid films between the bubbles meet three by three to form Plateau borders, these latter intersecting four by four at nodes (Weaire and
Hutzler, 1999). Like in solid porous materials, the liquid flows through the continuous network of interconnected channels that constitutes the main part of the foam porosity. Foam ages because of several interrelated physical processes, namely the liquid drainage in films and channels, the so-called disproportionation process, and the coalescence of bubbles. As a major destabilizing effect of drainage, the liquid films thin progressively, thus promoting their rupture and the resulting collapse of the foam sample. Moreover, the films thinning eases the gas diffusion from smaller to larger bubbles driven by their different internal pressures. In return, the disproportionation process enhances the liquid drainage (Saint-Jalmes, 2006). As the collapse of the foam can be detrimental to potential applications, a possible strategy to enhance the foam stability is precisely to reduce the liquid drainage. This is traditionally achieved by means of viscosifiers such as Xanthan gum (Faure et al., 2004; Safouane et al., 2006). Alternatively, the effect of disproportionation on foam drainage can be reduced by using poorly soluble gas (Saint-Jalmes, 2006). With the same purpose, new trends propose to cancel out the gas pressure differences between bubbles, by using foams with bubbles as monodisperse as possible – so called crystalline foams (Vignes-Adler and Weaire, 2008). Following the more recent findings, solid colloidal particles can be added to the formulation: mineral particles may replace the liquid-thickening organic agent, which may be of paramount interest for industrial applications. Moreover, these particles can be specifically
hydrophobized for an optimal adsorption at the liquid/gas interface, thus acting as an armor for the bubbles, preventing coalescence and reducing the internal gas transfer (Binks, 2002; Abkarian, 2007; Martinez et al., 2008). On the other hand, hydrophilic particles remain confined in the liquid phase and their ability to enhance the foam stability is less obvious. They are believed to impede global liquid flows by narrowing channels and forming local plugs in the foam, but yet, illustrative experimental data for these mechanisms remain scarce. Monodisperse colloidal particles were found to slow down the thinning of horizontal liquid films and make it occur in a stepwise manner as shown by Sethumadhavan et al. (2001). This is ascribed to an additional contribution to the disjoining pressure in the films brought by the ordering particles. However, this significant stabilizing effect is reduced as the liquid film drains vertically (Hudales and Stein, 1990; Garrett et al., 2006). On a wider scale, Kruglyakov and Taube (1972) have studied the drainage of foams generated from a non-ionic surfactant suspension of pyrogenic silica. Results showed that the loss of liquid is slightly slowed down when particles are present, and this was explained by a steric hindrance to the liquid flow. To significantly affect the drainage of a foam, the overstepping of some gelification point in the liquid phase seems to be required. Wilson (1980) thus designed very stable foams by using concentrated suspensions of micrometric polystyrene beads, and showed that this stability was due to the formation of a whole gelified network embedding particles both at the interfaces and in the liquid. This configuration could only be attained when the physicochemical
conditions of particles coagulation were fulfilled in the solution. Given the high viscosities of these particular foaming suspensions, specific foam generation methods have to be carried out.
In this paper, we investigate an alternative strategy to enhance the retention of both liquid and nanoparticles in foams without resorting to concentration effects. This is achieved through the in-situ making of highly porous agglomerates, the so-called macro-particles, in
the foaming solution. Note that these macro-particles must be understood as inert objects resulting from a preliminary “conditioning” stage, which definitely distinguish the present approach from those based on reactive suspensions (Carn et al., 2009). Provided that these macro-particles have appropriate typical sizes, they are likely to be captured by the foam channels. As a necessary property, they must be strong enough to withstand the shears exerted by the liquid flowing in the foam and thus to behave as effective corks. In the following, we describe the preparation of the foaming suspensions used for testing this strategy. The size and the rheology of the resulting macroparticles is then studied. Dedicated experiments are
performed to investigate the behavior of the macroparticles in foams.
2 MATERIALS AND METHODS
2.1 Preparation of the foaming suspensions
The surfactant used to stabilize the foams is a mixture of three well-defined alkylpolyglycosides (Glucopon 215 CS supplied by Cognis, France). Its critical micellar concentration in demineralized water is around 0.6 g.L-1 (determined by the surface tension dependence on the concentration). In all the experiments, it was introduced without further purification to get a base-solution at 10 g.L-1. The corresponding surface tension is 27 mN.m-1.
The suspensions of interest for the present study are obtained by adding various quantities of pyrogenic silica (Aerosil 380, Evonik) into equal volumes (300 mL) of the foaming base solution. Each suspension is then stirred (magnetical stirrer bar of 5.7 cm) in a beaker of 400 mL (diameter 7.5 cm), at a fixed speed (600 rpm) during 5 min, before
adjusting the pH values to 7.0 using nitric acid and a pH-meter. The resulting solution is a suspension of agglomerates. These later are known to be composed of aggregates in a loose packing arrangement (Iler, 1979), and are therefore called macro-particles in the following. The agglomerated state was checked by applying brief ultrasonic impulses of 50 W with an ultrasonic probe during 10 minutes in the solution. Afterwards, dynamic light scattering was performed on a sample of this suspension and showed a size distribution ranging from 140 nm to 620 nm centered on ~ 290 nm. This size indeed corresponds to the expected aggregates, resulting from the irreversible sintering of the primary silica units (the size is 7 nm, the BET specific surface is 380 ± 30 m2.g-1, and the density is
2
SiO
2200 kg.m-3). Eisenlauer and
Killmann (1980) have determined the mean porosity of this type of colloidal clusters to be around 0.9, meaning that they enclose high amounts of the dispersion fluid. Note that the results presented in the following are obtained from the macro-particles suspensions, i.e. not sonicated solutions.
2.2 Characterization of the foaming suspensions
2.2.1 Size of the macro-particles
The size of the resulting macro-particles are obtained from settling measurements (Font et al., 1994). Each suspension at concentration C is homogenized in a test tube. The initial s
height of suspension is H . The evolution of the height H corresponding to the clarification 0 front is then followed using a CCD camera, allowing for the settling rate dH dt to be measured. Assuming that the macro-particles are equally-sized, sphere-shaped, and
impermeable, their apparent diameter, dm, is deduced from the relation proposed by Snabre
and Mills (2000) for monodisperse rigid spheres:
2 18 1 1 5.8 m m dH dt d g , (1)where g is the gravitational acceleration, and are respectively the dynamic shear viscosity and the density of the suspending liquid, m is the density of the macro-particles
and is the macro-particles volume fraction in the suspension. The two later parameters are determined from the experiment. Indeed, H is found to decrease until a constant value, Hf ,
is reached. Hf corresponds to the packing of the macro-particles at the bottom of the tube.
The packing fraction is expected to be pack 0.5. Note that Hf is measured over the time
scale of the primary settling, i.e. 1-10 minutes. Over larger time scales, i.e. hours and days, a subsequent slow decrease is observed, meaning that the packing fraction and presumably the SiO2 concentration in the macro-particles, Cm, increase. As the kinetic of this subsequent
evolution is several orders of magnitude smaller than the first one, it is disregarded in the following. is thus given by pack Hf H0, and the macro-particles density is:
1 2
m Cm SiO
, where Cm CS .
2.2.2 Rheology of the macro-particles
The rheological properties of the suspensions are measured with a controlled stress rheometer Bohlin C-VOR equipped with concentric cylinders (inner space: 1.25 mm). The temperature is set around 26.0 ± 0.02 °C. Successive constant stresses (ranging from 0.005 Pa
to 6 Pa) are applied during 30 s, and the resulting deformations are measured. A pre-shearing at 50 s-1 during 10 s, followed by a resting time of 30 s, is applied prior to each stress step. The surface of the two cylinders is notched to prevent any wall slip. Studied concentrations range from 40 to 90 kg.m-3 of introduced silica. Only suspensions with a concentration above 40 kg.m-3 are considered, since for lower concentrations the gravity settling process results in a phase separation that disturbs the rheological measurements.
2.3 Foam experiments
2.3.1 Retention and release of macro-particles in foams
FIG 1. Diagram of the experiment dedicated to the macro-particles trapping in aqueous foams. Wetting and drying steps are successively performed. During wetting steps, particle free solution is introduced in the foam column at a given flow rate, so that the liquid fraction
is suddenly increased in the foam. Each wetting step is followed by a drying step to observe the macro-particles in the foam (see the photo). The liquid flow rate of wetting steps is gradually increased, and the liquid fraction for which the macro-particles are expelled out of the foam is measured for several foams with different bubble size.
Foams are generated by a gentle bubbling of perfluorohexane-saturated nitrogen in the silica-free foaming solution by means of a syringe needle, until ~ 25 cm-high foams are made. Perfluorohexane is used to limit the gas diffusion during the experiment, and thus to keep an almost constant bubble size. The foam is let draining until it becomes dry, and a few
milliliters of the macro-particles suspension is introduced in the foam by a microsyringe equipped with a thin rubber tubing. The small amount of suspension is deposed in the central part of the foam, in order to avoid disruptive top and bottom end effects, i.e. collapse of bubbles at the top and capillary rising from the tank of foaming suspension upon which the foam lies. In the dry state of the foam, macro-particles can be distinguished in the foam liquid network (as the liquid fraction increases they cannot be observed anymore). From this state, a wetting step is performed: the upper part the foam is wetted by given flow rate of particle free foaming solution. This wetting step allows for the liquid fraction to be precisely measured: a resulting steadily-moving liquid front progresses downwards in the dry foam at a velocity vf
(Weaire et al., 1997), accompagnied with a dilatation of the foam channels. The liquid front velocity vf is related to the superficial velocity of the injected liquid, v , by d vd vf , where is the foam liquid fraction (see Fig. 1). After the passage of the wetting front, the liquid fraction is uniform over the whole foam sample: its value depends on v . Each wetting d
step is followed by a drying step to observe the macro-particles in the foam (see the photo in Fig. 1). The liquid flow rate of wetting steps is gradually increased, and the liquid fraction for
which the macro-particles are expelled out of the foam is measured for several foams with different bubble size. Note also that we observe the foam/liquid area at the bottom of the column to check that macro-particles are definitely expelled out of the foam.
2.3.2 Free drainage experiment of foams
The measurements have been performed with a commercially available device, Foamscan (Teclis, France). Compressed air at a controlled flow rate of 100 mL.min-1 is sparged into V0 25 mL of the foaming suspension through a removable sintered porous glass (porosity value of 3, 16-40 m range) in a square rectangular column (cross-section
S 6.25 cm2) fixed above. The generation is stopped when the foam has reached a definite height Hfoam ranging between 20 and 25 cm. This height slightly decreases during the
experiment, about 1 cm over 3000 seconds for the foam generated from the less concentrated suspension. This decrease is taken into account in the calculation of the liquid fraction. The liquid fraction is known at ± 0.01.
The bubbles sizes in the foam are polydisperse and the sparging is adjusted so that the initial liquid fraction, 0, is close to 0.1 ± 0.01. A couple of vertical electrodes fixed at the bottom of the column performs a conductivity measurement every second. The contribution of the foam phase to the obtained signal is negligible so that the conductivity value accounts for the height and thus the volume V, of liquid remaining at the bottom of the column . The precise relation between conductivity value and V requires a calibration step. This has been made before the experiment on the foaming suspension. The mean liquid fraction in the foam is thus
one of the inner transparent walls of the squared-column are taken, and an image processing software is used to extract the size distribution of the bubbles.
3 RESULTS
FIG 2. Volume fraction filled by silica agglomerates in the suspension as a function of the particles concentration.
The volume fraction of the macro-particles in the suspension, ϕ, is a linear function of the particles concentration CS (Fig. 2). The slope p is related to the particles concentration in the agglomerates: p = 1/Cm 10-2 m3.kg-1. For concentration values equal or above 50 kg.m-3,
the sedimentation is small or even negligible over several minutes, meaning that the packing fraction is obtained for CS 50 kg.m
-3
calculated with: m 1 Cm pack.SiO2 . With Cm = 100 kg.m-3, we find m 0.95, meaning
that the macro-particles are very loose and essentially composed of foaming solution. The size of the macro-particles is calculated from the settling velocity, the volume fraction and the density of the macro-particles. For the investigated suspensions, we obtain 70 µm < dm < 90
µm. Additionally, the maximum error bar on the macro-particles diameter is estimated to be 15 µm.
FIG 3. (a) Deformation of a suspension containing 60 kg.m-3 Aerosil 380 in a Glucopon 215 mixture at pH 7, as a function of time, for various applied stress levels. (b) Measured yield stresses as a function of Aerosil concentration (pH 7)
Fig. 3a shows the creep flow measurements obtained for a suspension at 60 kg. m-3 submitted to various stresses ranging from 0.8 to 3 Pa. For the lower applied stresses (below 2 Pa) the deformation remains almost constant during the measurement, while it abruptly increases for greater stress levels and reaches values several orders of magnitude higher than at 2 Pa. This suspension behaviour thus evolves from an elastic solid to a viscous liquid as the stress is raised. The transition value corresponds to a yield stress, S, and can be estimated in
this specific case to be between 2 and 2.5 Pa. This behavior has been found for all the studied samples. Fig.3b reports the obtained yield-stress values for suspensions with various silica concentrations. The observed rise is ascribed to the denser entanglement of the
macro-particles due to the increase in their effective volume fraction in the suspension. We were not
able to prepare suspensions at CS = Cm, i.e. 100 kg.m-3, with the current method. However, the
corresponding value can be reasonably extrapolated from the data: S
CS Cm
8-10 Pa.Finally, note that the thixotropic character of the suspensions was observed during the rheology measurements. The displayed yield stress value is therefore closely related to the ratio between the duration of the stress application and a characteristic time of relaxation in the suspension (Deborah number). It means that over large durations, the solid/liquid transition can be observed as a function of time if the applied stress is slightly below the reported yield stress.
FIG 4. Critical liquid fraction corresponding to the release of trapped particles in the foam, as a function of the foam bubbles mean diameter. Rectangles correspond to silica agglomerates (with diameter 80 µm), circles correspond to polystyrene beads with the same diameter, the solid line corresponds to eq.(3).
Results for the release/retention experiment are presented in the following. It turns out that the macro-particles are expelled from the foam above well-defined values for the liquid fraction. This value, which is referred in the following to as the critical liquid fraction exp, depends on the bubble diameter. exp is plotted as a function of the bubble diameter in Fig.4.
Foams with small bubbles require larger liquid fractions than foams with large bubbles to expel the macro-particles : from almost 4 % for Db 1.3 m to 1 % for Db 4 mm. Visual
observations during the experiments reveal that the macro-particles deform, jam in the foam or are convected by the suspending liquid between the bubble if the gaps are sufficiently large, but they do not flow as a liquid through the foam.
FIG 5. Time evolution for the mean liquid fraction in a free-drainage configuration for foams containing silica particles at a concentration CS = 0 (no particles), 10, 20, 50, 70 kg.m-3. The image only illustrates the retention mechanism for the particulate suspension in the foam (note that it has been obtained with other experimental conditions)
Fig.5 represents the evolution with time of the mean liquid fraction of foams with various particles contents in the free drainage configuration, for which the liquid fraction varies with both space and time. The values are normalized by 0 = 0.1 0.01. The results corresponding to the particle free solution are taken as the reference, to which foamed particulate suspensions will be compared. After a short hold-up time (Exerowa and
Kruglyakov, 1998), the curve exhibits a strong decrease in the mean liquid fraction during the first hundred seconds and rapidly reach a ratio 0 of the order of a few percents. Then, the kinetics is strongly reduced and the liquid fraction slowly evolves towards the static
equilibrium value. In spite of the high concentration in surfactant, the foam slowly collapses over such large time scales that the static equilibrium is never reached. Results obtained for the particulate suspensions strongly contrast with the reference behaviour. For all investigated suspensions, the first regime of rapid drainage is observed. In fact, the kinetics is not
drastically affected by the presence of the macro-particles, which suggests that the effective viscosity of the draining phase remains close to that of the suspending liquid. However, the duration of this first regime seems to be all the shorter as the particle concentration is high. More surprisingly, the values for the static equilibrium seem to be shifted towards higher liquid fractions. In other words, significant liquid retentions appear in particulate foams, and persist for at least several hours. Measured bubble diameters were found to differ for all investigated samples. However, all average diameters spread within the range 50-100 µm with a mean standard deviation approximately equal to 25 µm. These deviations in the values of the bubble size cannot be responsible for the spectacular effects observed in the drainage behaviour as the particulate concentration is varied.
4 DISCUSSION
Results presented in the previous section indicate that whereas highly concentrated suspensions are wholly gelified, at low concentrations, the preparation method makes separate agglomerates, the so-called macro-particles. Within the range 10 kg.m-3 ≤ C ≤ 50 kg.mS -3, the silica concentration in the macro-particles is found to be approximately constant and equal to
m
C 100 kg.m-3, corresponding to highly porous structures containing 95% of liquid. As a result, the volume fraction filled by the macro-particles in the solution is given by
S m
C C
, and the concentration CS 50 kg.m-3 approximately corresponds to the loose
packing of the macro-particles in the solution. The size of the resulting macro-particles is about 80 µm in diameter. Rheological tests indicate that the behaviour of the macro-particles is solid-like for weak applied stresses (a few Pascals). However, a flow behaviour is observed as the yield stress is exceeded. In the following, we consider the silica solutions as
suspensions of spherical macro-particles at a volume fraction C CS m, with diameter dm,
porosity m and yield stress S
CS Cm
.Experiments performed in the foam show that for a given bubble size, trapped
macro-particles are expelled from the foam above a given liquid fraction exp. Since the
macro-particles must pass through a series of Plateau borders to move in the foam, we propose to
rationalize the results of Fig. 4 by introducing the parameter , which compares the size of the macro-particles with the characteristic size of the Plateau borders opening: dm dPb.
Pb
d is the diameter of the circle inscribed in the cross-section of a Plateau border in the foam. Using r, the radius of curvature defining the Plateau border cross-section, the Plateau borders
opening writes dPb2 2
3 1
r. For dry foams, a simple relation can be used to relate r to the bubble diameter and to the foam liquid fraction: r Db 1 2, where 0.87 is a constant(Weaire et al., 1997). The parameter can be expressed as:
1 2 m m Pb b d d C d D (2)
with C1 2
2 3 1
3.8. A purely geometrical criterion describing the transition between the trapped state and the free state for the macroparticles in the foam therefore writes1
. Taking into account equation (2), the criterion becomes:
2 2 exp 2 m b d C D (3)
The solid line in Fig. 4 shows eq.(3). The experimental data appear to be reasonably described by the criterion, meaning that the macroparticles are expelled as soon as their mean diameter is equal to that of the Plateau borders cross-section. Additional measurements have been performed with solid polystyrene beads of well-defined diameters (80 m). As illustrated in Fig. 4, the particles expulsion is also well described by eq.(3). Two conclusions can then be drawn. Firstly, the transition between the trapped state and the free state for solid particles in the foam can be reasonably described with the geometrical criterion given by eq. (3).
Secondly, the intrinsic rheological properties of the macro-particles, i.e. thixotropy and yield stress behaviour, do not induce a drastic effect on this transition.
Results presented in Fig. 5 can now be analysed. At the early stage of drainage, values for can be obtained from the median diameter of the bubble size distribution. Whatever the sample, we obtain > 10. Note however that eq.(2) does not stand for wet foams. On the other hand, in the random packing limit for the bubbles, dPb
2 3 1
Db, and the criterion1
corresponds to dm Db 0.154. The macroparticles are thus definitely trapped in the foams and are then squeezed between the bubbles. The stress experienced by the
macro-particles can be assessed from the osmotic pressure of the foam
2 1 214.6 0.26 Db
(Höhler et al. 2008). With Db ~ 10-4m, Π ~ 8 Pa for = 0.2, Π ~
200 Pa for = 0.1, and Π ~ 600 Pa for = 0.05. Thus, the yield stress of the macro-particles is not sufficient to counteract the pressure exerted by the bubbles. The macro-particles deform and their shape evolves to fit the foam porosity. But why do they not flow as a liquid out of the foam with the suspending liquid? One can firstly consider the mechanical equilibrium of a yield stress fluid in the confined geometry under gravity, which can be written:
s r g
(Chaplain et al., 1992). For a foam with Db ~ 100 µm and = 0.05, r 20 µm and
s r
50 104 Pa.m-1. This means that as the foam porosity is filled with macro-particles, their
yield stress is likely to oppose the driving force, which would result in the clogging of the foam and the retention of the suspending liquid contained within the porosity. This scenario would certainly take place in a solid porous material, but for foams, one has to take into account the fluid nature of the confining “walls”. Indeed, it is highly conceivable that the high interfacial mobility (Dame et al., 2005) promotes the flow of the suspending liquid around the confined macro-particles. In other words, the suspending liquid easily percolates through the obstructed porosity. In contrast to its solid counterpart, the porosity of the aqueous foams cannot be clogged, which enables the suspending liquid to drain out of the foam in spite of the geometrical obstruction of the liquid network. As a result, the final liquid fraction in the foam
corresponds to the liquid contained within the trapped, porous macro-particles. Assuming that the macro-particles’ porosity remains constant and equal to m1, one can estimate that:
0 S 0 0 S 0 S f f C f C m C C (4)
In the latter relation, f C S0 is the final liquid fraction of the foam without particles. f C S0
can be estimated from the corresponding curve in Fig. 4: f C S0 0 0.1%. This value partially reflects the collapse of the foam due to the moderate stabilizing properties of the solution. This value can also be estimated from the theoretical profile for the liquid fraction as function of the foam height, z:
z 1 2
z 0
1 2 zD tb
f l2
, with l
g
1 2,
z 0
0.36 and D tb
f 2 10-3
m is the bubble diameter at the end of the experiment.
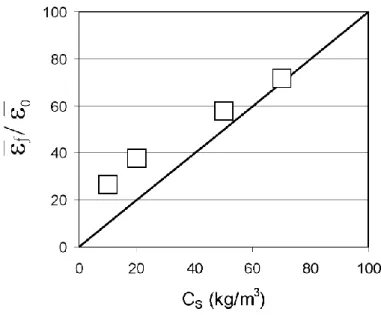
FIG 6. Variation of the liquid fraction retained in the foam with the initial particle concentration.
The average liquid fraction in the foam is thus
01 Hfoam Hfoam z dz
10-3. This value is consistent with the present experimental result and suggests to neglect f C S0 in thefollowing. Fig. 6 presents the experimental values for the ratio f 0 as a function of the silica concentration. Eq.(4) is plotted for comparison, showing a good qualitative agreement. It is however observed that the theoretical prediction underestimates the final liquid fraction at the lower particles concentrations. It is believed that macroparticles are preferentially trapped during the early stage of the foam generation, inducing an increase of the effective
macroparticles volume fraction, eff , with respect to the initial volume fraction in the solution: eff
. This effect is expected to be more pronounced for dilute suspensions and ceases as ϕ approaches the packing value. The volume of suspension initially held up by the bubbles is half of the total suspension volume introduced into the foaming column, meaning that potentially eff 2. Therefore, the apparent disagreement observed at low concentration should be attributed to the foam generation process rather than to the drainage properties of the resulting foam. At higher concentrations, a very good quantitative agreement is found, which substantiates the proposed liquid retention mechanism. Such a reported mechanism is expected as soon as yield stress materials are introduced into the foam ‘porosity’. To this regard, the previously observed draining behavior of foams containing oil droplets (Koczo et al., 1992) could be understood with elements proposed in the present paper: during a first stage, the suspending liquid drains faster than suspended droplets, so that the droplets volume fraction increases in the foam porosity (up to 80%), and then stop. We believe than the
observed stop of drainage results from the significant intrinsic yield stress property of emulsions.
5 CONCLUSION
We have studied the drainage behaviour of aqueous foams made by air sparging through foaming particulate suspensions of pyrogenic silica. We have proven that a spectacular enhancement of both the liquid and particle retentions in foam could be achieved provided that a new strategy is carried out. Taking advantage of the agglomerate state of pyrogenic silica in aqueous media, highly porous macro-particles have been specifically prepared in the initial foaming solutions. It was then shown that their typical size and their intrinsic yield-stress properties enable them to be captured by the bubbles during the foam generation stage and subsequently to be retained in the foam channels. As an additional advantage of this method, the retention efficiency is observed from the lowest particulate concentration in the foaming suspension. The retention mechanism has been shown to be well described by a geometrical criterion relating the macro-particle and the bubbles sizes. We claim that the interesting retention mechanism is general to all types of suspensions and we thus expect the present result is useful for other systems. Finally, the drainage kinetics indicate that the suspending liquid easily percolates through the foam in spite of the geometrical obstruction imposed by the macroparticles. This behaviour suggests that, contrary to their solid
counterparts, aqueous foams cannot be clogged. Further studies should investigate this striking phenomenon.
List of symbols:
surface tension of the foaming suspension
bulk shear viscosity of the suspending liquid in the foaming suspension
2
SiO
density of pure sicila
m
density of silica macro-particles
s
C silica concentration in the foaming suspension
m
C silica concentration in the macro-particles
volume fraction of macro-particles in the foaming suspension
pack
packing volume fraction of macro-particles in the foaming suspension
m
porosity of silica macro-particles
m
d diameter of silica macro-particles
S CS Cm
yield stress of silica macro-particles
foam
H height of foam in the foaming column during free drainage experiments
0
V , V initial and current volumes of foaming solution remaining at the bottom of the column during free drainage experiments
foam liquid fraction
mean liquid fraction of foams in the foaming column 0
initial liquid fraction of foams in the foaming column
f
final liquid fraction of foams in the foaming column
S 0
f C
final liquid fraction of foams without silica particles
exp
liquid fraction above which macro-particles are expelled out of the foam
b
D mean diameter of foam bubbles
r radius of curvature of Plateau borders (foam channels)
Pb
d diameter of passage in the Plateau borders (foam channels)
m Pb
d d
Acknowledgements
We gratefully acknowledge financial support from Agence Nationale de la Recherche (ANR-05-JCJC-0234-01) , from E.S.A. (MAP No. A099-108: C14914/02/NL/SH) and from the French Space Agency (convention CNES/70980).
References
Abkarian, M., Subramaniam, A.B., Kim, S.H., Larsen, R.J., Yang, S.M., Stone, H.A., 2007. Dissolution Arrest and Stability of Particle-Covered Bubbles. Phys. Rev. Lett. 99, 188301. Binks, B.P., 2002. Particles as surfactants – similarities and differences. Current Opinion in Colloid and Interface Science. 7, 21-41.
Carn, F., Colin, A., Pitois, O., Vignes-Adler, M., Backov, R., 2009. Foam Drainage in the Presence of Nanoparticle-Surfactant Mixtures. Langmuir DOI:10.1021/la900414q
Martinez, A.C., Rio, E., Delon, G., Saint-Jalmes, A., Langevin, D., Binks, B.P., 2008. On the origin of the remarkable stability of aqueous foams stabilised by nanoparticles: link with microscopic surface properties. Soft Matter. 4, 1531 – 1535.
Chaplain, V., Mills, P., Guiffant, G., Cesari, P., 1992. Model for the flow of a yield fluid through a porous medium. J. Phys. II. 2, 2145-2158.
Dame, C., Fritz, C., Pitois, O., Faure, S., 2005. Relations between physicochemical properties and instability of decontamination foams. Colloids and Surfaces A: Physicochemical and
Engineering Aspects. 263, 210-218.
Eisenlauer, J., Killmann, E., 1980. Stability of colloidal silica (aerosil) hydrosols. I.
Preparation and characterization of silica (aerosil) hydrosols. J. Colloid Interface Sci. 74, 108 – 119.
Exerowa, D., Kruglyakov, P., 1998. Foam and foam films – theory, experiment, applications. Elsevier Press.
Faure S., Fournel B., Fuentes P., 2004. Composition, foam, and method for surface decontamination. World patent WO2004/008463.
Font, R., Marcilla, A., Colom, M.C., 1994. Aggregates of particles in dilute suspensions: estimation of aggregate volume index and diameter. Powder Technol. 81, 169 – 175. Garrett, P. R., Wicks, S. P., Fowles, E., 2006. The effect of high volume fractions of latex particles on foaming and antifoam action in surfactant solutions. Colloids and Surfaces A:
Physicochemical and Engineering Aspects. 282–283, 307–328
Höhler, R., Sang, Y.Y.C., Lorenceau, E. and Cohen-Addad, S., 2008. Osmotic Pressure and Structures of Monodisperse Ordered Foam. Langmuir. 24, 418-425.
Hudales, J.B.M., Stein, H.N., 1990. The influence of solid particles on foam and film drainage. J. Colloid Interface Sci. 140, 307-313.
Iler, R.K., 1979. The chemistry of silica. Wiley, New-York
Koczo, K., Lobo, L. A., Wasan, D. T., 1992. Effect of oil on foam stability: aqueous foams stabilized by emulsions. J. Colloid Interface Sci., 150, 492-506.
Kruglyakov, P.M., Taube, P.R., 1972. Syneresis and stability of foams containing a solid phase. Coll J.-USSR 34 (2), 194.
Safouane, M., Saint-Jalmes, A., Bergeron, V., Langevin, D., 2006. Viscosity effects in foam drainage: Newtonian and non-newtonian foaming fluids. Eur. Phys. J. E. 19, 195 – 202. Saint-Jalmes, A., 2006. Physical chemistry in foam drainage and coarsening. Soft Matter. 2, 836-849.
Sethumadhavan, G.N., Nikolov, A.D., Wasan, D.T., 2001. Stability of liquid films containing monodisperse colloidal particles. J. Colloid Interface Sci., 240, 105-112.
Snabre, P., Mills, P.., 2000. Settling and fluidization of non Brownian hard spheres in a viscous liquid. Eur. Phys. J. E. 1, 105 – 114.
Vignes-Adler, M., Weaire, D., 2008. New foams : fresh challenges and opportunities. Current
Opinion in Colloid and Interface Science. 13, 141 – 149.
Weaire, D., Hutzler, S., Verbist, G., Peters, E., 1997. A review of foam drainage. Adv. Chem.
Phys. 102, 315 – 374.
Weaire, D., Hutzler S., 1999. The physics of foams. Oxford University Press, Oxford.


![[PDF] Cours C 2 Types entrees sorties de base et structures de controle | Cours langage c](data:image/gif;base64,R0lGODlhAQABAIAAAP///wAAACH5BAEAAAAALAAAAAABAAEAAAICRAEAOw==)