HAL Id: hal-03023884
https://hal.archives-ouvertes.fr/hal-03023884
Submitted on 2 Dec 2020
HAL is a multi-disciplinary open access
archive for the deposit and dissemination of
sci-entific research documents, whether they are
pub-lished or not. The documents may come from
teaching and research institutions in France or
abroad, or from public or private research centers.
L’archive ouverte pluridisciplinaire HAL, est
destinée au dépôt et à la diffusion de documents
scientifiques de niveau recherche, publiés ou non,
émanant des établissements d’enseignement et de
recherche français ou étrangers, des laboratoires
publics ou privés.
Distributed under a Creative Commons Attribution - NonCommercial - ShareAlike| 4.0
International License
Revealing the sub-50 ms electrochemical conversion of
silver halide nanocolloids by stochastic electrochemistry
and optical microscopy
Jean-François Lemineur, Jean-Marc Noël, Catherine Combellas, Frédéric
Kanoufi
To cite this version:
Jean-François Lemineur, Jean-Marc Noël, Catherine Combellas, Frédéric Kanoufi.
Revealing
the sub-50 ms electrochemical conversion of silver halide nanocolloids by stochastic
electrochem-istry and optical microscopy.
Nanoscale, Royal Society of Chemistry, 2020, pp.15128-15136.
Revealing the sub-50ms electrochemical conversion of silver
halide nanocolloids by stochastic electrochemistry and optical
microscopy
Jean-François Lemineur,a Jean-Marc Noël,a Catherine Combellasa and Frédéric Kanoufi*a
Silver based ionic cristal nanoparticles (NPs) are interesting nanomaterials for energy storage and conversion, e.g. their colloidal solutions could be used as a reversible redox nanofluid in semi-solid redox flow cells. In this context, the reductive transformation of Brownian silver halide, AgX, NPs into silver NPs is probed by single NP electrochemistry, complemented by an operando high resolution monitoring. However, their light sensitivity and poor conductivity make the
operando monitoring of their chemical activity challenging. The electrochemical collisions of single AgX NPs onto a
negatively biased electrode evidence a full conversion through multiple reduction steps within 3-10 ms. This is further corroborated by simulation of the conversion process and operando through a high resolution optical microscopy technique (Backside Absorbing Layer Microscopy, BALM). Both techniques are interesting strategies to infer at the single NP level the intrinsic charge capacity and charging rate of redox active Brownian nanomaterials, demonstrating the interest of the fast and reversible AgX/Ag system as a redox nanofluid.
Introduction
There is considerable interest in describing the electrochemical (EC) activity of individual nanoparticles (NPs) owing to their increased importance in many energy related applications, such as photovoltaics1 or the electrocatalytic activation of small molecules for water splitting, fuel cells, or CO2
reduction.2
Among the various published works within the past decade, two methodologies have been explored to carry out these stochastic studies, depending on whether the NPs are moving in solution (Brownian) or immobilized (adsorbed) on an electrode surface.3
The first one, introduced by Lemay’s group,4 is based on the detection of stochastic EC signals. It consists in resolving in time the collision of individual NPs with a sensor small enough for each single collision to result in a measurable EC signal. Different EC NP collision or EC nanoimpact strategies have been proposed by Bard,5 Compton6 and others,7 depending on whether the NPs are insulating, or can be electrochemically converted or possess catalytic activities.
As for the second one, it consists in using a means to spatially resolve individually the NPs in order to characterize or image their EC properties.8 Different approaches have been proposed, using either local EC probes,9 or the confinement of an electrolytic cell around the NP of interest,10 or the use of complementary observations by high spatial resolution microscopies,11 operated either ex situ12 or in situ.13-15
While they do not rival electron microscopy (TEM)12,13 in terms of resolution, optical microscopies offer an interesting compromise regarding throughput, image rate and the variety, size of NPs or processes that can be imaged during EC solicitation. Different mechanistic insights can be gathered from the change in optical properties of single NPs associated to their electrochemistry, ranging from double layer charging at Au NPs,16 Au oxide formation,17 reductive growth of Ag NPs,18 their oxidative dissolution or oxidation into
pseudo-halides19 or the growth, electrocatalysis and doping of Co oxide particles.20,21 They also have the advantage of being able to monitor in situ both type of configurations (Brownian and adsorbed NPs).22-26
At first sight, these two configurations are aiming at different objectives. The first one is seeking to probe the intrinsic EC activity of NPs, while the second one is closer to their monitoring under real conditions in real system (operando approach). Yet among common features, they particularly agree to show the importance of dynamics (motion or force) associated to the EC solicitation of isolated NPs.
This is manifested by the displacement of the supposedly adsorbed NPs during their conversion or during an electrocatalytic reaction,12b while Brownian NPs can intermittently leave the electrode during their EC transformation, which then results, for a single NP in discrete multiple oxidation steps.23-30 In some extent this motion may be beneficial for the transformation efficiency of Brownian NPs, as it can expose new reactive sites to the electrode, particularly interesting during NP over-oxidation which can lead to the local growth of poorly conducting materials such as oxides.31
Though not formalised in this way, the implementation of motion of colloidal NP solutions has recently attracted interest in high energy density EC storage processes, such as redox flow batteries, whose advantage is that they decouple the energy storage components (active redox species stored in tanks) from the power component (electrode materials). However, the available energy density is limited by the concentration of the redox active species used (about 1M). An increase by one order of magnitude in capacity can be foreseen if one considers the flow of suspensions of NPs, i.e. nanofluids, of energy dense active materials, in what is known as semi-solid flow cells.32
In this respect, EC collision strategies could be relevant for the screening of the energy or power capacity of electroactive NPs material candidates for semi-solid flow batteries. Few EC collision works are related to such candidates, likely since most
of those reported in real systems are ionic crystals or metal oxides. If these materials allow reversible charge storage it is often at the cost of slow or sluggish transfer rates in the absence of additives such as conducting binder.
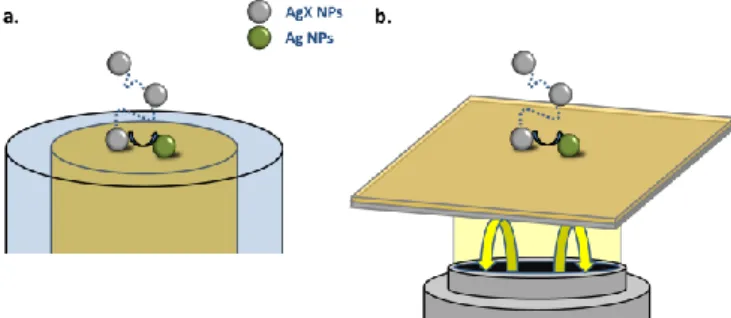
Silver-zinc batteries are challenging the Li ion ones in terms of safety, recyclability, or even energy density. If colloidal Ag based ionic NPs could be reversibly converted into colloidal metallic Ag NPs they may find interest as a nanofluid in semi-solid redox flow batteries. The oxidation of single colloidal Ag NPs into silver oxide (AgO)29,31 or silver halide (AgX)19,29 NPs has been previously reported. We focus here on the reverse reaction, and study the EC reduction of CTAB-capped AgX ionic colloidal NPs into metallic Ag NPs. If earlier single silver-based ionic NP (AgO or AgX) studies suggest that this conversion is reversible but may be incomplete29 or proceed to completion,33,34 the conversion rate seems to depend on whether Brownian colloids in solution (<0.1s)29,33 or CTAB-capped AgX NPs immobilized on an electrode (>1s)34 are considered. The difference may be due to the NP size, composition or capping agent,35 but also to its interaction with the electrode surface29b and its mobility (Brownian vs surface-bound). This transformation is then monitored herein from single stochastic NP EC-optical experiments, as schematized in Figure 1a: the current transient associated to the collision of individual colloidal CTAB-capped AgX NPs is recorded at a gold disk ultra-microelectrode (UME). In addition an operando optical monitoring of such single NP collision is performed in the same solution, using an optically transparent Au substrate as a polarized working electrode (Figure 1b).
AgX nanomaterials are very challenging to image in situ. They are easily reduced by electron beams employed in electronic microscopies. In addition, AgX NPs are non-plasmonic in the visible region in the absence of metallic silver and are therefore less easily detected in classical optical dark-field microscopy. Using a highly sensitive optical microscopy, Backside Absorbing Layer Microscopy (BALM), it is possible to image non plasmonic NPs.18b,34 We recently inspected the EC reduction of single AgX NPs adsorbed on an electrode surface. The individual NP conversion rate (AgX into Ag) was too slow (of the order of the second) to be coped by EC means but was quantified in situ and in real time by BALM.34 We particularly showed the reduction was occurring, to completion, through local charge injection, resulting in discrete motion-steps of the NPs associated to discrete transformation steps. BALM will then be used here too to monitor and therefore complement the stochastic reductive EC collision of single AgX NPs.
Figure 1. Scheme of the two experimental setups, using (a) an UME electrode and (b) an optical BALM sensor, for probing the stochastic EC collision of single AgX NP on gold electrode surface.
Results and discussion
A. EC collisions of AgX NPs
Experimentally, AgX NPs were obtained by mixing a solution of AgNO3 with a solution of NaCl at room temperature in the
presence of cetyltrimethylammonium bromide, CTAB, used as stabilizing and capping agent.36,37 Details concerning the AgX NP synthesis are included in the experimental section. The resulting NPs were deposited onto a gold surface and firstly characterized by scanning electron microscopy (SEM). As observed in Figure 2a, the NPs exhibit a spherical shape. From the size dispersion graph, plotted from SEM image treatment, their diameter is ~100nm (90 ± 30nm based on Figure 2b). The NPs electroactivity was first investigated by cathodic particle coulometry, similarly to that developed by Compton and co-workers for oxidative dissolution of metallic6 or reductive conversion of Hg2Cl2,38 AgBr,33 or AgO29a NPs.
Subjected to Brownian motion in solution, the NPs hit stochastically the surface of the gold UME biased at E=-0.7V vs Pt wire, a potential sufficiently negative to ensure AgX reduction. During their collision with the UME, the AgX NPs are expected to be transformed into metallic silver NPs:
AgX + eˉ
→
Ag + Xˉ (1) The EC reaction results in a cathodic current spike for each NP colliding the UME. The chronoamperometric transient recorded during AgX NP collisions is presented in Figure 2c for an electrode biased at -0.7V vs Pt.The NP content of the solution can be inferred from the frequency of EC collisions. The theoretical frequency, f, of stochastic NP collisions limited by diffusion arrival of NPs from a CNP = 400 pM concentration solution to a a=12.5µm radius
disk UME is given by:
f = 4 DNPCNPa (2)
with DNP the NP diffusion coefficient given by Stokes-Einstein
relationship DNP=kBT/3dNP. For a 100nm spherical NP (DNP =
4.4 µm2/s), a theoretical frequency f = 53 Hz is expected. The measured frequency of the stochastic EC collisions of the AgX NPs on the gold UME is 5 Hz, 1 order below the theoretical frequency. Such discrepancy has often been observed and rationalized from different arguments, such as NP-electrode surface interactions28 or incomplete transformation yielding current spikes that could not be detected.
Figure 2. (a) SEM image of AgX NPs adsorbed on a gold electrode. (b) Size dispersion
graph of the AgX NPs plotted from SEM image analysis. (c) Amperometry at a gold electrode polarized at -0.7V vs Pt and recorded at 0.5kHz, showing EC collisions of individual AgX NPs. (d) Size dsitribution of AgX NPs plotted from the amperometry presented in (c) and (e). The EC size distribution is weighted by the NPs average size of the binning.30 (e) Zoom at an individual EC spike recorded in (c) corresponding to a
single ~100nm AgX NP collision. (f) Discrete NP collision events assigned to the reduction of a single ~100nm AgX NP recorded at 100 kHz with a current amplifier.
Assuming a complete EC conversion of the AgX NPs into Ag NPs, according to equation 1, the size of individual AgX NPs,
dNP, can also be inferred from the charge, Q, of the individual
stochastic current spikes present in the amperometric traces:
Q = FdNP3/6Vm,AgCl (3)
where F is the Faraday’s constant and Vm,AgX is the molar volume of AgX (Vm,AgX=27.5±1.5 cm3/mol for composite ranging between either AgCl or AgBr). For example the current spike zoomed in Figure 2e with a 2.2pC charge corresponds to the EC collision of a 100nm AgX NP. The distribution of NP sizes inferred from the current spike charges (Figure 2d) is comparable to that obtained from SEM analysis in Figure 2b except for the smallest NPs, which are difficult to discriminate from the EC noise level (the charge for a 35nm AgX NP corresponds to a 0.1pC charge spike). Zoom at individual EC spikes, as in Figure 2e, recorded at a frequency of 0.5kHz suggests that the reduction of individual AgX NPs is completed within <10ms. This is comparable to the spikes recorded during the reduction of AgBr or AgO Brownian NPs29,33 but 3 orders of magnitude faster than the conversion rate estimated optically for the same AgX NPs adsorbed on a BALM electrode.34
This points that the comparison of the EC reactivity of surface-immobilized or Brownian NPs, for example using the two methodologies discussed in the introduction may be misleading, as a result of differing dynamics contributions.
Besides, one could argue that the NPs are only partially converted during the EC collisions.29 Indeed the slow diffusion of Ag+ ions within AgX ionic solid (of the order of D = 10-11 cm2/s)39 suggests that the diffusion-limited conversion of a dNP=100nm spherical NP would require
34,40,41
at least t=dNP 2
/4D =0.25s, an order of magnitude longer than the observed 10ms. However, the reduction of AgX generates a metallic and conducting material, which speeds up the NP conversion. We have modelled this mechanism considering, along with the limiting Ag+ ion transport in the NP, the hopping of electron, eAgˉ vehiculated by Agcat sites acting as catalytic relays, to
adjacent unreduced AgX sites within the NP.34 This is schematized by the following homogenenous electron transfer reaction:
Agcat + eAgˉ + AgX
→
Agcat + Ag + Xˉ (4)characterized by a rate constant kex, in s -1
.42 By differentiating the simulated AgX content, nAgX, along time, the EC current
transient associated to the transformation is evaluated:
iconv = FdnAgX/dt (5)
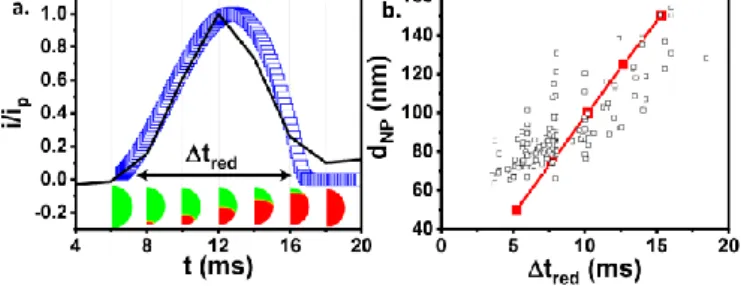
Figure 3a shows the simulated current transient, compared with the experimental transient presented in Figure 2e. This was obtained, considering D=10-11 cm2s-1, with a hopping rate constant kex=15x10
3
s-1. Along with the transient currents are given the simulated AgX (in green) contents within the NP, every 2ms after the NP contact with the electrode. The full conversion into Ag corresponds to the red color. The sharp reaction layer (<5nm) between the regions of unconverted AgX and fully converted Ag results from a fast hopping reaction, which mimics the separation of both phases.
The effect of NP size on the duration of the simulated and experimental EC conversions of individual NPs is also presented in Figure 3b. The experimental duration of the stochastic current transient associated to an individual NP reduction increases linearly with the NP size (inferred from the charge of the current transient). If for a diffusion controlled process one would expect a quadratic relationship (tred
~dNP2), the linear variation between tred and dNP is rather in
favor of a kinetic limitation by surface transformation. The electron hopping at the moving interface between AgX and Ag materials in the NP also introduces such kinetic limitation. Indeed, the simulation considering the electron hopping situation (Figure 3b, red line) predicts a linear variation between tred and dNP .
The overall agreement between the simulated and experimental currents suggests that electron transport through the conductive Ag material and hopping to AgX region for its reduction explain the fast and complete conversion of AgX ionic NPs into conducting Ag NPs.
Figure 3. Simulated current transient for the electrochemical conversion of AgX NPs upon charge transfer hopping mechanism. a) Experimental EC collision of single AgX NP (black trace) of figure 2e normalized by the current peak (ip) and its simulated
conversion current () using dNP = 100nm, solid-state diffusion coefficient D= 10-11
cm2s-1 and hopping rate constant k
ex=15x103 s-1. The concentration profile taken every
2ms associated to the transformation of the NP is also shown (green 100% AgX, red 100% Ag). b) Evolution with the NP size of the experimental () and simulated () duration of the EC collision transients, extracted from the transients as in a).
The fact that the conversion is complete fits with the conclusion drawn from the surface-bound AgX NPs.34
However, the much faster kinetics may seem surprising. For surface-bound NPs the conversion was also shown to proceed by successive steps accompanied by NP motion over the electrode surface. If similar multi-step reduction occurred for Brownian NPs, faster dynamics (exploration of the solution upon escape from the electrode) is expected, which could explain the faster overall conversion of the Brownian NPs. This hypothesis was then investigated by two different approaches: by resolving the conversion kinetics when increasing the EC acquisition frequency, and by monitoring this conversion by optical microscopy.
The dynamics of the reduction process was first analyzed using a higher acquisition frequency current amplifier. Typical EC transients probed at 100kHz are given in Figure 2f and in ESI. They show that the transformation can be segmented into multiple steps, typically between 2 and 4 steps <2ms long each. The overall transformation of individual NPs is 3-10ms, in agreement with the events recorded at lower frequency (for example in Figure 2e). Moreover, the estimate of the overall charge exchanged during a multi-step collision event (~0.5 to ~2pC corresponding to size from ~60 to ~150nm) is within the range of the AgX NP sizes, as evidenced by SEM and by EC transients recorded at lower frequency (Figure 2b and 2d respectively), attesting of the full reduction of AgX NPs to Ag. The presence of multiple <2ms reactive collision events is consistent with those observed during the oxidation of Ag NPs into soluble Ag+ ions27,28 or into AgCl29 or AgO NPs and during their reverse reduction.29 The <1ms duration between steps is consistent with diffusion of the NP into the solution (with DNP =
4.4µm2/s) and possible re-exploration of the electrode, as demonstrated from simulations.28,43 The multistep reduction is also common to both Brownian and surface-bound AgX NPs. The 3 orders of magnitude much shorter step duration of Brownian NPs is also consistent with the difference of NPs diffusion rate. Indeed the diffusion of the surface-bound NP, DNP,surf = 5x10²nm²/s,34 is 4 orders of magnitude lower than in solution. The average time necessary for the NP to go from an initial reactive position to a new reactive one is known as the mean first-time passage. As a rule of thumb, it scales as the inverse of the NP diffusion coefficient,44 explaining the observed differences in conversion rates between surface-bound and Brownian NPs.
B. BALM monitoring of stochastic single AgX NPs EC collisions
Owing to the contrasting conversion time of the same AgX NPs depending on whether they are in solution or surface-bound, we have monitored the stochastic EC collisions of single Brownian AgX NPs on a BALM opto-EC sensor. BALM is indeed able to image and distinguish AgX NPs from Ag NPs. In BALM,
an ultra-thin gold surface is used both as an electrode and as an optical sensor allowing to record, in a reflection-mode, “optical nano-collisions” in an EC environment (EC-BALM). Briefly recalling its principle, in BALM, in analogy with other reflection mode microscopies,45 the optical signal (Iopt) collected by the camera is due to the interference between the far field scattered by the NPs (Escat) and the far field reflected (Eref) by the BALM substrate:
(6)
where θrs is the phase lag between Eref and Escat. Working under low-reflection conditions (small values of Eref), which is expected for the pseudo anti-reflecting BALM substrates, the interference term (last term in eq. 6) dominates. It is extremely useful as the amplitude of the NP scattering field scales with dNP3, while the scattering intensity usually recorded under dark-field conditions, scales as dNP6. Equation (3) suggests that poorly scattering NPs, such as non-metallic ones, can be more readily detected.
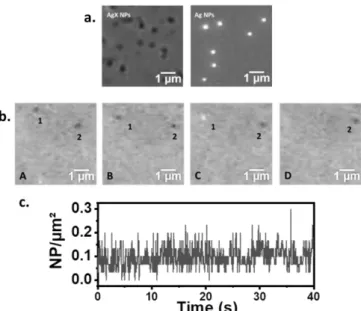
Figure 4a presents the experimental optical images for 100nm AgX or Ag NPs, respectively, pre-adsorbed on the BALM sensor, and recorded in electrolytic solution (absence of polarization of the Au surface). As previously modelled, the AgX NPs adsorbed on the optical sensor appear as dark contrast features while Ag NPs result in bright contrast features; indeed, the BALM setup allows discriminating the two kinds of NPs without the need of a spectrometer, which would inevitably reduce the time resolution of the microscope.19
The stochastic collisions on the BALM sensor of single Brownian AgX NPs were imaged at a frequency of 20 frames per second. An EC cell is formed by confining a droplet of electrolyte above the sensor biased at -0.8V vs Pt acting as a working electrode, as schematized in Figure 1b. Many Brownian AgX NPs are detected next to the electrode surface and appear mostly as dark contrast features, at different positions and different times over the BALM sensor. It is illustrated in the image sequence of Figure 4b over a 5x5µm2 selected region of interest (ROI). It suggests that under the present experimental conditions, AgX NPs are not irreversibly adsorbed on the gold surface, where they are rather bouncing. The optical features have been counted over time on the ROI images. The number of NPs in motion in each image remains constant and amounts to ~0.1NP/µm² as presented in Figure 4c (in the ROI of Figure 4b, 2 NPs over 25µm2) or on larger imaged area (Figure ESI 2). For a 400pM NP concentration (i.e. 0.24NP/µm3) this suggests that the BALM setup probes NPs within a ca. 0.4µm thickness of solution above the substrate, which is consistent with the ca. 0.39µm depth of field (dof) expected for the numerical aperture, NA = 1.4, of the oil immersion BALM objective (dof = noil/NA2 = 0.39µm for
Figure 4. a) Experimental optical images recorded after adsorption of 100nm AgX NPs and Ag NPs at the Au optical sensor/electrode surface. (b) Images sequence recorded at 50ms intervals during the EC conversion of AgX NPs into Ag NPs. (c) Fluctuation of NPs number with time estimated from (b).
Among the probed thicknesses, <25% of the detected features are bright as confirmed on a larger imaged surface area (Figure ESI2); assuming that these bright features are Ag NPs, their average concentration in the electrode vicinity is at least 0.06NP/µm3. It has also been noted that AgX NPs colliding with the electrode surface do not always result in an EC transformation. Indeed, in several cases AgX NPs hit the Au electrode surface and go back in solution while unaltered optically. It is in agreement with the stochastic EC collision experiment and explains why the collision frequency recorded at the UME (f=5Hz) is much lower than the theoretical frequency (of 53 Hz). This results from the experimental configuration. Both optical and EC collisions experiments were performed directly from the batch synthetic solution, containing an excess of CTAB surfactant. CTAB is expected to adsorb onto the electrode surface (UME or BALM sensor) henceforth repelling the CTAB-capped AgX NPs, explaining both the absence of NPs adsorption and the low collision frequency.
Occasionally, the event of disappearance of a dark feature and the concomitant appearance of a bright feature within NP diffusion distance, (at maximum 1x1 µm2 region of the electrode), can be detected upon two successive images. In Figure 4b, two AgX NPs (dark features 1 and 2 in A and B) are randomly moving on the electrode surface until the contrast of one of the two (labeled as 1, in C) suddenly changes to bright. Once transformed, the bright NP leaves the field of view (image D). Such event most likely corresponds to the EC transformation of the dark AgX NP into a bright Ag NP. Noteworthy, another possibility is the sequential escape of the AgX NP and concomitant arrival of an independent Ag NP within the same electrode area. The probability, PN, of finding N
independent Ag NPs in the probed volume (vp= 1x1x0.4µm3) centered at the AgX NP position in the latest image is expected to follow a Poisson distribution:
PN = <Ag>Ne-<Ag>/N! (7)
where <Ag> is the average number of Ag NPs in the probed volume,
vp. It is estimated to 0.022NP/µm3, based on the 9% collision
frequency, estimated at the UME (meaning a 9% transformation rate of AgX NPs), and the total number of AgX NPs present in the probed volume (0.25NP/µm3). The probability of incoming of N=1 Ag NP in this region is lower than P1= 2.2%, which is less likely than
the probability of an effective conversion of AgX into an Ag NP (9%). As suggested from the EC collision transients, the transformation dynamics is very fast as the transition between dark and bright contrast features for single NPs occurs within two frames (a time delay of 50ms). An example of such process is shown in Figure 5, which represents the optical profile of the whole transformation process of a single collision event. After the first 2.5s, which display the background intensity, the optical intensity abruptly decreases as the AgX NP reaches the electrode surface. The NP wanders over the surface for 300-400ms without any transformation as the intensity remains constant. The NP indeed remains optically visible while it is in the near-wall hindered diffusion region. Then, the optical intensity suddenly changes, becoming bright (above the background level) within 50ms (1 frame) and rapidly decreases to the background level. This change reflects the reduction of AgX to Ag followed by the expulsion of the NP in solution. The expulsion of the converted NP from the dof results from both the faster stochastic diffusion of the smaller (more dense) Ag NP, and halide ions release that were shown to propel the NP upon its conversion.34,46
Figure 5. Optical transient recorded during the collision followed by EC conversion of a single AgX NP, then escape from dof of the resulting Ag NP. Theoretical lines represent the background (blue) and the intensities for a 0 (black) and 100% (red) reduction of a 100nm AgX NP into a 70nm Ag NP.
Considering a full transformation of AgX to Ag, one can also use optical modeling to directly size the NPs, as previously demonstrated for surface-bound AgX NPs.34 In Figure 5, the theoretical lines correspond to the optical intensity relative to background level (blue trace) predicted for a 100nm AgX NP (black trace) and its respective complete transformation into a 70nm Ag NP (red trace). The intensity variations recorded optically during the complete transformation of a single NP match the prediction. It is then verified that the single NP transient in Figure 5 corresponds to the complete EC transformation of a 100nm AgX NP, corroborating the charge distribution obtained from the electrochemical collision experiments. The procedure has been repeated and confirmed for N=50 different NP transformation events. Even if the time resolution of BALM cannot decipher the whole dynamics of the transformation of a Brownian NP, it supports the hopping mechanism and the <10ms cathodic current spikes recorded electrochemically (vide supra). It further suggests that quantitative optical monitoring allows determining the size and conversion of the NPs.
Conclusions
NP coulometry is used in combination with the EC-BALM technique to analyze single AgX NP collisions at a negatively biased gold electrode surface. It is evidenced electrochemically with an UME connected to a current amplifier that AgX NP transformation occurs through multi-step reduction and leads to a complete reduction into Ag NPs. The obtained size dispersion histogram is in agreement with the one constructed from SEM. Both the characteristic durations (3-10ms) of the EC collision transients of single AgX NPs and their scaling with the NP size suggest, based on simulated transients, the conversion is controlled by an homogeneous charge transfer hopping within the NP.
In order to confirm such fast transformation events, they are probed by an interferometric optical microscopy (BALM), as it allows discriminating AgX NPs appearing as dark contrast features from metallic Ag NPs resulting in bright contrast features. Optical transients allow probing single NP collision and conversion at a transparent electrode. Such optical nanocollisions explain the low EC collision frequency in coulometry and confirm that NP collisions with the electrode surface yield their complete conversion. Finally, both EC and optical information confirm the up to 3 orders of magnitude faster conversion for Brownian NPs than for their surface-bound counterparts, which is related to differences in dynamic (transport and hopping charge transfer) involved during the reduction of the Brownian NPs. The fast reversible and complete conversion of AgX NPs into Ag NPs is comparable to the reverse reaction: the oxidation of Ag NPs into AgX NPs. This should make the Ag/AgX Brownian NPs an interesting candidate as a redox nanofluid in semi-solid redox flow cells. Meanwhile EC collision strategies provide a unique means to screen those nanofluid potentialities by probing the intrinsic charge capacity and charging rate of its individual NP constituents.
Experimental
NPs and chemicals. The analytical grade chemicals were obtained
from Sigma-Aldrich and were used without further purification. Solutions were prepared with ultrapure water with a resistivity higher than 18.2MΩ.cm. Ag NPs came from a commercial colloidal solution (Sigma-Aldrich, concentration of 0.05mg/mL, capped by sodium citrate and dispersed in a citrate buffer). AgX NPs were synthesized through the following procedure. First, 1mL of NaCl (0.5M) in ultrapure water was mixed with an aqueous solution of cetyltrimethylammonium bromide (2mM). 1mL of AgNO3 (0.5M in
ultrapure water) was then added dropwise and under constant stirring to form a 100mL stock solution. The mixture was further stirred at room temperature for 3h and became opaque and white. No precipitate was observed and the colloidal solution was stored under light protection and at temperature of 4°C until use. Dropwise precipitation of silver ions with a mixture of both Cl- and Br- usually results in two distinct phases because the solubility product constants of AgCl and AgBr are different. We assume that the co-precipitation reaction has led to a binary mixture of AgCl and
AgBr NPs.36 The unimodal size distribution in Figure 2b,d suggests AgCl and AgBr NPs cannot be differentiated by SEM images or electrochemically. Indeed, the conversion was studied here at sufficiently negative potential to ensure mass transfer limited conversion of either material, preventing also an electrochemical differentiation. The comparable values of AgCl and AgBr refractive indexes also suggest they cannot be differentiated optically.34
UMEs preparation. Ultra-micro-electrodes were fabricated
in-house. They were machined using borosilicate glass capillaries (Sutter instruments, Novato, California) with outer and inner diameters of 1.0 and 0.5mm, respectively. 25µm diameter gold wires (99.99%, Goodfellow, Cambridge Ltd., Huntingdon, England) were inserted into the capillaries and sealed with a laser pipette puller (Narishige, Model PC-10, London, U.K.) in order to obtain 25µm diameter disc electrodes characterized by a ratio between the insulating glass radius and the gold wire radius equal to 10. The UMEs were finally polished with aluminum oxide tape (3µm from Precision Surfaces International, Houston, Texas, USA).
EC and EC-BALM setup. The stochastic EC collisions of NPs were
recorded in a 2-electrode system using an Au UME as the working electrode and a Pt wire as both counter and pseudo-reference electrodes. The current transients were measured at 500Hz bandwith (1kHz sampling rate) by a CH760 potentiostat (IJCambria, UK). Current transients at 100kHz bandwidth (200kHz sampling rate) were recorded in the same configuration with a low noise current amplifier (Element eONE). The full description of EC-BALM has been published elsewhere.18b,47 Briefly, the visualization is based on a pseudo-antireflective optical sensor (here composed of a thin gold layer of ~10nm thickness deposited on a glass slide). Optical sensors were purchased from Watch Live SAS France, and used as received. The sensor was placed on a Zeiss Axiovert inverted microscope and was illuminated from the backside (the glass side) through a 63x oil immersion objective (Zeiss Plan Apochromat, NA=1.40) with a non-polarized white light. The reflected light was collected through the same objective by a CMOS camera (IDS). For opto-EC experiments, the gold film was used as a working electrode in a 2-electrode configuration. A platinum wire was employed as a counter/pseudo-reference electrode and put inside a micro-pipette. The micropipette was machined from the same type of capillaries used for the UMEs and was stretched and cut with the laser puller. The obtained pipette was finally polished up to a diameter of roughly 50 µm. Prior to the electrode insertion, the pipette was filled with the AgX colloidal solution and disposed upon the gold film in the way of a Scanning Electro-Chemical Cell Microscopy configuration.27c,48 The micropipette was then approached next to the surface with a XYZ micro-controller to form an EC cell. Electrodes were finally connected to a CHI 760 potentiostat in order to bias the working electrode at a sufficiently negative potential.
Modeling and data analysis. EC simulations were performed with
COMSOL Multiphysics® implementing the finite element method. Details related to the model, presented elsewhere,34 are recalled in the ESI. Optical simulations were obtained by a MATLAB® code adapted to the BALM configuration from the codes proposed by the Ûnlü’s group.45c The code simulates the scattering of a NP on a reflecting substrate by using a MATLAB toolbox allowing to solve
the Maxwell’s equation through the Boundary Element Method.49 Home-made Python routines were employed throughout the work to carry out the data processing.
Conflicts of interest
There are no conflicts to declare.
Acknowledgements
This work was financially supported by the Agence Nationale pour la Recherche, ANR, through NEOCASTIP ANR-15-CE09-0015-01 project, by the CNRS and through the Emergence call from Université de Paris within the Investissement d’Avenir program under reference ANR-18-IDEX-0001. We acknowledge the ITODYS SEM facility (Université de Paris, CNRS UMR 7086, Paris, France).
Notes and references
1 W. U. Huynh, J. J. Dittmer, A. P. Alivisatos, Science, 2002, 295, 2425-2427.
2 Z. W. Seh, J. Kibsgaard, C. F. Dickens, I. Chorkendorff, J. K. Nørskov, T. F. Jaramillo, Science, 2017, 355, 1-12.
3 S.-M. Lu, Y.-Y. Peng, Y.-L. Ying, Y.-T. Long, Anal. Chem., 2020,
92, 5621-5644.
4 B. M. Quinn, P. G. Van’t Hof, S. G. Lemay, J. Am. Chem. Soc., 2004, 126, 8360-8361.
5 X. Xiao, A. J. Bard, J. Am. Chem. Soc., 2007, 129, 9610-9612. 6 Y.-G. Zhou, N. V. Rees, R. G. Compton, Angew. Chem. Int. Ed., 2011, 50, 4219-4221.
7 (a) K. Tschulik, K. J. Stevenson, Curr. Op. Electrochem., 2017, 1, 38-45; (b) L. K. Allerston, N. V. Rees, Curr. Op. Electrochem., 2018, 10, 31-36; (c) Z. Sun, M.E. Hafez, W. Ma, Y.-T. Long, Sci.
China Chem., 2019, 62, 1588-1600.
8 (a) Y. Wang, X. Shan, N.J. Tao, Faraday Discuss., 2016, 193, 9-39; (b) see the thematic issue from Acc. Chem. Res., 2016, 49, 2371.
9 (a) M.V. Mirkin, T. Sun, Y. Yu, M. Zhou, Acc. Chem. Res., 2016, 49, 2328-2335 ; (b) T. Sun, D.C. Wang, M.V. Mirkin, H. Cheng, J. Zheng, R.M. Richards, F. Lin, H.L. Xin, Proc. Nat. Acad. Soc., 2019, 116, 11618-11623; (c) J. Kim, C. Renault, N. Nioradze, N. Arroyo-Currás K.C. Leonard, A. J. Bard, Anal. Chem., 2016, 88, 10284-10289. 10 C.R. Bentley, M. Kang, M., P. R. Unwin, Curr. Op.
Electrochem., 2017, 1, 23-30.
11 (a) C. L. Bentley, P. R. Unwin, Faraday Discuss., 2018, 210, 365-379; (b) C. L. Bentley, M. Kang, P.R. Unwin, J. Am. Chem.
Soc., 2019, 141, 2179-2193.
12 (a) H. E. M. Hussein, R. J. Maurer, H. Amari, J.J.P. Peters, L. C. Meng, R. Beanland, M. E. Newton, J. V. Macpherson, ACS Nano, 2018, 12, 7388-7396; (b) J. Ustarroz, I. M. Ornelas, G. Zhang, D. Perry, M. Kang, C.L. Bentley, M. Walker, P.R Unwin, ACS Catal.,
2018, 8, 6775-6790.
13 R. L. Harniman, D. Plana, G. H. Carter, K. A. Bradley, M. J. Miles, D. J. Fermin, Nat. Comm., 2017, 8, 971.
14 (a) A. Radisic, P. M. Vereecken, J. B. Hannon, P. C. Searson, F. M. Ross, Nano Lett., 2006, 6, 238-242; (b) L. Lutz, W. Dachraoui, A. Demortière, L. R. Johnson, P. G. Bruce, A. Grimaud, J.-M. Tarascon, Nano Lett., 2018, 18, 1280-1289.
15 W. Wang, Chem. Soc. Rev., 2018, 47, 2485-2508.
16 (a) C. P. Byers, B. S. Hoener, W.-S. Chang, S. Link, C. F. Landes,
Nano Lett., 2016, 16, 2314-2321; B. S. Hoener, S.R. Kirchner, R.S.
Heiderscheit, S.E. Collins, W.-S. Chang, S. Link, C. F. Landes,
Chem., 2018, 4, 1560-1585.
17 (a) C. Jing, F. J. Rawson, H. Zhou, X. Shi, W.-H. Li, D.-W. Li, Y.-T. Long, Anal. Chem., 2014, 86, 5513-5518; (b) C. Jing, Z. Gu, Y.-Y.-T. Long, Faraday Discuss., 2016, 193, 371-385.
18 (a) C. Hill, S. Pan, J. Am. Chem. Soc., 2013, 135, 17250-17253; (b) J.-F. Lemineur, J.-M. Noël, D. Ausserré, C. Combellas, F. Kanoufi, Angew. Chem. Int. Ed., 2018, 57, 11998-12002; (c) J.-F. Lemineur, J.-M. Noël, C. Combellas, D. Ausserré, F. Kanoufi,
Faraday Discuss., 2018, 210, 381-395.
19 (a) V. Brasiliense, P. Berto, C. Combellas, R. Kuszelewicz, G. Tessier, F. Kanoufi, Faraday Discuss., 2016, 193, 339-352; (b) K. Wonner, M. V. Evers, K. Tschulik, J. Am. Chem. Soc. 2018, 140, 12658-12661; (c) K. Wonner, M. V. Evers, K. Tschulik,
Electrochim. Acta, 2019, 301, 458-464 ; (d) K. Wonner, C.
Rurainsky K. Tschulik, Front. Chem., 2020, DOI: 10.3389/fchem.2019.00912.
20 V. Brasiliense, J. Clausmeyer, A. L. Dauphin, J.-M. Noël, P. Berto, G. Tessier, W. Schuhmann, F. Kanoufi, Angew. Chem. Int.
Ed., 2017, 56, 10598- 10601; (b) V. Brasiliense, J. Clausmeyer, P.
Berto, G. Tessier, C. Combellas, W. Schuhmann, F. Kanoufi, Anal.
Chem., 2018, 90, 7341-7348.
21 D. Jiang, Y. Jiang, Z. Li, X. Wo, Y. Fang, N. Tao, W. Wang, H.-Y. Chen, J. Am. Chem. Soc., 2017, 139, 186-192.
22 (a) S. Linlin, D. Jiang, M. Li, T. Liu, L. Yuan, W. Wang, H.-Y. Chen, Anal. Chem., 2017, 89, 6050-6055; (b) Y. Fang, W. Wang, X. Wo, Y. Luo, S. Yin, Y. Wang, X. Shan, N. Tao, J. Am. Chem. Soc., 2014, 136, 12584-12587; (c) S. Linlin, W. Wang, H.-Y. Chen,
ChemElectroChem, 2018, 5, 2995-2999; (d) S. Linlin, Y. Fang, Z. Li,
W. Wang, H.-Y. Chen, Nano Res., 2017, 5, 1740-1748.
23 R. Hao, Y. Fan, B. Zhang, J. Am. Chem. Soc., 2017, 139, 12274-12282.
24 (a) V. Brasiliense, A. N. Patel, A. Martinez-Marrades, J. Shi, Y. Chen, C. Combellas, G. Tessier, F. Kanoufi, J. Am. Chem. Soc., 2016, 138, 3478-3483; (b) A. N. Patel, A. Martinez-Marrades, V. Brasiliense, D. Koshelev, M. Besbes, R. Kuszelewicz, C. Combellas, G. Tessier, F. Kanoufi, Nano Lett., 2015, 15, 6454-6463.
25 (a) J.-F. Lemineur, T. J. Stockmann, J. Médard, C. Smadja, C. Combellas, F. Kanoufi, J. Anal. Test., 2019, 3, 175-188; (b) H.-B.
Chen, D. Jiang, Y.-N. Liu, C. Qian, X.-L. Zhou, X.-W. Liu, Environ. Sci.
Technol. Lett., 2020, 7, 298-302.
26 C. Ma, W. Wu, L. Li, S. Wu, J. Zhang, Z. Chen, J.-J. Zhu, Chem.
Sci., 2018, 9, 6167-6175.
27 a) S.M. Oja, D.A. Robinson, N.J. Vitti, M.A. Edwards, Y. Liu, H.S. White, B. Zhang, J. Am. Chem. Soc., 2017, 139, 708-718; (b) D. Robinson, Y. Liu, M.A. Edwards, N.J. Vitti, S.M. Oja, B. Zhang, H.S. White, J. Am. Chem. Soc., 2017, 139, 16923-16931. (c) J. Ustarroz, M. Kang, E. Bullions, P.R. Unwin, Chem. Sci., 2017, 8, 1841-1853.
28 W. Ma, H. Ma, J.-F. Chen, Y.-Y. Peng, Z.-Y. Yang, H.-F. Wang, Y.-L. Ying, H. Tian, Y.-T. Long, Chem. Sci., 2017, 8, 1854-1861. 29 (a) M.E. Hafez, H. Ma, Y.-Y. Peng. W. Ma, Y.-T. Long, J. Phys.
Chem. Lett., 2019, 10, 3276−3281. (b) H. Ma, J. Chen, H. Wang,
P. Hu, W. Ma, Y.-T. Long, Nat. Commun., 2020, 11, 2307. 30 C.A. Little, R. Xie, C. Batchelor-McAuley, E. Kathelhon, X. Li, N.P. Young, R.G. Compton, Phys. Chem. Chem. Phys., 2018, 20, 13537-13546.
31 (a) V. Sundaresan, J.W. Monaghan, K.A. Willets, J. Phys. Chem.
C, 2018, 122, 3138-3145; (b) F. Zhang, P.A. Defnet, Y. Fan, R.
Hao, B. Zhang, J. Phys. Chem. C, 2018, 122, 6447-6455.
32 M. Duduta, B. Ho, V.C. Wood, P. Limthongkul, V.E. Brunini, W.C. Carter, Y.-M. Chiang, Adv. Energy Mater., 2011, 1, 511-516. 33 T.R. Bartlett, S.V. Sokolov, R.G. Compton, Chem. Open, 2015,
4, 600-605.
34 J.-F. Lemineur, J.-M. Noël, A. Courty, D. Ausserré, C. Combellas, F. Kanoufi, J. Am. Chem. Soc., 2020, 142, 7937-7946. 35 B.J. Plowman, K. Tschulik, N.P. Young, R.G. Compton, Phys.
Chem. Chem. Phys., 2015, 17, 26054-26058.
36 (a) S.C. Abeyweera, K.D. Rasamani, Y. Sun, Acc. Chem. Res., 2017, 50, 1754-1761; (b) Z. Li, Y. Sun, J. Mater. Chem. A, 2013, 1, 6786-6793.
37 Y.-H. Li, P. Tan, X.-Q. Liu, D.-D. Zu, C.-L. Huang, L.-B. Sun, J.
Nanosci. Nanotechnol., 2015, 15, 4373-4379.
38 T.R. Bartlett, C. Batchelor-McAuley, K. Tschulik, K. Jurkschat, R.G. Compton, ChemElectroChem, 2015, 2, 522-528.
39 C. Alonso, R.C. Salvarezza, J.M. Vara, A.J. Arvia, Electrochim.
Acta, 1990, 35, 489-496.
40 H. Le, C. Lin, E. Kätelhön, R. G. Compton, Electrochim. Acta, 2019, 298, 778-787.
41 M. W. Glasscott, A.D. Pendergast, J. E. Dick, ACS Appl. Nano
Mater., 2018, 1, 5702-5711.
42 J.-M. Savéant, Chem. Rev., 2008, 108, 2348-2378.
43 E.J.F. Dickinson, N.V. Rees, R.G. Compton, Chem. Phys. Lett., 2012, 528, 44-48.
44 S. Kang, A. F. Nieuwenhuis, K. Mathwig, D. Mampallil, S. G. Lemay, ACS Nano, 2013, 7, 10931-10937.
45 (a) M. A. van Dijk, M. Lippitz, M. Orrit, Acc. Chem. Res., 2005,
38, 594-601; (b) K. Lindfors, T. Kalkbrenner, P. Stoller, V.
Sandoghdar, Phys. Rev. Lett., 2004, 93, 037401; (c) D. Sevenler, O. Avci, M. S. Ünlü, Biomed. Opt. Express, 2017, 8, 2976-2989; (d) M. Boccara, Y. Fedala, C. V. Bryan, M. Bailly-Bechet, C. Bowler. A. C. Boccara, Biomed. Opt. Express, 2016, 7, 3736-3746.
46 C. Zhou, X. Chen, Z. Han, W. Wang, ACS Nano, 2019, 13, 4064-4072.
47 S. Campidelli, Abou R. Khachfe, K. Jaouen, J. Monteiller, C. Amra, M. Zerrad, R. Cornut, V. Derycke, D. Ausserré, Science
Adv., 2017, 3, e1601724.
48 P. Saha, J. W. Hill, J.D. Walmsley, C.M. Hill, Anal. Chem., 2018,
90, 12832-12839.
49 U. Hohenester, A. Trügler, Comput. Phys. Commun., 2012, 183, 370-381.