Supplementary information
Xiaorui Zheng1, Bing Xu2, Shuo Li1, Han Lin1, Ling Qiu4, Dan Li3, Baohua Jia1*
1Centre for Translational Atomaterials, Swinburne University of Technology, Hawthorn, VIC 3122, Australia 2University of Fribourg, Department of Physics and Fribourg Center for Nanomaterials, Chemin du Musée 3, CH-1700 Fribourg, Switzerland
3Department of Chemical Engineering, The University of Melbourne, VIC 3010, Australia
4Shenzhen Geim Graphene Center, Tsinghua-Berkeley Shenzhen Institute, Tsinghua University, Shenzhen 518055, P. R. China
*Email: bjia@swin.edu.au
Ellipsometric measurements of GO in UV-Vis region
We have performed the ellipsometric measurements of a graphene oxide (GO) film in the ultraviolet-visible (UV-Vis) region (0.2 m to 1.6 m), which have been shown as dashed curves in Fig. S1 below. The index extracted by Kramers-Kronig (KK) method has also been plotted as solid curves in Fig. S1. It is evident that both ellipsometric method and KK method show a good agreement in the trend of dispersion relations of GO. The discrepancies are mainly observed in the shorter wavelength region, which are attributed to the methodology differences between ellipsometric method and KK method. Specifically, a freestanding GO film is used in KK method, whereas a GO film on a supporting substrate (e.g. cover slip) is required in ellipsometric method. The substrate introduces additional interfaces, roughness, multi-reflections and back reflections, which reduce the accuracy of the ellipsometric measurements. Furthermore, an additional substrate layer needs to be added in the ellipsometric modelling, which gives rise to challenges and inaccuracies in ellipsometric fitting process. These inaccuracies become more prominent in shorter wavelength due to the stronger dispersions of the substrate. But overall, a good agreement has been achieved for the curves measured by the two methods.
Fig. S1. The dispersion relations of GO measured by ellipsometric method (dashed curves) and extracted by KK method (solid curves) in the UV-Vis region.
Transmittance of GO film
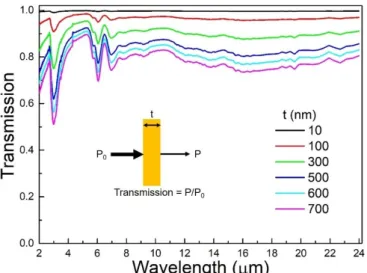
We have calculated the transmission (T) of the GO film with various thicknesses (t) in LWIR regime by using the Beer-Lambert law1:
T = P/P0 = 𝑒
‒ 𝛼·𝑡
where P0 and P are the intensities of the incident and transmitted beam, respectively.
is the absorption coefficient, calculated with the extinction coefficient (κ) by using As shown in Fig. S2, a transmittance around 90% for a GO film with the thickness 4𝜋𝜅
𝜆
up to 300 nm and a transmittance around 80% for a GO film with the thickness up to 600 nm have been illustrated, indicating the usability of GO film with reasonable thickness in the LWIR regime.
Fig. S2. The transmission of GO film with various thicknesses in IR regime. Inset: schematic figure of the Beer-Lambert law.
DLW of free-standing GO film
We have plotted the schematic figure showing the laser fabrication process of the polarizers, as shown in Fig. S3 below. First, we have prepared a glass slide with a round hole in the centre. Then we transferred the GO film onto the glass slide and covered the centric hole, yielding a freestanding area of the GO film above the centric hole. Then we covered the GO film with a standard cover slip with the thickness of 0.17 mm. A laser beam was focused through a high numerical aperture (NA = 0.95) objective to fabricate the grating structures in the GO film. Finally, after the laser fabrication, the cover slip was removed carefully without peeling off the GO film. Therefore, the freestanding GO film with the patterned grating area has been achieved and characterized using FTIR.
polarizers in top view (a) and side view (b).
FDTD simulation of the spectra of TE polarized light
Fig. S4. The simulated spectra of a GO polarizer (d = 1 m, a = 4 m, l = 2 m) under the TE polarization.
Pin hole system
The IR transmission spectra of the GO polarizers are measured by using the microscope FTIR spectrometer (Bruker V70 and Hyperion 2000). As shown in the schematic figure below (Fig. S5) of the setup, the incident IR light is focused through a FTIR condenser, which contains a wide range of incident angles from 12.5-29 degree. In order to achieve the normal incidence of the IR light, we have designed a pin hole system2, which
reduced the incident angle variations, e.g. ~ 5°. The sample has been placed on a tilted sample stage, facing normal to the incident beam coming out of the pin hole. The position of the pin hole (d) is determined by the numerical aperture of the condenser of the FTIR so that the pin hole locates in the central of the focused IR beam spot. The angle of the tilted sample stage () is determined by the position (d) and the height (h) of the pin hole. The size of the pin hole controls the allowed angle variations of the incident beam.
Fig. S5. Schematic figure of the pin hole setup for the transmission FTIR measurements.
ratio, but results in the increase of the incident angle variations, which will deteriorate the normal incidence condition. Therefore, we have observed a broadening of the resonances in the spectrum. On the other hand, a smaller pin hole will guarantee the normal incidence condition, whereas reduces the signal to noise ratio. In the manuscript, we have specifically used a smaller pin hole (incident angle variation ~ 5°) to ensure the normal incidence condition is satisfied to eliminate the broadening of the spectrum and study the operation mechanisms of the polarizers. From a practical point of view, the proposed GO polarizers are designed to perform the best at the normal incidence. A non-normal incidence will reduce the quality factor of the resonance and should be avoided.
Influence of the incident angle
We have simulated the influence of the incident angle on the transmission spectra of the GO polarizer, as plotted in Fig. S6 below. The angles between the incident light and Z-axis in XZ plane and YZ plane are defined as and , respectively (see insets of Fig. S6). The GO polarizer used in Fig. 3a of the manuscript (d =1 μm, a = 4 μm, l = 2 μm) has also been used in the simulations. As the incident angle ( or) increases from 0° (normal incidence) to 30°, the TM mode transmittance reduces from 0.9 to 0.4, as shown in Fig. S6 (a) and (c). No line shape variations have been observed, suggesting that the influence of the incident angle alters mainly the intensity of the TM mode spectra. On the other hand, the TE mode transmittance reduces as the increase of the incident angle ( or). In addition, the broadening of the transmission dips has been observed, suggesting a reduced quality factor of the resonances. As a result, a good agreement with the previously reported angular dependence of guided-mode resonance has been demonstrated3.
Fig. S6. The simulated transmission spectra of a GO polarizer. The angle of the incident beam has been varied from 0° (normal incidence) to 30° in the XZ plane (a, c) and YZ plane (b, d).
Optimization of extinction ratio of GO free-standing polarizers
Fig. S7. The measured FTIR spectra of three GO polarizers (a = 4m, 6m and 8 m) before (top panel) and after (bottom panel) the optimization. The black and red curves are TM and TE polarizations, respectively.
Part I: Transmittance-based Kramers-Kronig method
The transmittance-based Kramers-Kronig (KK) transform can be expressed as4:
, 𝜓(𝜔) =2𝜔 𝜋 𝑃 ∞
∫
0 ln [𝑇𝑓(𝜔')]1/2 𝜔'2‒ 𝜔2 𝑑𝜔 '‒ 2𝜋𝜔𝑑where ω is the frequency of the incident wave, ψ is the phase shift, d is the film thickness, and Tf is the film transmittance. The P before the integral indicates that the
Cauchy principle value of the integral should be used5. The integration is along the
contour in the ω plane and the contribution from the periphery of the circle is not zero, as in the reflection case6, but equals to 2πωd. As a result, the phase shift (ψ) of the
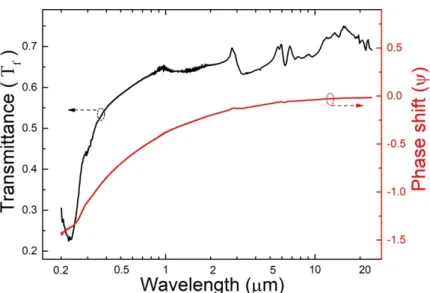
transmitted radiation can be calculated by integrating the measured film transmittance (Tf), as shown in Fig. S8. Noting that it is impossible to acquire the transmittance over
an infinite wavelength range practically, extrapolations outside the measured frequency region are applied using the mean-value theorem7.
Fig. S8. The measured transmittance of the graphene oxide film (black solid line). The calculated phase shift of the transmitted radiation through the transmittance-based KK transform (red solid line).
Given the correlated transmittance (Tf) and phase shift (ψ), the refractive index (n)
and extinction ratio (κ) can be expressed in an inverse relation as4:
{
𝑇𝑓= 16(𝑛2+ 𝜅2)/(𝐶2+ 𝐷2) 𝜓 = arctan (𝜅𝐶 + 𝑛𝐷)/(𝜅𝐷 ‒ 𝑛𝐶) where:{
𝐶 = 𝑒𝐾{[(1 + 𝑛)(𝑛 + 𝑛𝑠) ‒ 𝜅2]cos 𝑁 + 𝜅(1 + 2𝑛 + 𝑛𝑠)sin 𝑁} + 𝑒‒ 𝐾{[(1 ‒ 𝑛)(𝑛 ‒ 𝑛𝑠) + 𝜅2]cos 𝑁 ‒ 𝜅(1 ‒ 2𝑛 + 𝑛𝑠)sin 𝑁} 𝐷 = 𝑒𝐾{[(1 + 𝑛)(𝑛 + 𝑛𝑠) ‒ 𝜅2]sin 𝑁 ‒ 𝜅(1 + 2𝑛 + 𝑛𝑠)cos 𝑁} ‒ 𝑒‒ 𝐾{[(1 ‒ 𝑛)(𝑛 ‒ 𝑛𝑠) + 𝜅2]sin 𝑁 + 𝜅(1 ‒ 2𝑛 + 𝑛𝑠)cos 𝑁} in which:{
𝐾 = 2𝜋𝜅𝑑/𝜆 𝑁 = 2𝜋𝑛𝑑/𝜆and ns is the refractive index of the substrate (ns =1 in our case). Therefore, a
computer-assisted curve fitting program has been developed to calculate n and κ values from Tf
and ψ. In order to further improve the accuracy, iterative fitting processes have been performed until the convergence of the n and κ values. In summary, the procedure for transmittance-based KK method can be summarized as measuring the film transmittance Tf, calculating the phase shift ψ, and finally fitting the inverse relation
iteratively.
Part II: Guided-mode coupling and waveguide coupling
The proposed graphene oxide (GO) polarizer can be seen as a periodic dielectric waveguide array dispensed along x-axis, forming by separated high index GO ribbons stretched along y direction. As a result, the incident radiation with the electric field polarized in y direction, which is defined as TE polarization (Ey, Hx, Hz ≠ 0), is more
easily to be coupled into the high index rods along y direction and blocked by the GO polarizer8,9. On the contrary, the TM polarization (H
y, Ex, Ez ≠ 0) can be transmitted
To understand the coupling and confinement of the external radiation, the cross-sectional electric field distributions inside the high index GO rod have been calculated numerically at the minimal TE transmittance, as shown in Fig. S9a and S9b. Obviously, two coupling mechanisms can be identified, which are: 1) the guided-mode coupling with the electric field resonance along x direction and 2) the waveguide mode with the electric field resonance along z direction.
Fig. S9. The cross-sectional electric field distributions inside the high index GO rod for both the guided-mode (a) and the waveguide mode (b). The electric field is represented by the color contour whereas the arrows show the corresponding magnetic field. The guided-mode coupling can be achieved when the phase matching between the external radiation and the periodicity grating array is satisfied, which can be expressed as8,9:
λg = aˑ(neff - ncˑsinθ), (1)
where a is the periodicity, neff is the effective refractive index of the guided-mode, nc
(=1) is the refractive index of air and θ is the incident angle (= 0̊ for the normal incidence). As a result, the guided-mode coupling wavelength (λg) can be calculated as:
λg = aˑneff (2)
In the case of λg ~ a, the guided-mode resonance is recognized as TE20 mode. For the
TE20 mode, a degenerated mode can be observed as the TE02 waveguide mode along z
direction. The cut-off wavelength λc of the waveguide mode can be expressed as10:
𝜆𝑐= (3) 1 2 𝜀𝜇 ( 𝑚 𝑥) 2 + (𝑛 𝑦) 2
where ε and µ are the permittivity and permeability of the medium, respectively. Also x and y are the length and width of the rectangular waveguide. For the TE02 waveguide
mode (m=0, n=2) along z direction in our GO polarizer, the width y equals to the GO film thickness d. Therefore, the cut-off wavelength λc can be calculated as10:
λc = nGOˑd (4)
The optimized GO polarizer can be achieved when λg = λc, since most of the energy
of TE polarization can be coupled into these two modes. Given the fact that 1< neff <
Reference
1 Swinehart, D. F. The Beer-Lambert Law. J. Chem. Educ. 39, 333 (1962).
2 Li, J., Jia, B., Zhou, G. & Gu, M. Direction-dependent spontaneous emission from near-infrared quantum dots at the angular band edges of a three-dimensional photonic crystal. Applied Physics Letters 91, doi:10.1063/1.2824388 (2007).
3 Lousse, V. et al. Angular and polarization properties of a photonic crystal slab mirror.
Optics Express 12, 1575-1582, doi:10.1364/opex.12.001575 (2004).
4 Maeda, S., Schatz, P. N. & Thyagarajan, G. ABSOLUTE INFRARED INTENSITY MEASUREMENTS IN THIN FILMS .2. SOLIDS DEPOSITED ON HALIDE PLATES. Journal of Chemical Physics 39, 3474-&, doi:10.1063/1.1734216 (1963). 5 Nitsche, R. & Fritz, T. Determination of model-free Kramers-Kronig consistent optical
constants of thin absorbing films from just one spectral measurement: Application to organic semiconductors. Physical Review B 70, doi:10.1103/PhysRevB.70.195432 (2004).
6 Martin Dressel, G. G. Electrodynamics of Solids: Optical Properties of Electrons in
Matter. (2002).
7 Neufeld, J. D. & Andermann, G. KRAMERS-KRONIG DISPERSION-ANALYSIS METHOD FOR TREATING INFRARED TRANSMITTANCE DATA. Journal of the
Optical Society of America 62, 1156-+, doi:10.1364/josa.62.001156 (1972).
8 Fan, S. H. & Joannopoulos, J. D. Analysis of guided resonances in photonic crystal slabs. Physical Review B 65, doi:10.1103/PhysRevB.65.235112 (2002).
9 Hermannsson, P. G., Vannahme, C., Smith, C. L. C. & Kristensen, A. Absolute analytical prediction of photonic crystal guided mode resonance wavelengths. Applied
Physics Letters 105, doi:10.1063/1.4893664 (2014).