HAL Id: hal-03240322
https://hal.inrae.fr/hal-03240322
Submitted on 28 May 2021
HAL is a multi-disciplinary open access archive for the deposit and dissemination of sci-entific research documents, whether they are pub-lished or not. The documents may come from teaching and research institutions in France or abroad, or from public or private research centers.
L’archive ouverte pluridisciplinaire HAL, est destinée au dépôt et à la diffusion de documents scientifiques de niveau recherche, publiés ou non, émanant des établissements d’enseignement et de recherche français ou étrangers, des laboratoires publics ou privés.
Distributed under a Creative Commons Attribution - NoDerivatives| 4.0 International
Feeding cows with hay, silage, or fresh herbage on
pasture or indoors affects sensory properties and
chemical composition of milk and cheese
E. Manzocchi, B. Martin, C. Bord, I. Verdier-Metz, M. Bouchon, M. de
Marchi, I. Constant, K. Giller, M. Kreuzer, J. Berard, et al.
To cite this version:
E. Manzocchi, B. Martin, C. Bord, I. Verdier-Metz, M. Bouchon, et al.. Feeding cows with hay, silage, or fresh herbage on pasture or indoors affects sensory properties and chemical composition of milk and cheese. Journal of Dairy Science, American Dairy Science Association, 2021, 104 (5), pp.5285-5302. �10.3168/jds.2020-19738�. �hal-03240322�
ABSTRACT
In European countries, silage-free feeding is an an-cient tradition and has a particularly positive reputation among consumers. In the present study, we compared grass-based forages from the same plot conserved as hay or silage or fed fresh either on pasture or indoors, and we evaluated the differences in sensory properties of milk and uncooked pressed cheese. All herbage from the first cut of a grassland dominated by perennial ryegrass was harvested on the same day and preserved either as hay or silage. The first regrowth of the same plot was used for strip grazing or green feeding indoors. Balanced by breed, 24 Montbéliarde and 24 Holstein cows were allocated to the 4 treatments. Apart from the forages, the late-lactation cows received 3 kg/d of dry matter from concentrate. After 2 wk of dietary adapta-tion, the bulk milk of 3 subgroups, each with 4 cows, was collected. Part of the milk was pasteurized, and part was left raw and partly transformed to small-sized Cantal-type cheese ripened for 9 wk. Milk and cheese underwent descriptive sensory analysis by a trained sensory panel, as well as analyses of physicochemical traits. Volatile organic compounds of the cheeses were also analyzed. Raw and pasteurized milk from hay-fed cows had less intense odors of cooked milk, cream, and barnyard than milk from grazing cows, whereby the effect of pasteurization did not differ between herb-age utilization methods. Cheeses obtained from cows fed fresh herbage (grazing and indoors) were clearly
yellower than cheeses from silage- and hay-fed cows, which coincided with the color intensity perceived by the panelists. Moreover, cheeses from cows fed fresh herbage had more intense barnyard and dry fruit fla-vors, were perceived as creamier and having less lactic odor, and exhibited more fat exudation than those from cows fed conserved herbage. Only a few differ-ences were observed in milk and cheeses from hay-fed compared with silage-fed cows, and those differences were far less pronounced than those of milk and cheeses from cows fed fresh herbage. In conclusion, the present study did not substantiate assumptions of clear sensory differences of milk and uncooked pressed cheese from hay-fed compared with silage-fed cows. For the first time, this study reports that the global flavor intensity of cheeses from indoor green-fed cows is similar to that of cheeses derived from cows fed conserved forages, whereas cheeses from grazing cows have the greatest global flavor intensity.
Key words: herbage utilization method, dairy cow, milk sensory profile, cheese sensory profile
INTRODUCTION
Grassland-based dairy production systems are increasingly emerging as a strong option for future sustainable livestock systems because they valorize resources not competing with human food supply and provide valuable ecosystem services (Dumont et al., 2018). These production systems are also known to deliver products with high added value characterized by specific nutritional and sensory properties that have been intensively investigated in previous decades (see reviews by Martin et al., 2009a; Kilcawley et al., 2018).
Feeding cows with hay, silage, or fresh herbage on pasture or indoors
affects sensory properties and chemical composition of milk and cheese
E. Manzocchi,1 B. Martin,2* C. Bord,3 I. Verdier-Metz,3 M. Bouchon,4 M. De Marchi,5 I. Constant,2 K. Giller,1 M. Kreuzer,1 J. Berard,6,7 M. Musci,8 and M. Coppa9
1ETH Zurich, Institute of Agricultural Sciences, Universitätstrasse 2, 8092 Zurich, Switzerland
2Université Clermont Auvergne, INRAE, VetAgro Sup, UMR 1213 Herbivores, 63122 Saint-Genès-Champanelle, France 3Université Clermont Auvergne, INRAE, VetAgro Sup, UMR 545 Fromage, 15000 Aurillac, France
4Université Clermont Auvergne, INRAE, Herbipôle, 63122 Saint-Genès-Champanelle, France
5Department of Agronomy, Food, Natural Resources, Animals and Environment (DAFNAE), University of Padova, Viale dell’Università 16,
35020 Legnaro (PD), Italy
6ETH Zurich, AgroVet Strickhof, Eschikon 27, 8315 Lindau, Switzerland
7Agroscope, Division Animal Production Systems and Animal Health, 1725 Posieux, Switzerland 8Department of Food and Drug, University of Parma, Parco Area delle Scienze 27/A, 43124 Parma, Italy
9Independent researcher at Université Clermont Auvergne, INRAE, VetAgro Sup, UMR 1213 Herbivores, 63122 Saint-Genès-Champanelle,
France
J. Dairy Sci. 104:5285–5302
https://doi.org/10.3168/jds.2020-19738
© 2021, The Authors. Published by Elsevier Inc. and Fass Inc. on behalf of the American Dairy Science Association®.
This is an open access article under the CC BY-NC-ND license (http://creativecommons.org/licenses/by-nc-nd/4.0/).
Received October 5, 2020. Accepted November 28, 2020.
It has been demonstrated that feeding herbage-based diets results in a favorable milk fatty acid (FA) com-position and elevated contents of fat-soluble vitamins and antioxidants compared with corn- and concentrate-based diets (Butler et al., 2011). Furthermore, volatile organic compounds (VOC) directly originating from the herbage or derived from substrates in the herb-age affect the sensory properties of milk and cheese (reviewed by Kilcawley et al., 2018). Accordingly, the herbage utilization method and closely related aspects such as the botanical composition and phenological stage of the herbage were reported to affect the compo-sition and sensory properties of milk and cheese (Coppa et al., 2011a, 2015b) as well as the VOC profile of milk (Coppa et al., 2011b) and cheese (Cornu et al., 2009). In some studies, the sensory perception of raw milk and cheese from hay- or silage-fed cows differed (Dubroeucq et al., 2002; Verdier-Metz et al., 2005). Other authors reported that panelists could not distinguish pasteur-ized milk from cows fed timothy silage or timothy hay in a triangle test (Villeneuve et al., 2013). Fatty acid pro-files of the milk of hay- or silage-fed cows may slightly differ (Ferlay et al., 2006; Halmemies-Beauchet-Filleau et al., 2013), whereas the physicochemical properties of the milk seem to remain unaffected (Manzocchi et al., 2020). Often, producers of artisanal hard and semihard cheese do not use milk from silage-feeding farms to avoid the risk of late swelling and off-flavor issues oc-curring during cheese ripening if spores of butyric acid bacteria of silage origin are present in milk. However, the effect of herbage conservation per se on the sensory properties of milk and cheese in previous investiga-tions was often confounded with the effect of botanical composition and phenological stage (i.e., the typically later harvest date for haymaking). To the best of our knowledge, only 2 experiments investigated the effect of forage conservation method using herbage harvested simultaneously from the same plot on cheese sensory quality and VOC profile: Saint-Nectaire type cheese from a permanent grassland (Verdier-Metz et al., 1998) and Caciocavallo, a stretched curd cheese, from a tem-porary subtropical grass (Serrapica et al., 2020). As the diet effects on the sensory properties differ depending on the cheese model (Verdier-Metz et al., 2005), valida-tion by other cheese models is needed and the direct link of compositional changes to the sensory properties of milk and uncooked pressed cheese and their VOC profile has to be demonstrated.
As an alternative to herbage conservation and graz-ing, indoor green-feeding is an established practice in grassland-based dairy production systems during the growing season (Akert et al., 2020). Feeding selection behavior may differ between grazing cows and indoor green-fed cows (Boudon et al., 2006). In the latter, the
proportions of rumenic acid (cis-9,trans-11-C18:2) and vaccenic acid (trans-11-C18:1) in milk were found to be lower than in grazing cows offered the same herb-age (Leiber et al., 2005; Mohammed et al., 2009). This difference and possible other dietary differences may affect the sensory characteristics of milk and cheese through changes in the microbial or endogenous forma-tion of VOC in rumen, milk, or cheese (Coppa et al., 2011b, 2015a; Giaccone et al., 2016). To our knowledge, no comparisons of the 4 herbage utilization methods regarding their effects on the sensory properties of milk and the VOC profile of cheese have been reported in the literature. Therefore, we tested the following hy-potheses: (1) the composition of milk and cheese as well as the VOC profile of the cheese produced from cows fed hay, silage, and fresh herbage on pasture or indoors differ even when the forages are harvested from the same plot; and (2) this variation leads to differ-ent sensory properties of raw or pasteurized milk and uncooked pressed cheeses.
MATERIALS AND METHODS Diets and Animals
The experiment was conducted at the experimental facility of INRAE Herbipôle in Marcenat (45°15′N, 2°55′E; 1,135–1,215 m above sea level, Cantal, France; https: / / doi .org/ 10 .15454/ 1 .5572318050509348E12). The local ethics committee approved the experimen-tal protocol (approval number 20190425141273). In July 2019, 24 Montbéliarde and 24 Holstein cows (8 primiparous and 16 multiparous of each breed) were randomly allocated to 4 groups balanced for breed, parity, and milk yield. At the beginning of the experi-ment, the cows were 251 ± 25 DIM (mean ± SD) and their milk production was 15.1 ± 3.3 kg/d. The average milk fat and protein contents were 3.8 ± 0.4% and 3.3 ± 0.3%, respectively. Three experimental groups were housed in a freestall barn. The first group was fed hay ad libitum. The second group was fed grass silage ad libitum and 2 kg of DM/d of the same hay as fed to the first group. The third group was fed indoors with green herbage harvested daily and offered an amount estimated to result in a surplus of about 5% of the voluntary intake. The fourth group strip grazed on a portion of the same plot during the whole day, except during milking. All animals were supplemented with 3.0 kg of DM/d of a commercial concentrate (on a DM basis: 17.2% corn, 14% wheat, 14% barley, 14% wheat bran, 14% sunflower cake, 11.9% rapeseed meal, 5% cereal grains, 2% molasses, and 7.9% mineral-vitamin premix) and had free access to mineral licking blocks (SODI SoMag, Salins). Water was constantly available
to all experimental groups. All cows were milked at 0630 and 1600 h in a herringbone milking parlor.
Plot Characteristics and Forages
A 6-ha intensively managed grassland plot dominat-ed by ryegrass and timothy was harvestdominat-ed on May 15, 2019 (first cut), at the early heading stage to produce the experimental hay and grass silage. The botanical composition of the sward was surveyed according to the point-quadrat method (Daget and Poissonet, 1969) directly before harvest and 7 wk later at the beginning of the experiment (i.e., the feeding of fresh herbage for 24 d), respectively. Concomitantly, the phenologi-cal stage of grasses was determined using the sphenologi-cale of the Biologisches Bundesanstalt Bundessortenamt und Chemische Industrie (BBCH; Hack et al., 1992). The average BBCH stage was 53 at harvest of hay and silage and 47 at the beginning of the experiment. Table 1 re-ports the most abundant species and the proportions of grasses, legumes, and nonlegume forbs for both dates. Herbage for silage was directly harvested, chopped, and stored in a plastic bag silo. Herbage for haymaking was wilted for 72 h, raked, baled, and barn-dried. Fresh herbage for green feeding indoors was harvested with a cutting and loading truck. Grazing cows were offered a new strip biweekly. Stocking density was 4 cows/ha and herbage biomass on the sward 5 cm above ground was 2.7 t of DM/ha. Fresh herbage from pasture and offered indoors was sampled weekly. One aliquot was dried (60°C, 72 h), whereas another aliquot was preserved at −20°C. In addition, simulated bites of the grazing cows were sampled according to Coppa et al. (2015a) on d 17 of the experiment and frozen at −20°C.
Milk Sampling and Cheesemaking
For bulk milk sampling and cheesemaking, the 4 groups of 12 cows each were further divided into 3 balanced subgroups of 4 cows each, to obtain 3 inde-pendent replicates of bulk milk per herbage utilization method. Each subgroup was balanced for breed, milk yield, and fat and protein content. On d 16, 23, and 24 of the experimental period, evening bulk milk of 1 subgroup per diet was collected and stored at 4°C until the next morning. At the morning milking, bulk milks of the same subgroups were collected and blended with the respective evening milk. At first, two 3-L samples of bulk milk per subgroup were either stored in glass bottles at 4°C or pasteurized (75°C, 3 min) and stored at 4°C. Sensory evaluation of raw milk was performed on the same day of every cheesemaking event, and that of pasteurized milk on the day after (within 28
h from pasteurization). Thirty liters of raw bulk milk per subgroup was simultaneously processed to cheese in 1 of 4 vats. Considering the 3 sampling dates, this yielded 12 vats (3 per herbage utilization method) and 72 cheeses (6 per vat) weighing approximately 500 g. The cheese model applied was Cantal-type cheese, an uncooked, grounded, and pressed cheese, produced with nonstandardized milk. The Cantal-type cheeses were produced as described by Martin et al. (2009b), but the method was adapted to obtain small-sized cheeses. The raw milk was heated to 33°C and then inoculated with 0.015 g of lyophilized mesophilic starter culture (Flora Danica Direct, Chr. Hansen) reconstituted in sterile skim milk (1 g/L), ripening starters (0.32 mL of Monilev and 0.16 mL of Penbac, Laboratoire Interpro-fessionnel de Production), and 9 mL of rennet (Fabre 520, LCP Food Ingredients) containing active chymosin at 520 mg/L. The curd was cut 45 min later for 1.5 min to reach corn kernel sizes of 5 to 6 mm, blended for 12 min, and left to rest for 5 min. After the whey was drained, the curd was pressed into a tray, cut into 5-cm cubes, and turned every 15 min for 90 min. After pressing, the curd was left to drain for 24 h at 24.5°C,
Manzocchi et al.: HERBAGE UTILIZATION AND MILK AND CHEESE PROPERTIES
Table 1. The 10 most abundant plant species of first cut (hay and silage) and first regrowth (herbage fed on pasture and indoor) of the plot where experimental forages were produced
Species SC,1 % SE Conserved forages Lolium perenne 19.1 2.76 Phleum pratense 14.4 8.30 Taraxacum officinale 13.9 3.64 Trifolium repens 13.2 4.52 Bromus hordeaceus 11.9 7.78 Poa pratensis 7.4 3.19 Dactylis glomerata 5.7 2.23 Festuca pratensis 3.1 1.88 Veronica chamaedrys 2.1 0.77 Lamium album 1.8 0.94 Functional groups Grasses 64.6 7.25 Legumes 13.8 4.12 Nonlegume forbs 21.6 4.74 Fresh herbage Lolium perenne 19.9 9.96 Poa pratensis 19.3 3.64 Taraxacum officinale 9.09 7.10 Agrostis tenuis 8.79 4.40 Lolium multiflorum 7.62 5.70 Festuca pratensis 7.25 2.82 Trifolium repens 7.09 7.01 Dactylis glomerata 5.84 1.80 Ranunculus bulbosus 5.09 3.09 Phleum pratense 3.44 3.83 Functional groups Grasses 76.8 10.19 Legumes 7.1 7.01 Nonlegume forbs 16.1 6.09 1SC = specific contribution.
pounded to 20-mm grains and salted (2 g of NaCl/100 g of curd), and rested for 6 h at 18°C (90% relative humidity). Then it was put into 6 molds (90 mm in diameter) per vat. The cheeses were ripened for 9 wk at 10°C and ≥97% relative humidity, and turned twice a week. Milk samples for analysis of gross composition, FA, and total microbial counts were collected from the vats before inoculation with rennet and starter culture.
Laboratory Analyses
Feeds. Oven-dried forage samples were ground and analyzed for proximate nutrient composition according to Coppa et al. (2015a). Frozen forage samples were lyophilized and ground, and their FA profiles were ana-lyzed by GC according to Ferlay et al. (2010). Samples of fresh grass and simulated bites were sorted by hand into grasses, legumes, and nonlegume forbs and then dried (60°C, 72 h) and weighed to calculate their rela-tive proportion of total DM.
Milk. Milk samples were preserved with bronopol at 4°C and analyzed for fat, protein, CN, lactose, urea, and free FA by infrared spectroscopy (MilkoScan, Foss). Somatic cells were counted by flow cytometry (Fosso-matic, Foss). Contents of Ca, P, Mg, K, and Na were determined by mid-infrared spectroscopy according to Visentin et al. (2016). Total bacterial counts were ana-lyzed with BactoScan (Foss). Milk color was measured by spectrometry, and L* (light-dark index), a* (red-green index), and b* (yellow-blue index) were quantified according to the CIE (International Commission on Il-lumination) system. Three milliliters of milk was stored without preservative at −20°C until lyophilization for FA analysis by GC according to Lerch et al. (2015). Additional samples of 50 mL were stored at −20°C and later analyzed for milk coagulation properties using a Formagraph (Foss) according to the method validated by Penasa et al. (2015). Rennet coagulation time, curd firming time at 20 mm of curd size, and curd firmness after 30 min were recorded. Other technological traits (native milk pH, pH of pressed and pounded curd, DM content of molded curd) were recorded during every cheesemaking event according to Martin et al. (2009b).
Cheese. After ripening, cheese yield was calculated based on the sum of the weight of all cheeses from 1 vat divided by the initial milk weight. One cheese per vat was used for sensory analysis; another was used for the measurement of rheology, color, chemical composi-tion, and VOC; and the other cheeses were preserved for further analysis. Rheological measurements were repeated 5 times per cheese by uniaxial compression at constant displacement rate as described by Martin et al. (2009b). Strengths exerted by the samples at 20, 40,
and 60% sample deformation under compression were recorded, as well as the Young’s modulus. The Young’s modulus is the relation of stress to strain during com-pression and expresses the stiffness of the sample. On the same sample, 5 repeated color measurements were done by spectrometry as detailed for milk. Replicates of rheological and color measurements performed were averaged per cheese. The remainder was frozen at −20°C until further analysis. After samples were thawed overnight at 4°C, DM content was determined according to the reference method (ISO 5534; ISO, 2004b). Chlorides (expressed as NaCl) were measured with a potentiometric method (ISO 5943; ISO, 2006). Fat was analyzed with an acid-butyrometric method (AFNOR NF V 04-287 Heiss method; AFNOR, 2002). Lipolysis, expressed as free FA (oleic acid, % of fat), was measured by titration (ISO 1740; ISO, 2004a). Total nitrogen (TN) was determined by the Kjeldahl method (ISO 8968-1; ISO, 2014). Water-soluble N and phosphotungstic acid–soluble N (PTSN) were analyzed according to Ardö (1999). The volatile fraction of the cheeses was extracted by headspace–solid phase micro-extraction. Before the extraction, cheese samples were thawed, cut into small pieces, frozen under liquid nitro-gen, ground in a domestic blender, and stored at −20°C in screw-cap glass vials until analysis. Four grams of ground cheese was put into a 20-mL hermetic glass vial. The headspace–solid phase microextraction was carried out by exposing a 50/30-μm divinylbenzene-carboxen-polydimethylsiloxane fiber (Supelco) for 40 min to the headspace of the vial thermostatically controlled at 50°C. The fiber was then removed from the vial and in-serted for 10 min into a GC-MS injector, maintained at 230°C, to desorb the extracted compounds. Injections were performed in splitless mode, keeping the valve closed for 3 min. The compounds were separated by GC-MS, performed on a Trace 1300 gas chromatograph coupled to an ISQ single quadrupole mass spectrometer (both Thermo Fisher) equipped with an electronic im-pact source. The VOC separation was performed on a SupelcoWax 10 capillary column (Supelco, 30 m × 0.25 mm, df 0.25 μm). Helium was used as the carrier gas
with a total flow of 1 mL/min. The oven temperature program was as follows: isothermal at 50°C for 5 min; increase at 10°C/min until 100°C; increase at 20°C/min until 220°C; and isothermal at 220°C for 10 min. The transfer line temperature was 230°C. Mass spectral data were acquired in full scan mode in the mass range 35 to 350 amu (scan time 0.2 s). Signal acquisition and data processing were performed using the software Xcalibur (Thermo Scientific). Qualitative analysis was performed by comparing the obtained spectra with those stored in the National Institute of Standards and Technology. In
addition, Kovats retention indices (KI) were calculated for each chromatographic peak and compared with literature data (Bianchi et al., 2007). Where possible, the retention time of the chromatographic peak was compared with that of authentic standards injected under same chromatographic conditions. A semiquanti-tative analysis was performed by integrating chromato-graphic peak areas. Values of 3 analytical replicates per cheese sample were averaged. For statistical analysis, chromatographic peak areas of the compounds were transformed to log10(peak area × 10−5).
Sensory Evaluation of Milk and Cheese
Milk. Nine trained panelists performed a descriptive sensory analysis of the 2 × 12 raw and pasteurized milk samples according to 19 attributes: 2 for appear-ance, 5 for odor, 6 for taste, 5 for flavor, and 1 for texture (Supplemental Table S1, https: / / doi .org/ 10 .15454/ WZWS4P). The panelists had more than 20 h of experience in evaluating dairy products and were trained in the generation of attributes and use of the perception scales according to ISO 8586-1 standard norms (ISO, 2012). During 5 training sessions of 1.5 h each, 5 commercial milks and raw milk were used to generate the sensory attributes and to set references on the intensity scale of each attribute. The performance of the panel was evaluated with different discrimination (paired-comparison and triangle tests) and descriptive tests during the last 2 training session. During the evaluation sessions, the intensity of perception of each attribute was scored on a continuous scale from 0 (no perception) to 10 (very intense perception). In each evaluation session, 4 samples labeled with 3-digit codes were served in a sequential monadic way and random-ized order in clear plastic glasses. The milk was served at 20 ± 2°C. Between every sample, panelists rinsed their mouth with water and unsalted crackers. Data were collected with the Tastel software (version 2019, ABT Informatique).
Cheese. Ten trained panelists assessed the 12 rip-ened Cantal-type cheeses in 3 sessions (1 session per cheesemaking event). The panelists had participated in 6 h of specific training on Cantal-type cheeses, in ad-dition to the routine training procedure on dairy prod-ucts according to ISO 8586-1 standard norms (ISO, 2012). Twenty-five attributes were applied to assess the sensory properties of the cheeses: 4 for appearance, 7 for odor, 3 for taste, 7 for flavor, and 4 for texture (Supplemental Table S2, https: / / doi .org/ 10 .15454/ WZWS4P). Triangular pieces of cheese (30 g) with the rind on 1 side were served at 21 ± 2°C on white plastic dishes using a monadic sequential method and in a
randomized order. After evaluation of the appearance and intensity of odor with the rind, the panelists were asked to remove the rind and continue the evaluation of odor (without the rind), taste, flavor, and texture. The intensity of perception of each attribute was graded according to the same continuous scale used for milk samples and recorded with the same software.
Statistical Analyses
Data on milk yield, composition, cheese properties, cheese VOC, and cheesemaking traits were analyzed by ANOVA with the GLM procedure in SAS (version 9.4, SAS Institute Inc.). The model included herbage utilization method (4 levels) as fixed effect and repli-cate (cheesemaking event, 3 levels) as random effect. The model for milk sensory data included herbage uti-lization method (fixed; 4 levels), pasteurization (fixed; 2 levels), panelist (random; 9 levels), and all 2- and 3-way interactions. For cheese sensory data, the model included the effect of herbage utilization method (fixed; 4 levels), panelist (random; 10 levels), session (fixed; 3 levels), and all 2-way interactions. The 3-way inter-action was omitted because it was never significant. Normality and homoscedasticity of the residuals were tested with the Shapiro-Wilk test and by visual inspec-tion of skewness and kurtosis. No transformainspec-tions were needed. The Fisher’s least significant difference test was applied for multiple comparisons among means of herbage utilization methods. Data are reported as least squares means and standard error of the mean. Dif-ferences were considered significant at P < 0.05, and tendencies were identified when 0.05 < P < 0.10. Pear-son correlation coefficients (ρ) were calculated with the CORR procedure of SAS for variables describing or influencing cheese color, texture, odor, and flavor attributes.
RESULTS Forage Characteristics
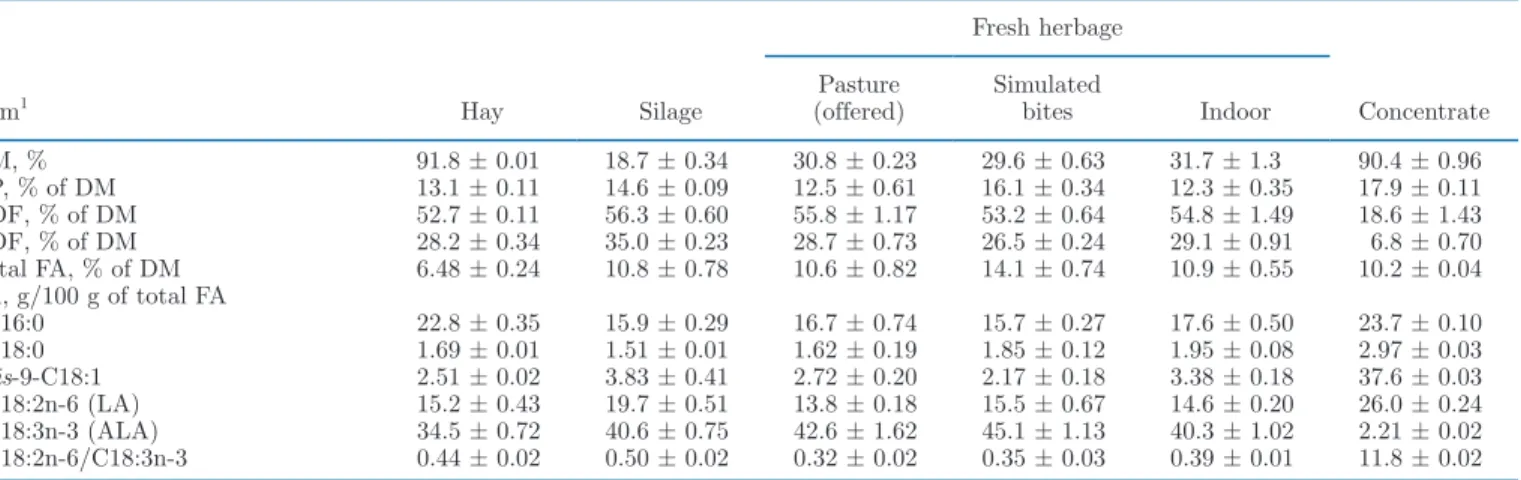
Forage proximate composition for the conserved and fresh forages was quite similar (Table 2). The total con-tent of FA and the proportion of C18: 3n -3 (α-linolenic acid, ALA) in total FA was numerically lower in hay than in all other forages. The proportion of C16:0 in total FA was numerically higher in hay compared with all other forages. The ratio of C18: 2n -6 to C18: 3n -3 was numerically higher in hay and silage compared with fresh herbage. Cows on pasture selected on average 71.1 ± 2.92% (mean ± SE) grasses, 18.9 ± 2.49% legumes, and 9.9 ± 1.63% nonlegume forbs. The corresponding
values for the herbage offered to indoor green-fed cows were 69.5 ± 7.94%, 12.9 ± 3.55%, and 17.6 ± 4.38%, respectively.
Bulk Milk Characteristics
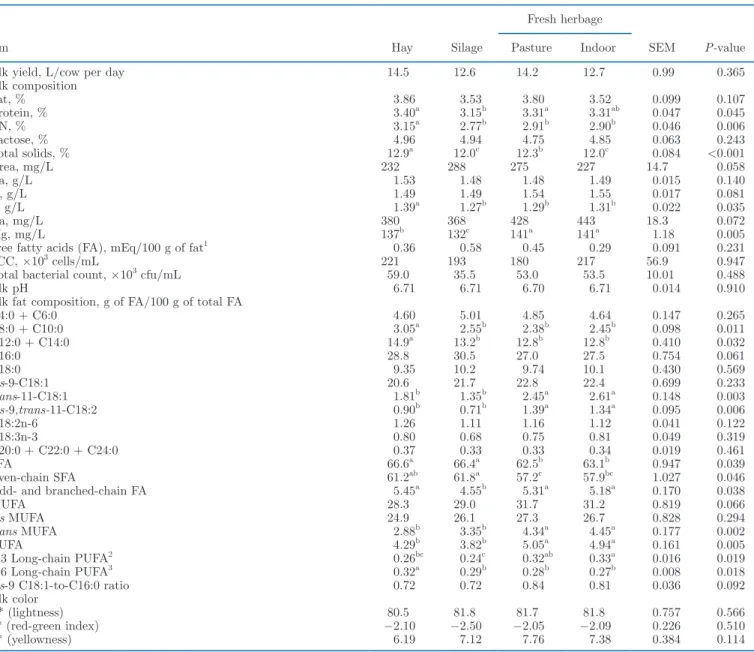
The milk from hay-fed cows had higher protein and CN contents, whereas fat and lactose contents were similar in all groups (Table 3). Total solids were higher in milk from hay-fed cows (+0.96 g/100 g milk) and grazing cows (+0.36 g/100 g milk) compared with cows fed silage and herbage indoors. The proportion of free FA in milk fat and the counts of somatic cells and total bacteria did not differ between diets. Compared with feeding conserved forages, fresh grass increased the proportions of PUFA in milk (+0.94 g/100 g of FA;
P < 0.05), especially rumenic acid (+0.56 g/100 g of
FA; P < 0.05), and total trans MUFA, in particular vaccenic acid (+0.85 g/100 g of FA; P < 0.05). The proportion of long-chain n-3 PUFA was higher (+0.23 g/100 g of FA; P < 0.05) in milk from indoor green-fed cows compared with milk from silage-green-fed cows, and long-chain n-6 PUFA were more abundant (P < 0.05) in milk fat from hay-fed cows compared with milk from cows fed the other forages. The SFA proportion was lower in milk from cows fed fresh herbage (−3.76 g/100 of FA; P < 0.05) than from those fed conserved forages. The sum of even medium-chain FA (C8:0 to C14:0) was higher in milk from hay-fed cows (+2.54 g/100 g of FA; P < 0.05) compared with milk of all other groups. Milk from silage-fed cows had a lower proportion of odd- and branched-chain FA (−0.26 g/100 g of FA;
P < 0.05) compared with milk of the other groups.
Milk color and native pH did not differ between the dietary treatments. Milk from fresh herbage–fed cows had a higher Mg concentration (P < 0.05) than milk
from hay- or silage-fed cows (+17.5 and +22.5 mg/L, respectively), whereas milk from hay-fed cows had a higher P concentration (+0.1 g/L; P < 0.05) compared with all other groups.
Cheesemaking Properties and Cheese Yield and Composition
Milk coagulation traits (coagulation time, curd firm-ing time, and curd firmness) did not differ between treatments (Table 4). Pressed curds obtained from milk from grazing cows had a slightly lower pH compared with all other curds, but pH of pounded curds and DM content of molded curds did not differ between dietary treatments. The yield of ripened cheese was higher (P < 0.05) for hay-fed cows (+128 g/100 kg of milk) and grazing cows (+117 g/100 kg of milk) than for cows fed silage or fresh herbage indoors. Cheeses did not dif-fer in pH, DM, fat, salt, and free FA contents. Cheese cores from the groups fed fresh herbage had higher a* (+1.4; P < 0.05) and b* (+3.6; P < 0.05) values than cheeses from cows fed hay or silage. Cheeses from the indoor herbage-fed group were less bright (L*: −4.0; P < 0.05) than all other cheeses. Total N content as well as ratios of water-soluble N and PTSN to TN in cheeses did not differ between the 4 treatment groups. Young’s modulus and strength at all degrees of deformation of the cheeses were also similar among treatments.
VOC Profile of the Cheeses
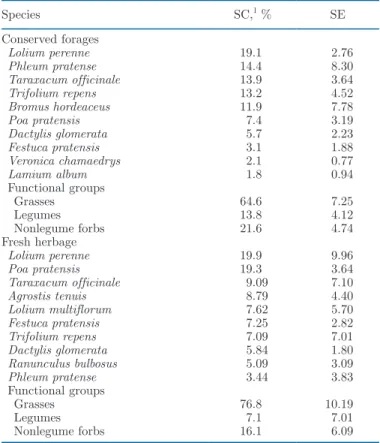
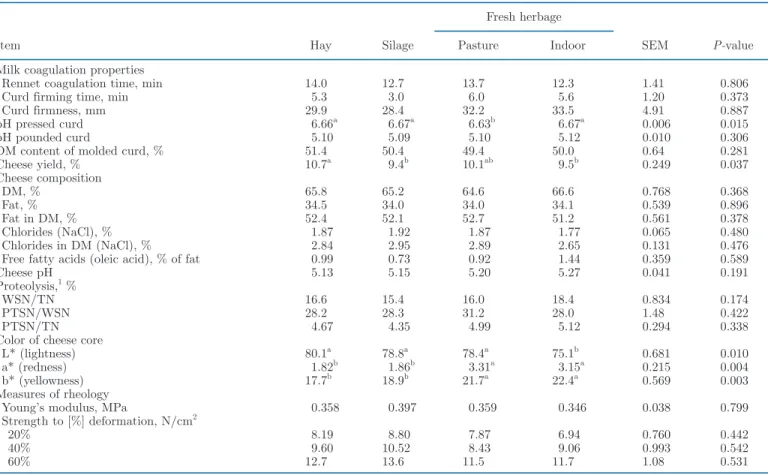
In total, 47 VOC were detected in the cheeses, which belonged to following chemical classes: 15 alcohols, 12 esters, 6 ketones, 2 hydrocarbons, 3 acids, 3 aldehydes, 2 lactones, 2 sulfurous compounds, and 2 nitrogenous compounds (Table 5). The main compounds desorbing
Table 2. Composition (mean ± SE) of the conserved and fresh grass-based forages, simulated bites, and the concentrate feed fed during the experiment
Item1 Hay Silage
Fresh herbage
Concentrate Pasture
(offered) Simulated bites Indoor
DM, % 91.8 ± 0.01 18.7 ± 0.34 30.8 ± 0.23 29.6 ± 0.63 31.7 ± 1.3 90.4 ± 0.96 CP, % of DM 13.1 ± 0.11 14.6 ± 0.09 12.5 ± 0.61 16.1 ± 0.34 12.3 ± 0.35 17.9 ± 0.11 NDF, % of DM 52.7 ± 0.11 56.3 ± 0.60 55.8 ± 1.17 53.2 ± 0.64 54.8 ± 1.49 18.6 ± 1.43 ADF, % of DM 28.2 ± 0.34 35.0 ± 0.23 28.7 ± 0.73 26.5 ± 0.24 29.1 ± 0.91 6.8 ± 0.70 Total FA, % of DM 6.48 ± 0.24 10.8 ± 0.78 10.6 ± 0.82 14.1 ± 0.74 10.9 ± 0.55 10.2 ± 0.04 FA, g/100 g of total FA C16:0 22.8 ± 0.35 15.9 ± 0.29 16.7 ± 0.74 15.7 ± 0.27 17.6 ± 0.50 23.7 ± 0.10 C18:0 1.69 ± 0.01 1.51 ± 0.01 1.62 ± 0.19 1.85 ± 0.12 1.95 ± 0.08 2.97 ± 0.03 cis-9-C18:1 2.51 ± 0.02 3.83 ± 0.41 2.72 ± 0.20 2.17 ± 0.18 3.38 ± 0.18 37.6 ± 0.03 C18: 2n -6 (LA) 15.2 ± 0.43 19.7 ± 0.51 13.8 ± 0.18 15.5 ± 0.67 14.6 ± 0.20 26.0 ± 0.24 C18: 3n -3 (ALA) 34.5 ± 0.72 40.6 ± 0.75 42.6 ± 1.62 45.1 ± 1.13 40.3 ± 1.02 2.21 ± 0.02 C18: 2n -6/ C18: 3n -3 0.44 ± 0.02 0.50 ± 0.02 0.32 ± 0.02 0.35 ± 0.03 0.39 ± 0.01 11.8 ± 0.02
from the cheeses were hexanoate, butanoate, methyl oleate, methyl stearate, and methyl isohexadecanoate. The concentrations of 8 compounds and 1 compound class were affected by the herbage utilization method. The cheeses from the grazing group had a higher con-centration of ethyl butanoate (+36%; P < 0.05) than all other cheeses. The concentration of a not identified (NI) compound (KI 1661), putatively a branched ester, was also higher in cheeses from grazing cows (+31%;
P < 0.05) compared with cheeses from hay- and
in-door green-fed cows. Moreover, the concentration of NI
(KI 1612), putatively 2,4-dimethylpyrrole, was higher (+17%; P < 0.05) in cheeses from grazing and silage-fed cows than in cheeses from indoor green-silage-fed cows. Cheeses from silage-fed cows had a higher concentra-tion of total lactones and octane than all other cheeses, as well as a higher concentration of 2-phenylethanol (+39%; P < 0.05) and 3-methyl-1-butanol (+43%; P < 0.05) compared with cheeses from hay-fed and grazing cows. Furthermore, cheeses from hay-fed cows had a lower concentration of 3-methylbutanal (−38%; P < 0.05) than all other cheeses. In addition, the
concentra-Manzocchi et al.: HERBAGE UTILIZATION AND MILK AND CHEESE PROPERTIES
Table 3. Effect of herbage utilization method on yield, composition, and color of the milk in the vat before addition of the starter
Item Hay Silage
Fresh herbage
SEM P-value
Pasture Indoor
Milk yield, L/cow per day 14.5 12.6 14.2 12.7 0.99 0.365 Milk composition Fat, % 3.86 3.53 3.80 3.52 0.099 0.107 Protein, % 3.40a 3.15b 3.31a 3.31ab 0.047 0.045 CN, % 3.15a 2.77b 2.91b 2.90b 0.046 0.006 Lactose, % 4.96 4.94 4.75 4.85 0.063 0.243 Total solids, % 12.9a 12.0c 12.3b 12.0c 0.084 <0.001 Urea, mg/L 232 288 275 227 14.7 0.058 Ca, g/L 1.53 1.48 1.48 1.49 0.015 0.140 K, g/L 1.49 1.49 1.54 1.55 0.017 0.081 P, g/L 1.39a 1.27b 1.29b 1.31b 0.022 0.035 Na, mg/L 380 368 428 443 18.3 0.072 Mg, mg/L 137b 132c 141a 141a 1.18 0.005
Free fatty acids (FA), mEq/100 g of fat1 0.36 0.58 0.45 0.29 0.091 0.231
SCC, ×103 cells/mL 221 193 180 217 56.9 0.947
Total bacterial count, ×103 cfu/mL 59.0 35.5 53.0 53.5 10.01 0.488
Milk pH 6.71 6.71 6.70 6.71 0.014 0.910
Milk fat composition, g of FA/100 g of total FA
C4:0 + C6:0 4.60 5.01 4.85 4.64 0.147 0.265 C8:0 + C10:0 3.05a 2.55b 2.38b 2.45b 0.098 0.011 C12:0 + C14:0 14.9a 13.2b 12.8b 12.8b 0.410 0.032 C16:0 28.8 30.5 27.0 27.5 0.754 0.061 C18:0 9.35 10.2 9.74 10.1 0.430 0.569 cis-9-C18:1 20.6 21.7 22.8 22.4 0.699 0.233 trans-11-C18:1 1.81b 1.35b 2.45a 2.61a 0.148 0.003 cis-9,trans-11-C18:2 0.90b 0.71b 1.39a 1.34a 0.095 0.006 C18: 2n -6 1.26 1.11 1.16 1.12 0.041 0.122 C18: 3n -3 0.80 0.68 0.75 0.81 0.049 0.319 C20:0 + C22:0 + C24:0 0.37 0.33 0.33 0.34 0.019 0.461 SFA 66.6a 66.4a 62.5b 63.1b 0.947 0.039 Even-chain SFA 61.2ab 61.8a 57.2c 57.9bc 1.027 0.046
Odd- and branched-chain FA 5.45a 4.55b 5.31a 5.18a 0.170 0.038
MUFA 28.3 29.0 31.7 31.2 0.819 0.066 cis MUFA 24.9 26.1 27.3 26.7 0.828 0.294 trans MUFA 2.88b 3.35b 4.34a 4.45a 0.177 0.002 PUFA 4.29b 3.82b 5.05a 4.94a 0.161 0.005 n-3 Long-chain PUFA2 0.26bc 0.24c 0.32ab 0.33a 0.016 0.019 n-6 Long-chain PUFA3 0.32a 0.29b 0.28b 0.27b 0.008 0.018
cis-9 C18: 1 -to -C16: 0 ratio 0.72 0.72 0.84 0.81 0.036 0.092
Milk color
L* (lightness) 80.5 81.8 81.7 81.8 0.757 0.566
a* (red-green index) −2.10 −2.50 −2.05 −2.09 0.226 0.510 b* (yellowness) 6.19 7.12 7.76 7.38 0.384 0.114
a–cMeans (n = 3) within a row with differing superscripts differ (P < 0.05) according to Fisher’s least squares difference test. 11 mEq = 0.28 g of oleic acid.
2Include C20: 5n -3, C22: 3n3, C22: 5n3, C22: 6n -3.
tions of 2,3-butanediol (P = 0.052) and 2-butanone (P = 0.081) were numerically lower in cheeses from hay-fed cows than in cheeses from cows hay-fed fresh herbage, either on pasture or indoors. Cheeses from both groups fed conserved forages had a higher concentration of 2-pentanol (+36%; P < 0.05) than cheeses from both groups fed fresh herbage.
Sensory Perception of Milk and Cheese
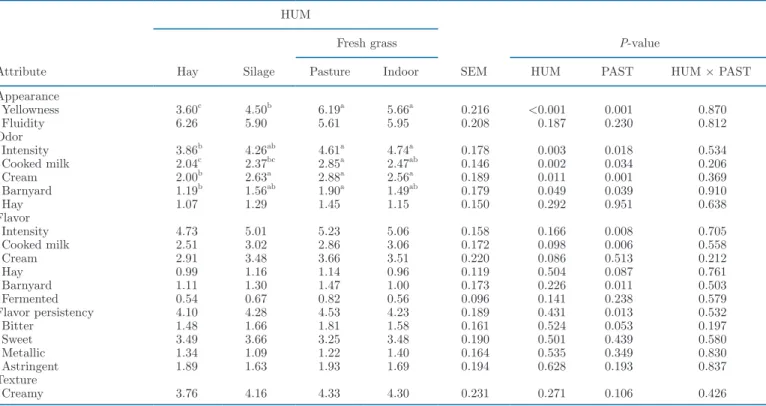
Milk. The results of the sensory evaluation of the milk are combined for raw and pasteurized milk in Table 6 because no significant interaction of herbage utilization method and pasteurization was observed. Results are presented individually in Supplemental Table S3 (https: / / doi .org/ 10 .15454/ WZWS4P). Pas-teurization reduced the yellowness (P = 0.001) and increased (P < 0.05) the intensity of the cream odor and the barnyard and cooked milk odors and flavors, as well as of the global odor and flavor intensity (Table 6 and Supplemental Table S3). Milks from grazing and
indoor green-fed cows had a more intense color (+1.7 and +1.2, respectively; P < 0.001) compared with milk from silage-fed cows, and the color was even more in-tense (+2.6 and +2.1, respectively) when hay was fed. Milk from the latter group had a lower global odor intensity (−0.8; P < 0.05) than milk from cows of both groups fed fresh herbage. The odor attributes cooked milk (P < 0.05), cream (P < 0.05), and barnyard (P < 0.05) were perceived as less intensive (−0.8, −0.8, and −0.7, respectively) in milk from hay-fed cows than in milk from grazing cows. Milk from hay-fed cows differed from that of silage-fed cows only by a lower intensity of cream odor (−0.6).
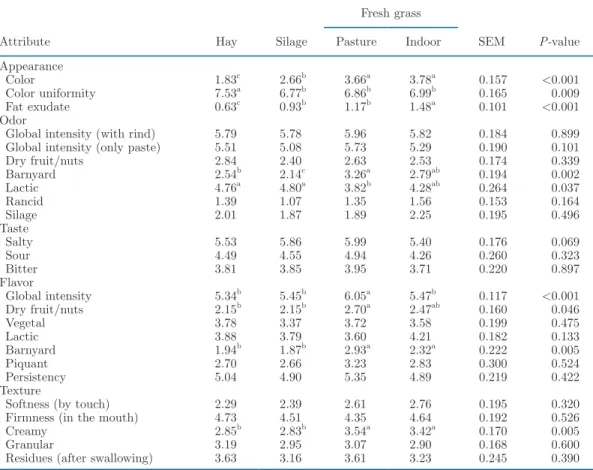
Cheese. Grazing and indoor green-feeding clearly increased the yellowness of the cheese core (Table 7). Cheeses from hay-fed cows were perceived to be the lightest (P < 0.001) and presented a more uniform coloring of the paste (P < 0.01) than all other cheeses. Grazing, but not indoor green-feeding, resulted in cheeses with a stronger global flavor (+0.6; P < 0.05) than all other cheeses. The barnyard flavor was more
Table 4. Effect of herbage utilization method on processing traits, cheese yield, chemical composition, color, and rheology of Cantal-type cheese (n = 3 per diet) after 9 wk of ripening
Item Hay Silage
Fresh herbage
SEM P-value
Pasture Indoor Milk coagulation properties
Rennet coagulation time, min 14.0 12.7 13.7 12.3 1.41 0.806 Curd firming time, min 5.3 3.0 6.0 5.6 1.20 0.373 Curd firmness, mm 29.9 28.4 32.2 33.5 4.91 0.887 pH pressed curd 6.66a 6.67a 6.63b 6.67a 0.006 0.015
pH pounded curd 5.10 5.09 5.10 5.12 0.010 0.306
DM content of molded curd, % 51.4 50.4 49.4 50.0 0.64 0.281 Cheese yield, % 10.7a 9.4b 10.1ab 9.5b 0.249 0.037 Cheese composition DM, % 65.8 65.2 64.6 66.6 0.768 0.368 Fat, % 34.5 34.0 34.0 34.1 0.539 0.896 Fat in DM, % 52.4 52.1 52.7 51.2 0.561 0.378 Chlorides (NaCl), % 1.87 1.92 1.87 1.77 0.065 0.480 Chlorides in DM (NaCl), % 2.84 2.95 2.89 2.65 0.131 0.476 Free fatty acids (oleic acid), % of fat 0.99 0.73 0.92 1.44 0.359 0.589
Cheese pH 5.13 5.15 5.20 5.27 0.041 0.191
Proteolysis,1 %
WSN/TN 16.6 15.4 16.0 18.4 0.834 0.174
PTSN/WSN 28.2 28.3 31.2 28.0 1.48 0.422
PTSN/TN 4.67 4.35 4.99 5.12 0.294 0.338
Color of cheese core
L* (lightness) 80.1a 78.8a 78.4a 75.1b 0.681 0.010
a* (redness) 1.82b 1.86b 3.31a 3.15a 0.215 0.004
b* (yellowness) 17.7b 18.9b 21.7a 22.4a 0.569 0.003
Measures of rheology
Young’s modulus, MPa 0.358 0.397 0.359 0.346 0.038 0.799 Strength to [%] deformation, N/cm2
20% 8.19 8.80 7.87 6.94 0.760 0.442
40% 9.60 10.52 8.43 9.06 0.993 0.542
60% 12.7 13.6 11.5 11.7 1.08 0.531
a,bMeans (n = 3) within a row with differing superscripts differ (P < 0.05) according to Fisher’s least squares difference test. 1TN = total nitrogen; WSN = water-soluble nitrogen; PTSN = phosphotungstic acid–soluble nitrogen.
Manzocchi et al.: HERBAGE UTILIZATION AND MILK AND CHEESE PROPERTIES
Table 5. Volatile organic compounds detected in Cantal-type cheeses after 9 wk of ripening by solid-phase microextraction–GC/MS [arbitrary units, log10(peak area × 10−5)]
Volatile organic compound Identification1 KI Hay Silage
Fresh herbage SEM P-value Pasture Indoor Alcohols (15) Ethanol MS, KI, RT 932 2.93 2.94 2.92 2.65 0.097 0.210 2-Butanol MS, KI, RT 1,035 1.93 2.73 2.64 2.66 0.293 0.169 2-Methyl-1-propanol MS, KI, RT 1,097 1.41 1.46 1.59 1.62 0.121 0.594 3-Pentanol MS, KI, RT 1,112 1.89 1.46 1.60 1.35 0.136 0.122 2-Pentanol MS, KI, RT 1,142 1.59a 1.61a 1.14b 1.22b 0.072 0.007 3-Methyl-1-butanol MS, KI, RT 1,215 2.41bc 2.89a 2.22c 2.68ab 0.125 0.037 1-Pentanol MS, KI, RT 1,256 1.41 1.52 1.52 1.43 0.063 0.982 2-Heptanol MS, KI, RT 1,334 2.15 1.94 2.06 2.02 0.057 0.162 1-Hexanol MS, KI, RT 1,354 1.53 1.40 1.38 1.25 0.108 0.407 2,6-Dimethyl-4-heptanol MS, KI 1,509 1.52 2.09 1.39 1.79 0.236 0.265 2-Nonanol MS, KI, RT 1,528 1.62 1.62 1.64 1.54 0.069 0.775 2,3-Butanediol MS, KI 1,547 1.44 1.56 1.89 1.88 0.106 0.052 1,3-Butanediol MS, KI 1,560 2.91 2.71 3.00 3.00 0.124 0.396 Phenylmethanol MS, KI 1,887 1.66 2.01 1.92 1.90 0.093 0.148 2-Phenylethanol MS, KI 1,922 1.43b 2.09a 1.56b 2.06a 0.120 0.016 Sum of alcohols 3.43 3.61 3.49 3.50 0.073 0.433 Esters (12)
Ethyl butanoate MS, KI, RT 1,040 2.15b 2.22b 2.58a 2.28b 0.085 0.045
Ethyl hexanoate MS, KI, RT 1,238 2.80 2.71 3.01 2.62 0.108 0.173
Ethyl octanoate MS, KI, RT 1,438 2.37 2.12 2.41 2.22 0.080 0.127
Ethyl decanoate MS, KI, RT 1,647 1.68 1.99 1.74 1.83 0.103 0.271
NI 1661 1,661 1.37b 1.59ab 1.90a 1.53b 0.101 0.044 Phenethyl acetate MS, KI 1,797 2.60 2.40 2.25 2.19 0.167 0.386 Methyl isohexadecanoate MS, KI 2,166 3.07 3.13 3.07 3.14 0.054 0.680 Methyl hexadecanoate MS, KI 2,202 1.87 1.80 1.75 1.83 0.080 0.749 Methyl heptadecanoate MS, KI 2,309 1.85 1.82 1.88 1.93 0.063 0.693 Methyl octadecanoate MS, KI 2,419 3.28 3.25 3.37 3.24 0.070 0.572 Methyl oleate MS, KI 2,426 3.44 3.52 3.42 3.51 0.063 0.575 Methyl linoleate MS, KI 2,480 2.34 2.45 2.25 2.38 0.072 0.358 Sum of esters 3.89 3.92 3.93 3.91 0.058 0.962 Ketones (6) Acetone MS, KI, RT 814 1.93 2.05 1.99 1.86 0.147 0.819 2-Butanone MS, KI, RT 901 2.49 3.36 3.37 2.66 0.239 0.081 3-Pentanone MS, KI 983 2.83 2.71 2.61 2.49 0.117 0.296 2-Heptanone MS, KI, RT 1,185 2.32 2.45 2.35 2.46 0.045 0.157 2-Nonanone MS, KI, RT 1,394 2.37 2.23 2.29 2.40 0.088 0.570 2-Undecanone MS, KI, RT 1,606 1.63 1.74 1.74 1.49 0.120 0.470 Sum of ketones 3.21 3.61 3.53 3.19 0.101 0.053 Hydrocarbons (2) Octane MS, KI, RT 800 0.93b 1.24a 0.90b 0.86b 0.068 0.029 3-Octene MS, KI 847 0.71 0.71 0.89 0.87 0.181 0.735 Sum of hydrocarbons 1.60 1.30 1.52 1.31 0.113 0.245 Acids (3) Butanoic acid MS, KI 1,667 3.43 3.36 3.54 3.50 0.055 0.214 Hexanoic acid MS, KI 1,854 4.00 3.96 4.10 4.00 0.075 0.623 Octanoic acid MS, KI 2,046 2.62 2.21 2.92 2.48 0.241 0.309 Sum of acids 4.12 4.07 4.24 4.13 0.079 0.542 Aldehydes (3) 3-Methylbutanal MS, KI, RT 917 1.46b 1.76a 1.81a 1.95a 0.085 0.042 Octanal MS, KI, RT 1,286 1.83 1.89 2.02 1.87 0.081 0.420 2-Decenal MS, KI, RT 1,561 1.64 1.78 1.70 1.67 0.071 0.554 Sum of aldehydes 2.14 2.30 2.30 2.36 0.089 0.396 Lactones (2) γ-Methyl-γ-caprolactone MS, KI 1,666 1.65 1.35 1.41 1.36 0.085 0.135 δ-Decalactone MS, KI 2,192 2.28 2.38 2.21 2.34 0.049 0.165 Sum of lactones 2.38b 2.71a 2.27b 2.39b 0.041 0.003 Sulfurous compounds (2) Carbon disulfide MS, KI 701 1.73 2.21 2.20 2.15 0.167 0.229 Dimethyl trisulfide MS, KI 1,383 1.20 1.42 1.37 1.07 0.173 0.513
Sum of sulfurous compounds 1.86 2.28 2.26 2.19 0.139 0.234
Nitrogenous compounds (2)
NI 1612 1,612 1.55b 1.60ab 1.66a 1.39c 0.033 0.005
3-Phenylpropanenitrile MS, KI 2,048 1.40 1.56 1.69 1.25 0.179 0.498
Sum of N compounds 1.79 1.78 1.86 1.57 0.096 0.260
a–cMeans (n = 3) within a row with differing superscripts differ (P < 0.05) according to Fisher’s least squares difference test.
1MS = identification by comparison with National Institute of Standards and Technology mass spectral data; KI = identification by comparison with
intense (+0.7; P < 0.01) in cheeses from cows fed fresh herbage than in cheeses from cows fed conserved herb-age. Cheeses from grazing cows had a more intense dry fruit flavor (+0.4; P < 0.05) and weaker lactic odor (−1.0; P < 0.05) than cheeses from hay- and silage-fed cows. Creamy texture was more pronounced (+0.6; P < 0.05) when cows were grazing or were fed fresh herb-age indoors instead of being fed conserved herbherb-age. No other texture-related characteristics such as softness to the touch and firmness in the mouth differed among treatments.
Relationship Among Sensory and Physicochemical Variables in Cheese
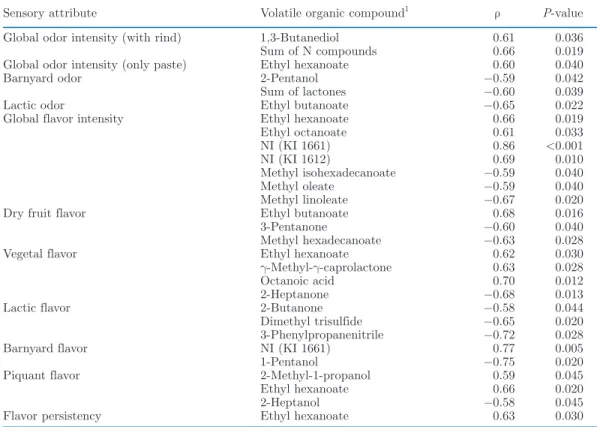
Increases in the redness (a*) and yellowness (b*) in-dexes measured instrumentally in the cheeses led to a positive linear increase in perceived color intensity (a* index: P < 0.001, ρ = 0.86; b* index: P < 0.001, ρ = 0.93). The spreadability index (ratio of cis-9-C18:1 to C16:0) was negatively related to instrumentally ana-lyzed strength to 40% deformation (P = 0.006, ρ = −0.74) and positively related to the intensity of creamy texture perceived by the panelists (P = 0.014, ρ = 0.68) and exudate attribute (P = 0.017, ρ = 0.67). The global flavor intensity was positively related to the barnyard
flavor intensity (P = 0.002, ρ = 0.79). Furthermore, an increase in the PTSN-to-TN ratio in cheese coin-cided with increasing perception of dry fruit flavor (P = 0.015, ρ = 0.68) and decreasing perception of lactic odor (P = 0.008, ρ = −0.72). Some correlations were also found between sensory attributes of the cheeses and desorbed VOC (Table 8). The concentration of ethyl butanoate was positively correlated with the dry fruit flavor (P = 0.016; ρ = 0.68) and negatively cor-related with the lactic odor (P = 0.022; ρ = −0.65). Ethyl hexanoate, ethyl octanoate, NI (KI 1661), and NI (KI 1612) were positively correlated with the global flavor intensity. In contrast, the concentrations of the methyl esters of isohexadecanoate, oleate, and linoleate were negatively correlated with the global flavor in-tensity. Ethyl hexanoate was also positively correlated with the global odor intensity of the cheese paste (P = 0.040; ρ = 0.60) as well as with the vegetal flavor (P = 0.030; ρ = 0.62) and the flavor persistence in the mouth (P = 0.030; ρ = 0.63). Lactic flavor inten-sity was negatively correlated with the concentration of 3 compounds (2-butanone, dimethyl trisulfide, and 2-phenylpropanenitrile). The intensity of the barnyard flavor was positively correlated with the concentration of the NI (KI 1661) compound (P = 0.005; ρ = 0.77), whereas the perception of barnyard odor was negatively
Table 6. Effect of herbage utilization method (HUM) and pasteurization (PAST) on the intensity of sensory attributes of the milk graded from 0 (low intensity) to 10 (high intensity) by 9 trained panelists
Attribute HUM SEM P-value Hay Silage Fresh grass
Pasture Indoor HUM PAST HUM × PAST Appearance Yellowness 3.60c 4.50b 6.19a 5.66a 0.216 <0.001 0.001 0.870 Fluidity 6.26 5.90 5.61 5.95 0.208 0.187 0.230 0.812 Odor Intensity 3.86b 4.26ab 4.61a 4.74a 0.178 0.003 0.018 0.534 Cooked milk 2.04c 2.37bc 2.85a 2.47ab 0.146 0.002 0.034 0.206 Cream 2.00b 2.63a 2.88a 2.56a 0.189 0.011 0.001 0.369 Barnyard 1.19b 1.56ab 1.90a 1.49ab 0.179 0.049 0.039 0.910 Hay 1.07 1.29 1.45 1.15 0.150 0.292 0.951 0.638 Flavor Intensity 4.73 5.01 5.23 5.06 0.158 0.166 0.008 0.705 Cooked milk 2.51 3.02 2.86 3.06 0.172 0.098 0.006 0.558 Cream 2.91 3.48 3.66 3.51 0.220 0.086 0.513 0.212 Hay 0.99 1.16 1.14 0.96 0.119 0.504 0.087 0.761 Barnyard 1.11 1.30 1.47 1.00 0.173 0.226 0.011 0.503 Fermented 0.54 0.67 0.82 0.56 0.096 0.141 0.238 0.579 Flavor persistency 4.10 4.28 4.53 4.23 0.189 0.431 0.013 0.532 Bitter 1.48 1.66 1.81 1.58 0.161 0.524 0.053 0.197 Sweet 3.49 3.66 3.25 3.48 0.190 0.501 0.439 0.580 Metallic 1.34 1.09 1.22 1.40 0.164 0.535 0.349 0.830 Astringent 1.89 1.63 1.93 1.69 0.194 0.628 0.193 0.837 Texture Creamy 3.76 4.16 4.33 4.30 0.231 0.271 0.106 0.426
a–cMeans (n = 6 per HUM) within a row with differing superscripts differ (P < 0.05) between HUM according to Fisher’s least squares
correlated with the concentration of 2-pentanol (P = 0.042; ρ = −0.59).
DISCUSSION
The descriptive sensory analysis in this study in-cluded raw and pasteurized milk. Milk pasteurization was previously shown to weaken the dietary effects on the flavor of Cantal-type cheese (Verdier-Metz et al., 2002; Cornu et al., 2009). In the case of milk, we found an increased intensity of odor (cream) and flavor attributes (cooked milk, barnyard) due to pasteuriza-tion but no interacpasteuriza-tion between effects of the herbage utilization method and pasteurization on milk sensory attributes, meaning that raw and pasteurized milk were similarly affected by herbage utilization method. However, pasteurization may have favored the process of oxidation in milk (Havemose et al., 2006), which is consistent with the increased cream and cooked odors of pasteurized milk found independently from the herb-age utilization method.
Differences Between Milk and Cheese from Conserved Versus Fresh Herbage
Although fresh and conserved forages did not origi-nate from the same growing cycle, the potential effect of a diverging botanical composition and phenological stage between the 2 cuts was likely minor. The second growth did not differ in terms of proportions of plant functional groups from the first growth, and the main plant species represented in the 2 growths did not differ greatly. In addition, the phenological stage after 9 wk of regrowth, when bulk milks for cheesemaking were col-lected, was similar to that given at the time of harvest of the first growth used for hay and silage production.
Color and Texture of Milk and Cheese. The sen-sory perception of lower yellowness of the milk and the instrumental yellowness of the cheese from groups fed conserved forages accord with the previously observed lower content of carotenoids in milk from silage-fed cows and especially from hay-fed cows (Nozière et al., 2006). Carotenoids are depleted through photo-oxidation
dur-Manzocchi et al.: HERBAGE UTILIZATION AND MILK AND CHEESE PROPERTIES
Table 7. Effect of herbage utilization method on the intensity of sensory attributes of Cantal-type cheeses graded from 0 (low intensity) to 10 (high intensity) by 10 trained panelists after 9 wk of ripening
Attribute Hay Silage
Fresh grass SEM P-value Pasture Indoor Appearance Color 1.83c 2.66b 3.66a 3.78a 0.157 <0.001 Color uniformity 7.53a 6.77b 6.86b 6.99b 0.165 0.009 Fat exudate 0.63c 0.93b 1.17b 1.48a 0.101 <0.001 Odor
Global intensity (with rind) 5.79 5.78 5.96 5.82 0.184 0.899 Global intensity (only paste) 5.51 5.08 5.73 5.29 0.190 0.101 Dry fruit/nuts 2.84 2.40 2.63 2.53 0.174 0.339 Barnyard 2.54b 2.14c 3.26a 2.79ab 0.194 0.002 Lactic 4.76a 4.80a 3.82b 4.28ab 0.264 0.037 Rancid 1.39 1.07 1.35 1.56 0.153 0.164 Silage 2.01 1.87 1.89 2.25 0.195 0.496 Taste Salty 5.53 5.86 5.99 5.40 0.176 0.069 Sour 4.49 4.55 4.94 4.26 0.260 0.323 Bitter 3.81 3.85 3.95 3.71 0.220 0.897 Flavor Global intensity 5.34b 5.45b 6.05a 5.47b 0.117 <0.001 Dry fruit/nuts 2.15b 2.15b 2.70a 2.47ab 0.160 0.046 Vegetal 3.78 3.37 3.72 3.58 0.199 0.475 Lactic 3.88 3.79 3.60 4.21 0.182 0.133 Barnyard 1.94b 1.87b 2.93a 2.32a 0.222 0.005 Piquant 2.70 2.66 3.23 2.83 0.300 0.524 Persistency 5.04 4.90 5.35 4.89 0.219 0.422 Texture
Softness (by touch) 2.29 2.39 2.61 2.76 0.195 0.320 Firmness (in the mouth) 4.73 4.51 4.35 4.64 0.192 0.526 Creamy 2.85b 2.83b 3.54a 3.42a 0.170 0.005
Granular 3.19 2.95 3.07 2.90 0.168 0.600 Residues (after swallowing) 3.63 3.16 3.61 3.23 0.245 0.390
a–cMeans (n = 3) within a row with differing superscripts differ (P < 0.05) according to Fisher’s least squares
ing herbage wilting and conservation, and the milk’s carotenoid content is directly related to the carotenoid intake (Nozière et al., 2006). The observed increase in fat exudation from cheese when cows were fed fresh herbage instead of conserved forages can be explained by the observed lower proportion of SFA and higher proportions of PUFA and MUFA in milk resulting in a lower fat melting point (Frétin et al., 2017). This ex-planation is also supported by the linear relationship of the spreadability index (ratio of cis-9-C18:1 to C16:0) with the creamy texture and instrumental texture traits in the present experiment. In addition, a higher PUFA proportion of the milk fat seems to be associated with an increased polarity of the fat globule membrane. This increased polarity lowers the membrane’s cohesion and consequently leads to a higher propension of milk fat globule membranes to disrupt during cheesemaking (Lopez et al., 2008; Lerch et al., 2015), which may help to explain the increased fat exudation of the cheeses from cows fed fresh herbage.
Milk Odor and Flavor. The differences found in the odor of the milk from cows fed conserved or fresh grass are consistent with previous reports in literature (Faulkner et al., 2018; Clarke et al., 2019). The
percep-tion of a stronger cooked odor in milk from cows fed fresh herbage may be associated with an increased pres-ence of sulfurous compounds. Dimethyl disulfide and its oxidation product dimethyl sulfone were found to be more abundant in milk from grazing animals than in milk from cows fed hay- or TMR-based diets (Moio et al., 1993; Coppa et al., 2011b; Villeneuve et al., 2013). Sulfurous compounds typically derive from the metabo-lism of sulfurous AA. Indeed, in contrast to conserved forages, diets based on fresh herbage were found to in-crease VOC formation from the metabolism of free AA by rumen microorganisms as a result of the higher ratio of protein to readily digestible carbohydrates (Bendall, 2001; Coppa et al., 2011b). Cooked and cream odors of the milk may also be related to lactones, which were previously found to be more abundant in milk from grazing cows compared with milk from TMR-fed cows (Bendall, 2001). Lactones are formed during the primary oxidation of PUFA (Urbach, 1990). Consis-tent with this, the proportions of LA and ALA were numerically higher in the lipids of the fresh than the conserved forages. Furthermore, ruminal lipolysis and rate of biohydrogenation of dietary lipids were reported to be higher with fresh herbage than with conserved
Table 8. Pearson correlation coefficients (ρ) between the intensity of sensory attributes and concentration of desorbed volatile organic compounds of Cantal-type cheeses after 9 wk of ripening
Sensory attribute Volatile organic compound1 ρ P-value
Global odor intensity (with rind) 1,3-Butanediol 0.61 0.036 Sum of N compounds 0.66 0.019 Global odor intensity (only paste) Ethyl hexanoate 0.60 0.040 Barnyard odor 2-Pentanol −0.59 0.042 Sum of lactones −0.60 0.039 Lactic odor Ethyl butanoate −0.65 0.022 Global flavor intensity Ethyl hexanoate 0.66 0.019 Ethyl octanoate 0.61 0.033 NI (KI 1661) 0.86 <0.001 NI (KI 1612) 0.69 0.010 Methyl isohexadecanoate −0.59 0.040 Methyl oleate −0.59 0.040 Methyl linoleate −0.67 0.020 Dry fruit flavor Ethyl butanoate 0.68 0.016 3-Pentanone −0.60 0.040 Methyl hexadecanoate −0.63 0.028 Vegetal flavor Ethyl hexanoate 0.62 0.030 γ-Methyl-γ-caprolactone 0.63 0.028 Octanoic acid 0.70 0.012 2-Heptanone −0.68 0.013 Lactic flavor 2-Butanone −0.58 0.044 Dimethyl trisulfide −0.65 0.020 3-Phenylpropanenitrile −0.72 0.028 Barnyard flavor NI (KI 1661) 0.77 0.005 1-Pentanol −0.75 0.020 Piquant flavor 2-Methyl-1-propanol 0.59 0.045 Ethyl hexanoate 0.66 0.020 2-Heptanol −0.58 0.045 Flavor persistency Ethyl hexanoate 0.63 0.030
likely because endogenous plant lipases are more active in the first (Doreau et al., 2005; Dewhurst et al., 2006; van Dorland et al., 2008). Among the evaluated sensory attributes, a more intense barnyard odor also character-ized milk from grazing cows compared with milk from hay-fed cows. This finding is considered to be associated with the increased presence of derivatives of phenols, indoles, and terpenoids such as p-cresol, phytol, indole, and skatole (Urbach, 1990; Moio et al., 1996; Bendall, 2001). These compounds result from the ruminal deg-radation of free aromatic AA and plant compounds such as carotenoids, flavonoids, and chlorophyll in the herbage (Yokoyama and Carlson, 1981; Moio et al., 1993). Toluene, a highly volatile aromatic hydrocarbon deriving from the degradation of β-carotene, may have especially contributed to the stronger odor intensity of milk from fresh herbage, although it has a high odor threshold. The VOC characteristic for the milk did not desorb from the cheeses in the present experiment be-cause their putative presence in milk has most probably been modified during cheesemaking and cheese ripen-ing. Indeed, cheese ripening causes enormous changes in the concentration of VOC in relation to the milk used for cheesemaking (Cornu et al., 2009; Bergamaschi and Bittante, 2018).
Cheese Odor and Flavor. In accordance with pre-vious studies, the global flavor of cheeses obtained from grazing cows in the present experiment was perceived to be more intense than that of the cheeses from cows fed conserved forages (Coppa et al., 2011c; Esposito et al., 2014; Giaccone et al., 2016). The main VOC that desorbed from the experimental cheeses were consistent with those previously reported in Cantal-type cheese (Frétin et al., 2019). Among the identified compounds, a few were previously described by GC-olfactometry as being odor active in Cantal-type cheeses (Cornu et al., 2009). These compounds were ethanol, butanoic acid, 3-methylbutanal, octanal, 2-nonanone, and 2-phenyl-ethanol. The negative correlation between the desorbed amounts of 3 compounds (2-butanone, dimethyl trisul-fide, and 3-phenylpropanenitrile) and the intensity of the lactic flavor is consistent with the observation that cheeses with more intense lactic flavor were character-ized by a slower catabolism of free AA and free FA and possibly reduced formation of VOC (McSweeney and Sousa, 2000). The correlation also coincides with the differences in global flavor intensity perceived by the panelists. Dimethyl trisulfide and 2-butanone are also relevant flavor compounds in other cheeses varieties, whereby the first derives from the degradation of free sulfurous AA and the second from 2,3-butanediol (Mc-Sweeney and Sousa, 2000). The global flavor intensity was negatively correlated with oleate, linoleate, and
isohexadecanoate methyl esters, which are compounds characterized by rather faint fatty odors and flavors (Garg et al., 2018). The concentration of these methyl esters may decrease along with increasing catabolism of free FA methyl esters in cheese.
The barnyard flavor, which characterized cheeses from both groups fed fresh herbage, greatly contrib-uted to their global flavor intensity. The mentioned compounds putatively responsible for barnyard flavor in milk (e.g., p-cresol) are rarely identified in Cantal-type cheeses. In our experiment, none of the mentioned compounds was detected in the headspace of the Can-tal cheese. However, an unidentified compound (KI 1661, putatively a branched-chain ester) was positively correlated with the intensity of the barnyard flavor in the cheeses. In accordance with previous observations (Martin et al., 2005; Giaccone et al., 2016), the dry fruit flavor was more intense in cheeses derived from grazing cows compared with cheeses from cows fed conserved forages in the present experiment. The intensity of the dry fruit flavor was positively related to the concentra-tion of ethyl butanoate, which is characterized by a strong sweet, ripe fruit flavor (Garg et al., 2018). Ac-cordingly, the fruity and nutty flavor found in Cantal-type cheeses from cows grazing on upland pastures was related by Cornu et al. (2009) to the increased presence of short-chain FA methyl esters (e.g., methyl hexanoate). These FA methyl esters may result from the incomplete esterification of FA to triacylglycerols in the mammary gland or from the increased lipolysis in milk (Cornu et al., 2009). Also aldehydes resulting from the proteolysis and subsequent degradation of free AA are associated with the dry fruit flavor, which was previously reported for Cheddar-type cheeses (Avsar et al., 2004). Indeed, 3-methyl-butanal, which has a specific nutty flavor, was higher in concentra-tion in cheeses from grazing cows in the present study, too. Consistently, the increased secondary proteolysis (PTSN-to-TN ratio) coincided with increased intensity of dry fruit flavor in cheeses in the present experiment. We found similar concentrations of 3-phenylpropaneni-trile in all cheeses. This compound may have originated from the rapeseed meal contained in the concentrate because 3-phenylpropanenitrile is a breakdown prod-uct of glucosinolates commonly found in Brassicaceae (Gu et al., 2011). The increased content of Mg in milk from cows fed fresh herbage may be due to a higher content or higher bioavailability of Mg in fresh herbage than in conserved forages fed in the present experiment or a higher Mg content in the herbage of the second growing cycle (Schlegel et al., 2016), but it was not correlated with any other compositional, technological, rheological, or sensory variable.
Differences Between Milk and Cheese from Cows Fed Hay or Silage
The results of our experiment confirm that feeding properly conserved and fed silage does not cause off-flavors in milk and cheese. This finding may not hold true when the conservation quality of the forages is poor or feeding is not performed according to good farming practice (Mounchili et al., 2005). Using triangle tests, Dubroeucq et al. (2002) detected sensory differences in raw milk from cows fed mountain grassland hay or ryegrass silage. In contrast, panelists perceived no differences in pasteurized milk from cows fed timothy grass conserved either as hay or as silage in the study of Villeneuve et al. (2013). In our experiment, milk from silage-fed cows had a stronger cream odor than milk from hay-fed cows. This outcome may have resulted from the higher proportion of PUFA (LA and ALA, in particular) in the silage lipids, followed by increased lipolysis and biohydrogenation of PUFA in the rumen when herbage is conserved as silage (Doreau et al., 2005). The higher PUFA proportion of the forage lipids may also enhance the formation of VOC such as lactones from primary lipid oxidation in milk (Havemose et al., 2006) and affect the availability of precursors of VOC that are characteristic for cream flavor. Consistent with this possibility, the concentration of total lactones was higher in cheeses from silage-fed cows compared with those from hay-fed cows. In addition, the concentra-tions of 3-methyl-1-butanol and 2-phenylethanol were higher in cheeses from silage-fed cows than in cheese from hay-fed cows. Both compounds may derive from the catabolism of free AA such as 2-phenylethanol from the catabolism of Phe, whereas 3-methyl-1-butanol may arise from the Strecker degradation of Leu (McSweeney and Sousa, 2000). In addition, the concentration of 3-methylbutanal, the aldehyde precursor of 3-methyl-1-butanol, was higher in cheeses from silage-fed cows than those from hay-fed cows. This finding may be an indication of a different AA catabolism in cheeses from silage- or hay-fed cows due to different microbial activ-ity. Ethanol that commonly results from silage fermen-tation and may be directly transferred to milk did not differ in concentration between cheeses, in accordance with Stefanon and Procida (2004). We observed no differences in the intensity of flavor descriptors of the cheeses between herbage conservation methods, which substantiates previous findings by Verdier-Metz et al. (1998) on Saint-Nectaire cheeses derived from cows fed hay and silage from the same plot of native mountain grassland. In contrast, studies of Verdier-Metz et al. (2005) and Serrapica et al. (2020) reported some flavor differences related to the herbage conservation method. Such sensory differences may be due to a different
dietary proportion of dicotyledonous species (ryegrass silage from temporary grassland versus permanent grassland hay; Verdier-Metz et al., 2005), or they could be related to the specific forage types (i.e., sorghum) and the specific processing technology of stretched curd cheeses (Serrapica et al., 2020). Similar to the study by Verdier-Metz et al. (1998), the present ex-periment avoided this effect by using herbage from the same permanent grassland for hay- and silage-making. As demonstrated by Stefanon and Procida (2004) for pressed cooked Montasio cheeses, it seems that sensory differences between cheeses from either hay- or silage-fed cows are mostly related to microbial processes occurring in milk and in ripening cheese. These dif-ferences may be even more pronounced in uncooked than in cooked pressed cheeses, but this possibility was not investigated in the present study. In addition, the slight differences in milk FA profile of hay- or silage-fed cows did not substantially affect the development of particular flavor notes, whereas cheese appearance (i.e., fat exudation) differed, as was observed earlier in Cantal-type cheeses from cows fed pasture versus hay or from pasture versus a maize silage–based diet (Coppa et al., 2011a,c; Frétin et al., 2019).
Differences Between Milk and Cheese from Grazing and Indoor Green-Fed Cows
To our knowledge, this study is the first to report differences in sensory properties of milk and cheese from grazing versus indoor green-fed cows. The global flavor intensity of the cheeses from the grazing cows was higher than that of the indoor green-fed cows. The proportion of grasses, legumes, and nonlegume forbs in the selected bites did not differ from the proportions in the fresh herbage offered indoors, as strip-grazing may have limited the extensive dietary selection of the grazing cows (Coppa et al., 2015a). Therefore, no gen-eral variation in forage selection behavior of the cows appears to have been responsible for the difference in global flavor intensity. The SCC in milk as well as the degree of lipolysis in milk and cheese did not differ be-tween grazing and indoor green-fed cows. This finding was unexpected because walking from and to pasture before and after milking may induce an increased SCC (Koczura et al. 2019) that may be associated with an increased lipolysis of the milk fat of grazing cows and consequently increase the availability of free FA partic-ularly susceptible to oxidation in the cheese. However, in the present study the pasture was very near to the barn, which may have limited this effect; it may still be relevant elsewhere. On the other hand, under similar grazing conditions Ferlay et al. (2006) found a lower lipolytic activity in milk from grazing cows compared
![Table 5. Volatile organic compounds detected in Cantal-type cheeses after 9 wk of ripening by solid-phase microextraction–GC/MS [arbitrary units, log 10 (peak area × 10 −5 )]](https://thumb-eu.123doks.com/thumbv2/123doknet/14519542.531141/10.918.73.844.149.1046/volatile-organic-compounds-detected-cantal-ripening-microextraction-arbitrary.webp)