• Aucun résultat trouvé

Asset prices and demand shocks

N/A
N/A
Protected

Academic year: 2021

Partager "Asset prices and demand shocks"

Copied!
153
0
0

Texte intégral

Loading

Figure

Figure 2. Price pattern. The figure plots the average DGTW-adjusted cumulative returns for the stocks sold during the  fire sale along with 95% confidence bands
Figure  3.  Order  flow  through  aware  brokers.  The  figure  plots  the  cumulative  order  imbalance  of  the  transactions  intermediated by aware brokers (green solid line) and unaware brokers (red dashed line) on the fire-sale stocks, excluding  tho
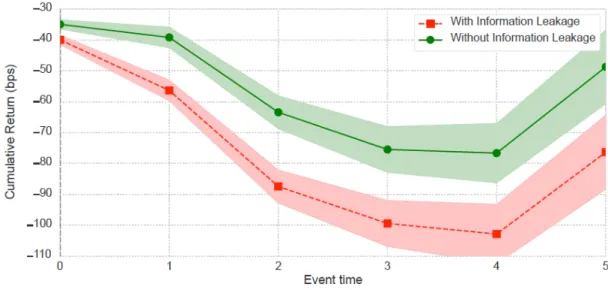
Figure 5. Price paths with and without information leakage. The figure plots the cumulative return of fire-sale stocks  during  fire-sale  events  involving  at  least  one  aware  broker
Table I  Summary Statistics
+7

Références

Documents relatifs

This report has been prepared by the Regional Office for the Western Pacific of the World Health Organization for governments of Kember States in the Region

Rives du Léman en automne Rives du Léman en automne Photography ©2014. Ref 8071177

[r]

[r]

Sale of the Sofitel Paris Le Faubourg under a €113m Sale & Management-Back agreement As part of its asset management strategy, Accor announces the sale of the Sofitel Paris Le

Le tout jeune Danube Le tout jeune Danube Photography ©2017 Ref 10406401 artmajeur.link/tNkmN4. Prints

[r]

[r]