Università della Svizzera italiana
and
Swiss Finance Institute
Doctoral Dissertation
Asset Prices and Demand Shocks
Author:
Thesis Advisor:
Andrea
BARBON
Prof. Francesco
FRANZONI
A dissertation submitted in fulfillment of
the requirements for the degree of
PhD in Economics
SFI PhD in Finance
in the
Institute of Finance
(Faculty of Economics)
Dissertation Committee:
Prof. Francesco FRANZONI, Università della Svizzera italiana
Prof. Laurent FRESARD, Università della Svizzera italiana
Abstract
My dissertation consists of three chapters, each of which focuses on a different area of
research in asset pricing.
The first chapter deals with the informational role of brokerage firms during fire sales in
the equity market. The second chapter exploits the ETF program by the bank of Japan as
a quasi-natural experiment to measure the slope of the equity demand curve. The last
chapter presents the application of a novel machine learning model, based on an attention
mechanism, to high-frequency data from the Nasdaq.
In the first paper, co-authored with F. Franzoni, M. di Maggio, and A. Landier, we use
trade-level data to study whether brokers play a role in spreading order flow information
in the stock market. We focus on sizeable portfolio liquidations from large investment
funds, which we name "fire sales", resulting in significant temporary price drops for the
liquidated stocks. Next, leveraging on our unique dataset, we identify the brokers who
intermediate these fire-sale trades. We show that these brokers’ clients are more likely to
predate on the liquidating funds than to provide liquidity. Predation leads to profits of
about 25 basis points over 10 days, on average, and increases the liquidation costs of the
distressed fund by 40%. This evidence suggests a role of information leakage in
exacerbating fire sales. The highlighted mechanism might be a concern to regulators as
well, since it can exacerbate the costs associated with fire sales, especially during times
of scarce liquidity.
In the second paper, co-authored with V. Gianinazzi, we focus on the Japanese equity
market to study a peculiar intervention by the Japanese central bank. Since the
introduction of its quantitative and qualitative easing program in 2013, indeed, the Bank
of Japan has been increasing its holdings of Japanese equity through large-scale purchases
of index-linked ETFs to lower risk premiums. We exploit the cross-sectional
heterogeneity of the supply shock to identify a positive and persistent impact on stock
prices, consistent with a portfolio balance channel. The evidence suggests that long-run
demand curves for stocks are downward sloping with unitary price elasticity. Moreover,
we are able to quantify the effect of the intervention, showing that the purchases of ETFs
tracking the price-weighted Nikkei 225 generate pricing distortions relative to a
value-weighted benchmark.
The third paper starts from the observation that, even though machine learning methods
are able to deliver superior forecasting accuracy, they can hardly be used to make
inference. To overcome this limitation, I propose an encoder-decoder neural network
augmented with an attention-based mechanism that can autonomously learn to identify
the most critical regions of the input data. I first train the model using high-frequency
message data from the NASDAQ and show that it outperforms other state-of- the-art
models in forecasting future transaction prices. Then, I develop a methodology that uses
the attention mechanism to make inference on the relative share of information content
of market orders versus limit orders, concluding that the most informative events are
executions of market orders while submission and cancellations of limit orders are less
relevant. Finally, I test the model’s behavior during the execution of real block orders
from institutional investors, showing that it favors liquidity provision rather than
front-running strategies.
Brokers and Order Flow Leakage:
Evidence from Fire Sales
Andrea Barbon, Marco Di Maggio, Francesco Franzoni, and Augustin Landier
∗Abstract
Using trade-level data, we study whether brokers play a role in spreading order flow information in the stock market. We focus on large portfolio liquidations which result in temporary price drops, and identify the brokers that intermediate these trades. These brokers’ clients are more likely to predate on the liquidating funds than to provide liq-uidity. Predation leads to profits of about 25 basis points over 10 days and increases the liquidation costs of the distressed fund by 40%. This evidence suggests a role of information leakage in exacerbating fire sales.
∗Barbon: USI Lugano and Swiss Finance Institute; Di Maggio: Harvard Business School and NBER; Fran-zoni: USI Lugano, Swiss Finance Institute, and Center for Economic Policy and Research; Landier: Toulouse School of Economics. Corresponding Author: Francesco Franzoni, ([email protected]). We thank Malcolm Baker, John Campbell, Laurent Fresard, Slava Fos (discussant), Joel Hasbrouck, Terry Hendershott (discussant), Gary Gorton, Owen Lamont, Jongsub Lee (discussant), Andrew Lo, Toby Moskowitz, Abhi-roop Mukherjee (discussant), Cameron Peng (discussant), Erik Stafford, and seminar/conference participants at Aalto University, the Becker Friedman Institute CITE conference on New Quantitative Models of Finan-cial Markets, Bocconi University, EIEF, FCA, FINRA Market Structure conference, FIRS, LAEF 2nd OTC Markets and Securities Workshop, INSEAD, Macro-Prudential Conference ECB, New York Federal Reserve Bank, AQR, UC Dublin, and WFA for helpful comments. Augustin Landier directs financial research at AXA-Investment Management Chorus, a quantitative asset management affiliate of Axa-IM. Neither Andrea Barbon, Marco Di Maggio, Francesco Franzoni nor any of their relatives have received significant financial support from any interested party, or have positions in relevant organizations. The authors have signed a nondisclosure agreement for the proprietary data used in this study.
1 Introduction
Large institutional orders are typically split into smaller amounts over time to avoid moving
the market (see Garleanu and Pedersen (2013), Di Mascio, Lines and Naik (2016)). One
concern when executing an order over time is that other traders might anticipate the intent to
trade the stock in the near future and trade in the same direction to benefit from the future
price impact. This problem is particularly pronounced in the case of fire sales, during which
the seller is forced to bring to the market a large quantity of assets in a limited amount of
time (Coval and Stafford, (2007), Ellul, Jotikasthira and Lundblad (2011)). Moreover, if the
liquidation occurs during a time of market stress, predatory trading can make the market more
illiquid and amplify adverse shocks (Greenwood, Landier, and Thesmar (2015)). Given this
possibility, some observers suggest that reducing the frequency of portfolio disclosure can
help prevent predatory behavior (Brunnermeier and Pedersen (2005)).
However, the market may possess information about forced liquidations due to broker’s close
relationship with the liquidating managers. Brokers are uniquely able to observe the daily
trades of a fund. In the case of hedge funds, prime brokers also operate as lenders and risk
managers, and thus they know when a fund is about to breach some risk limit and deleverage
its portfolio. They can also infer their client’s trading habits, such as whether a client tends
to cut trades into small orders over several days when executing a large order. Thanks to this
information, brokers are well placed – indeed they may be best placed among market
participants – to predict the future trades of their clients.
In an effort to establish a reputation as a source of valuable information and attract new
business, brokers may leak the news that a client’s large trade is likely to extend over time,
as other investors can use this information to predate on the distressed fund. Alternatively,
brokers may be reluctant to foster predatory trading against a client, as doing so may work
against their reputation. According to the latter argument, brokers should instead invite other
traders to provide liquidity and take the other side of the slow trade. Thus, whether brokers
foster predatory trading or whether they support liquidity provision in the case of slow trading
by a client is an open empirical question. In this paper, we shed light on such a question using
data on
f
orced liquidations of portfolio holdings.
1Specifically, we exploit proprietary
1 We focus on large liquidations (which for convenience we label “fire sales”), that is, we do not include large purchases in
our analysis, because we aim to cleanly identify liquidity-motivated trades. In our data, the majority of institutional investors are long-only (about 90%) and thus a sale is less likely to be information motivated (as the manager would need to already have the stock in her portfolio) than a buy transaction. In addition, large cash inflows can be allocated slowly over time and are, therefore, less likely to impose a concentrated liquidity demand on the market than large outflows., Fire sales can also
level data to identify asset managers that sell a significant fraction of their portfolio over a
relatively short amount of time. We restrict attention to asset managers whose order flow is
abnormally negative for at least five days in a row. Moreover, we focus on managers that
liquidate multiple stocks (on average about 20 stocks) at a significantly faster pace than usual.
We identify approximately 400 events satisfying these criteria over the period 1999 to 2014.
We verify that the stock price movements resulting from such sales are only temporary,
consistent with the identification of liquidity events – the price impact would have to display
a permanent component if sales were motivated by fundamentals.
Not all brokers employed by a liquidating fund will be aware that the fund is in distress. The
liquidating fund has little incentive to disclose its intention to liquidate a large fraction of its
portfolio. Indeed, it is likely to use multiple brokers (on average 29) to minimize the price
impact and information leakage. We therefore label as aware only those brokers that
intermediate a large enough fraction of volume. We find that the probability of predatory
behavior is significantly higher for orders executed through aware brokers. In particular,
clients of aware brokers are much more likely to execute sell trades in the same stocks with
the same broker over the same period. While clients of aware brokers also engage in liquidity
provision, this activity does not appear to be as prevalent as predatory trading.
We next explore the extent of heterogeneity across different clients of aware brokers. If
brokers leak information about order flow, they are more likely to leak information to their
best clients, that is, to those clients from which they
extract the highest rents.
As proxies for
the strength of the investor-broker relation, we employ both the trading volume and the
commissions generated by a client.
Using both measures we find
that best clients of the aware
brokers are significantly more likely than other clients to sell the stocks that the liquidating
manager is offloading during the fire sale compared to immediately before the fire sale.
2,3The magnitude of this result is economically significant: the net probability of predation for
the best clients of aware brokers is more than twice that for the small clients of aware brokers.
This evidence suggests that predation is more likely than liquidity provision among the best
clients of the brokers that intermediate fire sales. As additional evidence of predatory trading,
we find that a significant fraction of the positions sold by other managers than the distressed
pose a systemic threat if they cause a propagation of idiosyncratic shocks to the balance sheets of other investors. Hence, studying the effect of information leakage on fire sales is especially relevant, including from a regulatory perspective.
2 We find that these relations are extremely persistent, consistent with the findings in Goldstein et al. (2009), which suggests
that brokers might have an incentive to nurture such relations.
3 We control for time, manager, event, stock, and broker fixed effects. Hence, differences across stocks, such as their
liquidity, or across brokers, such as their ability to execute, cannot explain our results. We also run a specification in which we control for broker-manager relationship fixed effects, which controls for the matching between asset managers and brokers. The results, which are in the Internet Appendix, are qualitatively similar.
fund during the fire-sale period (30% to 42%), are bought back in the 10 days following the
fire sale.
We conduct several robustness checks to rule out the possibility that a fire sale’s originator
and followers are trading in response to a common information signal. We first exclude from
our sample all events that occurred during recessions. We next exclude all events that occur
around earnings announcements, changes in analyst recommendations, or any other type of
negative news as reported by the press and classified by the data provider Ravenpack. We
further exclude stocks with negative momentum and high short interest to mitigate the
concern that selling managers follow similar trading strategies founded on a negative signal
on the stock. In each case, our results continue to hold.
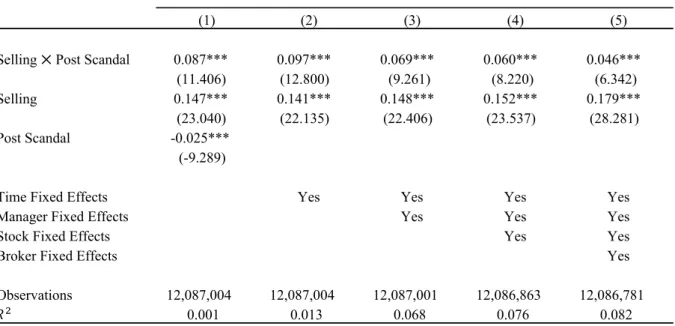
To strengthen our identification of fire-sale events, we examine a natural experiment in which
some mutual funds were forced to liquidate their holdings. Specifically, as a consequence of
the late-trading scandal of 2003, 27 fund families experienced significant outflows. Anton
and Polk (2014) use these outflows to identify an exogenous determinant of mutual funds’
selling activity. Kisin (2011) estimates that funds of implicated families lost 14.1% of their
capital within one year and 24.3% within two years. Important for our purposes, the brokers
of the liquidating funds were aware of both the specific stocks that were being sold and the
timing of these liquidations. We show that, after the scandal broke out, the clients of the
relevant brokers were significantly more likely to liquidate the same stocks on the same days
on which the implicated funds are also selling. Our results thus continue to hold even when
we consider plausibly exogenous variation in the source of the liquidation, which increases
our confidence in our findings.
One of the contributions of our paper concerns the value of order flow information. We
compute the profits that asset managers make during fire sales and show that the best clients
of aware brokers, that is, the investors most-likely to benefit from information leakage, are
able to earn an additional 25 basis points (bps) in the few days of the fire sale. Given average
fund performance, these results suggest that being able to predict fire sales can be quite
profitable.
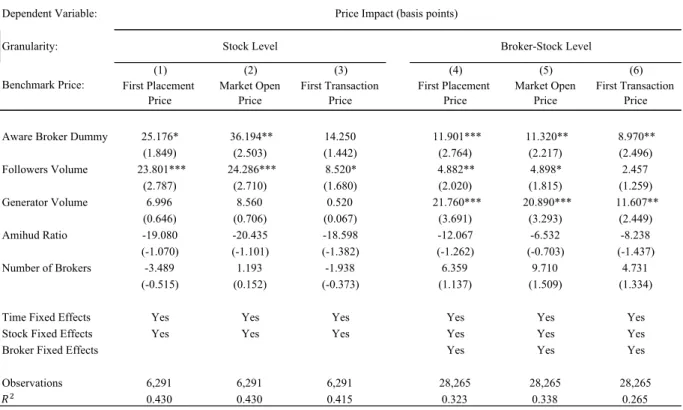
We also provide evidence on the externalities arising the losses incurred by managers
exposed to predation. Focusing on the execution shortfall, which we compute as the
volume-weighted percentage difference between the execution price and a benchmark price, we find
that the price impact is about 40% higher when the trades are executed through brokers that
are aware of liquidations. We interpret this spread as the cost of predation. Our evidence also
highlights an important mechanism through which asset price fluctuations are amplified.
We conclude by addressing the question of what brokers gain from leaking order flow
information. To do so, we examine brokers’ commissions. We find that, relative to other
clients of aware brokers and relative to the period before the fire sale, the best clients – those
who take advantage of the order flow information by preying on the liquidating funds – pay
16% higher commissions in standard deviation units. We thus document that brokers get
rewarded for the information they provide.
Overall, our findings highlight an important trade-off between slow trading execution meant
to reduce the price impact, as, for example, in Kyle (1985), and leakage of order flow
information. The latter becomes more likely when asset managers trade in the same direction
over an extended period of time. This consideration is not confined to fire-sale events. Indeed,
we find that the autocorrelation among large trades, that is, those larger than 1% of average
daily volume, in our data is about 35%. Hence, as a rule, managers tend to trade in the same
direction over multiple days, which opens the possibility for brokers to predict future order
flow.
Our paper bridges a vast literature on fire sales
4and a growing literature on the role of
networks among market participants in various domains, including Li and Schürhoff (2018),
Di Maggio et al. (2018), Di Maggio, Kermani, and Song (2017), Hollifield, Neklyudov, and
Spatt (2016), Afonso, Kovner, and Schoar (2013) and Hendershott et al. (2016). Our novel
contribution is to highlight the key role played by brokers during fire sales, which might be
amplified due to brokers leaking order flow information.
54 Theoretically, Shleifer and Vishny (1992, 1997) and Kiyotaki and Moore (1997) suggest that fire sales occur when the
natural buyers are unable to purchase assets due, for instance, to agency problems. Brunnermeier and Pedersen (2005) and Di Maggio (2016) show that the market might become illiquid exactly when liquidity is needed most due to unconstrained arbitrageurs taking advantage of the temporary price pressure by selling and then buying the asset back only after the fire sale has ended. See Shleifer and Vishny (2011) for a survey of this literature. Studies on fire sales and price dislocations in financial include, among others, Allen and Gale (1994), Gromb and Vayanos (2002), Brunnermeier and Pedersen (2009), Acharya, Gale, and Yorulmazer (2011), and Garleanu and Pedersen (2011). Recently, Yang and Zhu (2016) provide a two-period Kyle (1985) model of “back-running” where, in addition to informed and noise traders there exists an investor who learns from the order flow generated by the informed speculator after the order is filled.
5 Our findings also relate to a growing literature examining the way in which information spreads in financial markets, for
instance, via to information percolation (Duffie, Malamud, and Manso (2009, 2014)), or network effects (Babus and Kondor, (2016) and Walden, (2016)). We contribute to this literature by providing empirical support to the notion that information can be readily disseminated through interactions between intermediaries and market participants. Furthermore, our results can inform future theoretical developments of this literature as we point out that this information dissemination is strategic, a feature that is missing from existing theoretical literature and that drives network formation in financial markets. Also related to our paper, Farboodi and Veldkamp (2017) develop a long-run growth model in which traders have the option to extract information from order flow data-mining and examine the implications for price informativeness and market liquidity.
Our paper also relates to prior studies documenting that brokers leak value-relevant
information to selected clients in other contests. For instance, Irvine, Lipson, and Puckett
(2006) find evidence of such information leakage with respect to future analyst
recommendations, McNally, Shkilko, and Smith (2015) show that brokers share information
about firm insiders’ order flow, and Di Maggio et al. (2018) document broker dissemination
of informed order flow.
In a recent paper closest to our work, van Kervel and Menkveld (2018) study the behavior of
high-frequency traders (HFTs) around large orders of institutional investors. The authors find
that HFTs provide liquidity if the order is short-lived (below seven hours) but back-run on
the order if it lasts several hours within a day, that is, they trade in the same direction of
information-motivated orders. The latter behavior increases trading costs for the institution,
as predicted by Yang and Zhu (2016). Similar to van Kervel and Menkveld (2019), we study
the interplay among institutional investors and we detect trading behavior by other investors
that is harmful to the initiator of a large order. Our evidence differs from and complements
their results along several dimensions. First, we focus explicitly on liquidity-motivated orders
(i.e., fire sales) and show that predation occurs in these circumstances as well, not just around
information-motivated trades. Second, we show that predatory behavior also characterizes
traditional asset managers, not just HFTs.
6Third, we identify institutional brokers as
instrumental in spreading order flow information and fostering predation. Finally, we
highlight a systemic threat caused by predatory trading, showing that it can amplify price
dislocations during fire sales.
7The remainder of the paper is organized as follows. Section I describes our data sources and
presents summary statistics. Section II discusses our main results on the behavior of asset
managers and the role of brokers during fire sales. Section III presents results on the value of
order flow information. Finally, Section IV concludes.
6 Our paper does not focus on high-frequency predation because HFTs are not present in our data. However, the question
of liquidity provision versus predation, which we address, has received increasing attention in the HFT literature. Moreover, the destabilizing effect of predation during fire sales that we document also finds a counterpart in studies focusing on the impact of HFTs on market efficiency and volatility. Biais and Foucault (2014), O’Hara (2015), and Menkveld (2016) provide surveys of the rapidly growing HFT literature. Several empirical studies find that HFT activity is beneficial in that it reduces transaction costs (Hendershott, Jones, and Menkveld (2011); Hasbrouck and Saar (2013); Menkveld, (2013); Brogaard et al. (2015); van Kervel (2015)) and improves price efficiency (Boehmer, Fong, and Wu (2014); Brogaard, Hendershott, and Riordan (2014)). The evidence on the relation between HFTs and short-term volatility and crashes is mixed.
7 Our results are also consistent with Chung and Kang (2016), who use monthly hedge fund returns to document
2 Data and Summary Statistics
To examine whether and how brokers leak order flow information during fire sales, one needs
detailed trade-level data that also contain information on the institutional investors and
brokers involved in each trade. We obtain such data from Abel Noser Solutions, formerly
Ancerno Ltd. (we use the name “Ancerno” for simplicity). Ancerno performs transaction cost
analysis for institutional investors and makes these data available for academic research
under an agreement of nondisclosure of institutional identity.
We have access to identifiers for managers that initiate trades and brokers that intermediate
those trades from 1999 to 2014.
8There are several advantages to this data set. First, clients
submit this information to obtain objective evaluations of their trading costs, not to advertise
their performance, which implies that the data are not likely to suffer from self-reporting bias.
Furthermore, while Ancerno collects trade-level information directly from hedge funds and
mutual funds when they use Ancerno for transaction cost analysis, another source of
information derives from pension funds that instruct the funds they are invested in to release
their trading activities to Ancerno for an independent check. Third, Ancerno is free of
survivorship bias as it includes information about institutions that report in the past but at
some point terminated their relationship with Ancerno.
Previous studies (e.g., Puckett and Yan (2011), Anand et al. (2012, 2013)) show that the
characteristics of stocks traded and held by Ancerno institutions and the return performance
of these trades are comparable to those in 13F mandatory filings. Furthermore,
using an
earlier version of our data, Goldstein, et al. (2009) provide a useful description of the
institutional brokerage industry and show that institutions value long-term relations with
brokers. They further show that, consistent with our results, the best institutional clients are
compensated with superior information around changes in analyst recommendations.
Ancerno information is organized into different layers. At the trade level, we have the
transaction date and time (at the minute level of precision for a subset of trades), the execution
price, the number of shares traded, the side (buy or sell), and the stock CUSIP. We carry our
analysis at the ticket level, we aggregate all trades on the same stock on the same side of
market (buy or sell) by the same manager executed through the same broker on the same day.
8 Relative to the standard release of Ancerno that is available to other researchers, we also obtained manager and broker
identifiers for the latest years (that is, after 2011), under the agreement that no attempt be made to identify the underlying institutional names.
Next, we define a fire-sale event. Our goal is to identify liquidity-motivated sales that attract
brokers’ attention and are likely to generate a significant but temporary price impact. We
therefore impose two requirements. First, for a given manager, the selling volume needs to
exceed the manager’s standard trading volume for a protracted period.
9Second, at the stock
level, the liquidation volume needs to make a sufficient fraction of total trading volume.
More specifically, to identify liquidating funds we start by computing the signed volume
Z-score for each manager m on day t as
Z
"#=
&'()
*+– - &'()
*+. &'()
*+,
(1)
where &'()
*+is the portfolio-level dollar volume traded by manager m on day t. The mean
and standard deviation of &'()
*+are estimated over a rolling window of 120 trading days
ending one week before day t. Next, for a given manager we require that during a fire-sale
event, Z
"#be below -0.25 for at least five consecutive trading days. This requirement ensures
that the sale takes place over a sufficiently long period of time for the broker to become aware
of the fire sale and for it to represent a significant event in the life of the fund. Given this
condition, all of the fire sales that we identify correspond to events in which the order
imbalance at the fund level is negative, as can be seen in Table IA.VIII in the Internet
Appendix.
In addition, we impose a filter at the stock level to ensure that the sale volume is large enough
to generate price pressure. For stock j to be part of a fire-sale event, we require that the
volume traded by the manager equal at least 1% of the CRSP volume on day t for at least
four out of the five fire-sale days.
We decide to keep events in which at least 10 stocks are involved in a fire sale. The goal is
to reduce the probability that liquidating funds are selling as a consequence of stock-specific
9 Our analysis is at the manager code level, that is, at the level of the management company. We focus on the management
company level for several reasons. First, our definition of fire sales selects events that are particularly large for an asset manager. In this sense, fire sales are likely to arise when multiple clients withdraw their funds from a management company, in which case focusing on a specific client-manager relationship may miss these larger events. Second, if only one fund in the company is in distress, or just a few, other funds can help by providing liquidity. Specifically, the healthier funds can relieve the distressed fund of some of its assets by engaging in cross-trading, a practice that is described in Gaspar, Massa, and Matos (2006) and more recently in Eisele et a. (2017) using Ancerno data. The possibility of intra-family subsidization motivates us to focus on events that involve the entire family of funds. Finally, the choice to focus on the management company, as opposed to specific funds within the family, is also driven by data availability. In the Ancerno data that are available to us, the alphanumeric identifier for the specific fund (manager) is often missing or not meaningful.
information. Focusing on liquidations of a large number of stocks makes it less likely that
the sales are driven by information.
Next, we distinguish between aware and unaware brokers. Broadly speaking, we say that a
broker is aware that a stock is subject to fire-sale pressure if it intermediates sufficiently large
volume on that stock arising from the originator. More specifically, for broker b, stock j, day
t, and event e combination,
01234
5,6,*,7equals one if the volume on stock j originated by the
liquidating fund that is intermediated by broker b on day t is above 2% of the average daily
volume (ADV) for that stock. Note that this definition does not require that the broker have
knowledge of the overall size of the liquidation. Rather, it simply requires that the broker
realize that the distressed fund is responsible for a significant fraction of daily volume. In
Table IA.I of the Internet Appendix we show that our main results are robust to using
different ADV-related thresholds to identify aware brokers (for thresholds from 1% to 5%).
In addition, we show that our results are robust to also requiring that the broker intermediate
a large volume of at least N stocks in the fire-sale basket to become aware of the fire-sale
event (for N = 1, 5, 10).
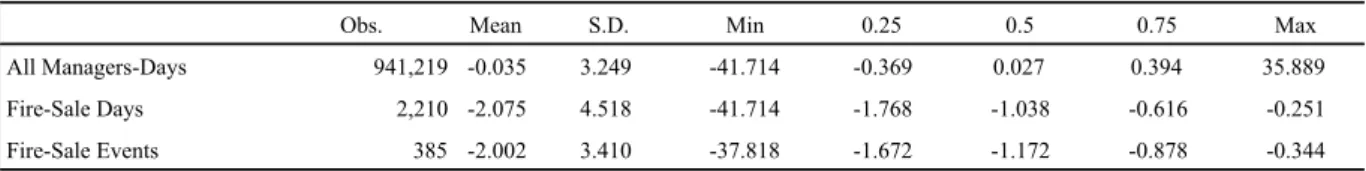
Panels A through C of Table I provide summary statistics for the key variables in our analysis.
We identify a total of 385 fire-sale events over the 1999 to 2014 period. Each of these events
lasts at least five days, and the liquidating funds sell on average $377 million worth of stock
(median $177 million). Figure IA.2 displays the distribution of events over our sample
period. As can be seen, these the events are distributed fairly evenly over time. Indeed, even
during the recessions marked with red squares, the number of fire-sale events does not spike.
This evidence suggests that our methodology identifies funds subject to idiosyncratic shocks
rather than market-wide events.
10We can compute the fraction of the liquidated portfolio that the liquidation volume
represents. To do so, we estimate liquidating funds’ portfolios by cumulating their trades
over the two years prior to the fire sale. We then divide the total volume of stocks sold by the
reconstructed portfolio size. We find this fraction is sizeable, at 9.16% on average. Notably,
this methodology is likely to underestimate liquidating managers’ actual portfolios, since we
do not know their positions at the beginning of the estimation period, in which case the
fraction that we compute represents an upper bound. Nevertheless, this evidence further
10 The lack of clustering of fire-sale events during crisis periods is an intentional feature of our definition of fire sales. In
computing the Z-score, in the numerator we subtract from a given day’s order flow the average daily order flow over the prior six months. Hence, if the order flow is negative over a protracted period, such as during a crisis, at some point the Z-score will cease to identify fire sales. The advantage of this feature is that we do not generate a sample of fire sales in which crises are overly represented.
suggests that our sample of large sales is unlikely to be inspired by stock-specific
information.
We also find that, on average,
22 stocks are heavily sold during a fire-sale event, with about
$17.2 million sold in each stock. Thus, our fire-sale events involve more than just isolated
stocks. Figure IA.1 shows the distribution of fire-sale events as a function of the number of
stocks, for events involving 10 to 50 stocks, as well as the distribution of the volume of trades
by the
liquidating
fund, which can reach more than two billion dollars in some cases.
We further find that fire sale
s are intermediated by an average of 29 brokers, while the
number of aware brokers per event is on average only 1.7. In addition, the price of the stocks
sold in a fire sale declines by 83 bps on average during the first five days of the event (Table
I, Panel C), but there is significant variation in the magnitude of the change; for the bottom
quartile, for instance, the price drops by more than 3%.
Using TAQ data, we find that fire-sale volume is on average 50% of the TAQ order
imbalance (median 10%) and 27% of TAQ sell volume (median 19%). These results imply
that the liquidating fund imbalances constitute a sizeable fraction of the TAQ imbalance for
fire-sale stocks.
In Panel E of Table I, we provide evidence on the type of stocks that liquidating managers
are selling. For each stock in a fire sale, we compute the fraction of the total volume of the
fire sale that it represents. We then regress the fraction of the fire sale that stock j represents
on its weight in the selling manager’s reconstructed portfolio, market capitalization,
volatility, Amihud (2002) ratio, and various measures of past performance at different
horizons. We find that, after controlling for the quantity held by the manager (i.e., portfolio
weight), funds tend to sell the larger, more liquid, and less volatile stocks in their portfolio.
Asset managers also tend to sell stocks with higher past performance. These findings are
consistent with the predictions of theoretical models studying the liquidation strategies in the
case of distress (Scholes (2000), Brown, Carlin, and Lobo (2010)). Moreover, the highly
significant positive coefficient on the reconstructed portfolio weight suggests that the
liquidating funds are not building short positions but rather they are selling positions that are
already present in their portfolio, which provides further support for our strategy for
identifying fire sales.
Finally, in Panel F of Table I, we investigate the sequence of sales by changing the dependent
variable to first day in which the stock is sold, which we calculate as the number of business
days from the first day of the fire sale in which a particular stock is sold for the first time.
The results show that the most liquid and less volatile stocks are sold earlier.
3 Main Results
In this section, we start by discussing our empirical strategy. We then present our main
evidence on the role of brokers in spreading order flow information during fire-sale
events.
3.1 Fire Sales
We start our analysis by characterizing the fire-sale events. Figure 1 plots the average
(across stocks and events) daily signed volume (i.e., order imbalance) of
liquidating
funds during the event window, where day zero is the first day of the five-day window
over which we identify a fire sale. The large negative volume before day 0 is due to
the fact that, while liquidations likely start earlier, we impose stringent criteria for
them to be classified as a fire sale. We note that while the daily order imbalance is
smaller in magnitude after five days, it is still negative after 15 days. This observation
is important, because it indicates that in general liquidating funds do not repurchase
the liquidated stocks back (even when we extend the horizon further out) and thus are
not simply selling a stock short because they expect the price to decline, after which
they buy the stock back.
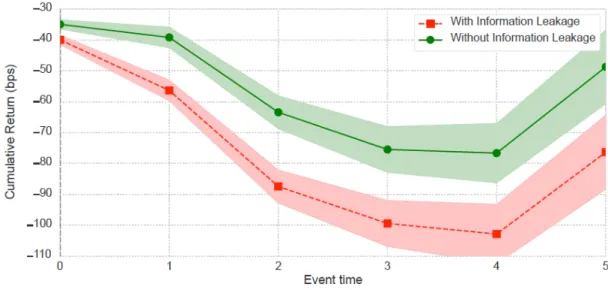
Figure 2 plots the average DGTW-adjusted (Daniel, Grinblatt, Titman, and Wermers
(1997)) cumulative returns for the stocks included in the fire sales across all events.
As can be seen, returns are mostly flat pre-event. They then precipitate quite rapidly
as the liquidating fund (for simplicity, the originator) sells most intensely,
that is,
during the five-day interval [0,4]. Returns then start to recover slowly over time.
Specifically, we find that return are back to pre-event levels after about 20 days. This
reversal is faster than what is documented in prior literature on fire sales (Coval and
Stafford, (2007)). On average, the price drops by almost 1% during the interval [0, 4],
which we refer to as the liquidation period. Importantly, the fact that we observe a
reversal over such a short horizon helps rule out the possibility that the liquidation
and corresponding price decline are due to negative fundamental news on the stock.
On the contrary, the price path is strongly consistent with price pressure following
liquidity motivated trades.
3.2 Predation or Liquidity Provision?
The theoretical literature makes mixed predictions as to whether market participants
that anticipate a large liquidity order will predate upon it or provide liquidity.
Brunnermeier and Pedersen (2005) and Di Maggio (2016) predict that investors that
become aware of a liquidation will predate on the distressed fund which will decrease
market quality. In contrast, Admati and Pfleiderer (1991) develop a “sunshine
trading” model, in which they argue that investors credibly announcing their intention
to transact for non-fundamental reasons attract natural liquidity providers to the
market. Bessembinder et al. (2016) provide empirical evidence that is consistent with
the latter prediction in the context of predictable roll trades of oil futures contracts by
a large ETF. The type of behavior that other market participants adopt vis-à-vis a
liquidating fund, however, remains an open empirical question.
To determine whether brokers foster predatory trading or liquidity provision, we
estimate the following specification
849 :34;29<(=
+,>,6,*,7= ?
@01234
>,6,*,7+ B
+,>,6,*,7,
(2)
where 01234
>,6,*,7is a dummy equal to one if broker b executing the trades is aware
of the sale on stock i on day t as part of fire-sale event e. The dependent variable,
849 :34;29<(=
+,>,6,*,7, is given as the difference between the probability of predation
and the probability of liquidity provision. The probability of predation is a dummy
equal to one if client m of broker b trades in the same direction as the originator
(i.e.,
demands liquidity) on stock i on day t of event e, the dummy is equal to zero if the
client provides liquidity by trading in the opposite direction of the originator or if the
client does not trade on that stock-day.
11Symmetrically, the probability of liquidity
provision is equal to one if the client trades in the opposite direction of the fire sale,
and zero otherwise. We also estimate specifications in which the dependent variable
11 To identify non-trading clients, we consider all managers that traded with the broker in that stock over the previous 20
is defined as the net predation variable multiplied by the ratio of the dollar volume of
the broker’s clients to the market capitalization of the stock (this variable is
standardized by subtracting the mean and dividing by the standard deviation). The
sample includes trades executed by all managers with all brokers in the database on
the fire-sale stocks.
These specifications rely on heterogeneity across brokers for identification, that is,
they rely on the fact that some brokers are more exposed to order flow information as
they intermediate a higher fraction of the liquidating fund’s order flow.
12Standard
errors are clustered at the broker level. In the Internet Appendix, we report analogous
results with clustering at the broker´stock and the broker´day levels (Table IA.VI).
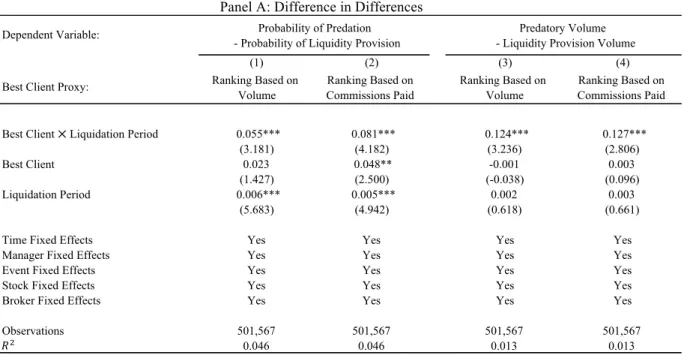
Table II, Panel A presents the results. Columns (1) and (2) focus on Net Predation,
that is,
the difference between the predation and the liquidity provision dummies,
while columns (3) and (4) report results for the volume-weighted version of the
dependent variable. Columns (1) and (3) also include manager and broker fixed effects
to ensure that our estimates are not driven by unobservable broker or manager
characteristics. Columns (2) and (4) also include day´stock fixed effects, which help
rule out two alternative explanations. First, asset managers might sell a stock due to
stock-specific public news. Day´stock fixed effects would capture these potentially
important confounding factors. Second, predation might be driven by information
about prices and trades, rather than by information leakage. For instance, the price
impact and abnormally high volume resulting from liquidations are publicly
observable, and hence information that asset managers can use to spot trading
opportunities without relying on brokers.
We find that trades executed by aware brokers have between 11% and 20% higher
probability of predation relative to liquidity provision.
13The results based on volume
in columns (3) and (4) confirm this finding.
12 The subset of brokers classified as aware during our sample period corresponds to roughly 10% of the brokers present in
Ancerno.
13 In Internet Appendix Table IA.IX, we report results from specifications without the fixed effects. In these specifications,
the constant, that is, the level for unaware brokers, is virtually zero, while the slope on the aware dummy is 23%. Hence, the economic magnitude is substantial. The Internet Appendix is available in the online version of this article on the Journal of Finance website.
In Panels B and C, we separately study the relation between broker awareness and the
probability of predation and liquidity provision, respectively. While we find evidence
of a significant positive relation between broker awareness and predation, the effect
on liquidity provision is not clear and is positive and significant only in the
specifications in which liquidity provision volume is the dependent variable. Even
there, the effect is smaller than for predatory volume.
Another way to shed light on predation versus liquidity provision is to compare the
cumulative order imbalance from the start of the fire sale, where the cumulative order
imbalance is the difference between buy and sell trades divided by the sum of the two.
Figure 3 plots this series for aware and unaware brokers with standard error bands
during the fire-sale events. In line with the regression evidence reported in Table II,
the imbalances through the aware brokers are negative during the first several days of
a liquidation event and are significantly lower than those through the unaware brokers.
Overall, the results in this section show that those brokers who are more likely to
realize that a fund is engaged in a large liquidation are also more likely to intermediate
trades that are consistent with predatory trading. In contrast, evidence that aware
brokers facilitate liquidity provision is limited at best.
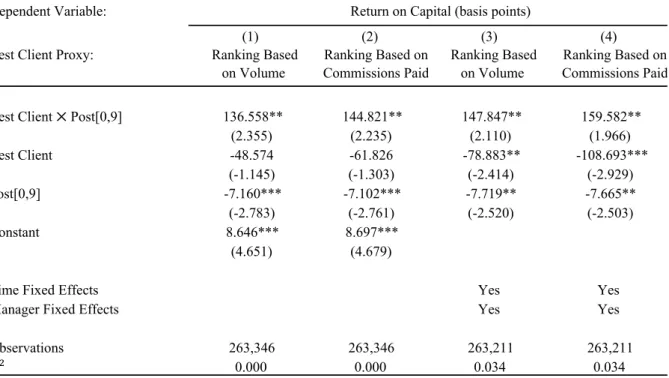
3.3 Best Clients and Predatory Trading
To sharpen our identification, we test another implication of our information leakage
hypothesis. If the aware brokers leak information about order flow from
liquidating
managers, and if these brokers’ information rents can be dissipated by leaking to too
many traders, then we should see these brokers selectively disclosing order flow
information in an effort to maximize their rents. In particular, we should see aware
brokers favoring their best clients.
We construct two proxies for the strength of the manager-broker relationship, that is,
best client proxies, based on both the volume and the commissions generated by
manager m with broker b over a window of six months ending one month before the
fire-sale event. The first variable is defined as the volume generated by the client as a
fraction of the total volume intermediated by the broker, expressed in decimal units.
The second measure is computed similarly, but we replace the dollar volume by the
dollar trading commissions generated by the manager. Summary statistics reported in
Panel D of Table I show that these variables are highly persistent, with an
autocorrelation of 90% at the monthly frequency. This finding suggests that brokers
are incentivized to nurture these relationships over time and that heterogeneity across
clients of the a given broker is a relevant source of variation for identifying the effect
of interest.
To provide evidence on the role of broker-client relationships in information
diffusion, we estimate
849 :34;29<(=
+,5,6,*,7= ?
@C4D9 E)<4=9
+,6,*× G<HI<;29<(= :43<(;
*,7+
?
JC4D9 E)<4=9
+,6,*+ ?
KG<HI<;29<(= :43<(;
*,7+ B
+,5,6,*,7,
(3)
where j indexes stocks, b brokers, e events, m managers, and t days, as above. In
equation (3) our dependent variable of interest is the difference between the
probability of predation and the probability of liquidity provision. As in Table II, we
also use a version of this variable that is multiplied by the volume of trade. The
dummy Liquidation period indicates the first five days of a fire sale, that is, the period
of the most intense liquidation activity by a distressed fund. The reference period is
the time before the beginning of the fire sale. All specifications include time (at the
monthly frequency), manager, event, stock, and broker fixed effects. We
conservatively double-cluster standard errors at the stock and the manager level,
which allows for arbitrary correlation within trades in the same stock by the same
manager.
14Table III presents the results. We find that asset managers exhibiting a closer
relationship with a fire-sale-aware broker are significantly more likely to sell their
holdings of the fire-sale stock with the same broker during the liquidation period. This
result is economically significant, with the net probability of predation for the best
14 In robustness tests reported in Panel B of Table IA.VI, we cluster standard errors along alternative multiple dimensions:
clients of aware brokers (top decile) more than double that of small clients of aware
brokers (bottom decile).
15We next employ a more stringent identification strategy that exploits variation across
both managers and brokers. More specifically, we compare the difference between the
behavior of the best clients of the aware brokers and the behavior of the best clients
of the unaware brokers, relative to the behavior of the non-best clients of both types
of brokers. Formally, we run the following regression:
849 :34;29<(=+,5,6,*,7= ?@C4D9 E)<4=9+,* × 012345,6,7 × G<HI<;29<(=:43<(;*,7 + ?JC4D9 E)<4=9+,* × 012345,6,7
+ ?KC4D9 E)<4=9+,* × G<HI<;29<(= :43<(;*,7&
+ ?M012345,6,7 × G<HI<;29<(= :43<(;*
+ ?NC4D9 E)<4=9+,*+ ?OG<HI<;29<(= :43<(;*,7+ ?P012345,6,7+ B+,5,6,*,7
(4)
In this specification, we define
01234
5,6,7at the event-broker-stock level by
collapsing awareness on the time dimension,
that is,
for each broker b that eventually
becomes aware of the fire-sale event e on a stock j, we assign 01234
5,6,7= 1. Table
III, Panel B reports the results based on both best client proxies. We continue to find
that clients with stronger ties to the aware brokers are significantly more likely to sell
the stock involved in the liquidation than the best clients of the other brokers involved
in the liquidation.
A question that arises at this point is whether there is significant persistence in the set
of asset managers that predate and in the set that get predated. We find that more than
60% of predation victims were predated upon only once, that is, the median is one,
while on average predation victims are predated upon 3.13 times. These results
suggest that the liquidations we are focusing on are unlikely to happen frequently
enough for the affected funds to become aware of such and potentially punish the
broker. In fact, even among those funds that are predated upon more than two times,
15 This conclusion is based on the estimates from the regressions without fixed effects in Table IA.X, Panel B. In particular,
the average time between two consecutive events is 2.86 years. It would thus be
difficult for a manager to learn about a brokers’ leakage, given that, from the
perspective of a manager, predation happens rarely and inference is noisy.
16We further find that across all of the predators in our sample, 30% predate on more
than 10 events during our sample period. Thus, predatory behavior is persistent:
conditional on having predated at time t, the manager is twice as likely to predate
again in t+1. Figure IA.3 in the Internet Appendix shows that this result holds for
different time horizons. The evidence therefore suggests that, consistent with our
hypothesis, brokers leak their information to hose clients that are most likely to take
advantage of this information and generate rents for the broker.
An additional dimension that we explore is when predators start trading in the same
direction. Intuitively, if predation starts on the first day of liquidation, it is potentially
much more harmful than if it starts on the last day of the liquidation. We address this
question in Internet Appendix Table IA.XII. We find that the best clients of aware
brokers begin predating significantly earlier than other predators. In particular, the
average predator starts predating on the third day of the liquidation, while the best
clients of aware brokers start on the second day, on average. This result suggests that
the best clients of aware brokers are rewarded through early access to information.
We also test whether brokers show their best clients preferential treatment when these
clients need to liquidate. In Table IA.X, we find that predation is less likely when the
fund in distress is one of the broker’s best clients. We do not find evidence of
significantly more liquidity provision, but the result holds when we look at the
difference between predatory and liquidity provision volumes. Overall, clients with
closer ties to the brokers appear to enjoy an advantage when they need to liquidate.
Finally, using reconstructed portfolios, we find that predators appear to short fire-sale
stocks in 43% of cases. We note, however, that this estimate is subject to large
measurement error due to the fact that we approximate the true portfolio. From a
theoretical perspective, we do not have a strong prior as to whether predation should
occur with stocks already in the predator’s portfolio or stocks that the predator needs
to short. Empirically, given that the stocks that are most likely to be predated tend to
be the largest and most liquid stocks in the market, it is more likely that these stocks
are already in predators’ portfolios. This could explain why a slight majority of
predatory trades consists of sales of existing positions.
173.4 Robustness to Aggregate and Stock-Specific News
Having established that the best clients of the aware brokers are more likely to sell the
same stock as the distressed fund during the liquidation period, we examine whether
this result can be explained by factors other than information leakage by the broker.
The main alternative hypothesis for this result is that asset managers are responding
to the same common shock that occurs during the same event window. This might be
the case for two reasons. First, a common disruption in the market that may lead funds
to offload their positions. Second, news about the specific stocks might be released,
that triggers funds’ trading behavior.
As discussed above, some of our prior evidence (e.g., the fact that we control for
stock´day fixed effects in Table II) already helps rule out these hypotheses.
Nonetheless, we construct several additional tests to rule out these alternative
explanations. To ensure that the correlation among traders is not due to general
disruption in the market, we first exclude the two recessions from our sample,
that is
the tech crunch of 2001 and the financial crisis of 2007 to 2009. Panel A of Table
IA.III presents the results. We find that our main results are robust to this change in
estimation sample, with both the economic and the statistical significance being
unaffected.
Next, we examine whether negative stock-specific news might explain our baseline
results. To do so, we collect information about earnings announcements and changes
in analyst recommendations. Intuitively, earning announcements might serve as a
17 In Table IA.II in the Internet Appendix we examine the characteristics of the stocks that are subject to greater predation.
We split the sample of fire-sale stocks by the median amount of predation. This quantity is the number of manager-days in which a client of an aware broker trades in the same direction as the liquidating fund. Then, for different variables, we compute the average for stocks that are liquidated in events above the median (More Predation) and below the median (Less Predation). Overall, we find that the events with stronger predatory activity involve larger, more liquid, and less volatile stocks.
catalyst, with a negative surprise triggering a series of liquidations. We therefore
exclude the 10 trading days around such announcements. Similarly, one might expect
multiple liquidations to follow a downgrade, especially if it is unexpected. We
therefore also exclude these events from our sample. Of course, earnings
announcements and analyst recommendations are not the only news events that might
trigger a coordinated response from market participants. We obtain comprehensive
information about stock-specific news from Ravenpack, which collects all types of
information about a stock, from lawsuit to mergers and acquisitions from newswires.
A machine learning algorithm is then employed to classify news as good or bad on a
scale from 0 to 100, where 50 is the cutoff below which news is identified as bad. In
Panel B of Table IA.III we show that even in the restricted sample excluding bad
news, the best clients of aware brokers are more likely to predate on liquidating
managers.
Fund managers might also find themselves trading in the same direction when the
stocks belong to a strategy,
for example
momentum, that is adopted by multiple funds.
Furthermore, asset managers might be liquidating underperforming stocks. Thus, as
an additional robustness check, in Panel C of Table IA.III we exclude from the sample
all stocks exhibiting negative momentum. Specifically, we compute the returns of the
stocks sold during a fire sale and exclude those with negative returns in the week
preceding the fire sale. The results are unaffected.
To check whether our results could be driven by changes in investors’ expectations
about the stocks, in Panel D of Table IA.III we also consider short-selling data from
Markit (formerly DataEx). Intuitively, stocks with high short interest might be subject
to correlated sales across funds, which could be triggered by company-specific events
or investors’ common beliefs about stock performance rather than by a desire to take
advantage of a liquidating fund. We find that our results are robust to excluding events
for which the liquidated stocks exhibit a significant level of short interest, defined as
the utilization ratio (i.e., shares on loan divided by shares available to lend) of the top
quartile.
As an additional test to rule out the alternative hypothesis that funds are responding
to similar shocks rather than deliberately taking advantage of a fire sale, we examine
the number of stocks affected by the predatory behavior of aware brokers’ clients. The
idea is that if investors are simply responding to a common shock to a stock, their
sales should be concentrated on that stock, whereas if multiple stocks out of those that
are involved in a fire sale are sold by the best clients of aware brokers, predation on
the liquidating fund is more likely.
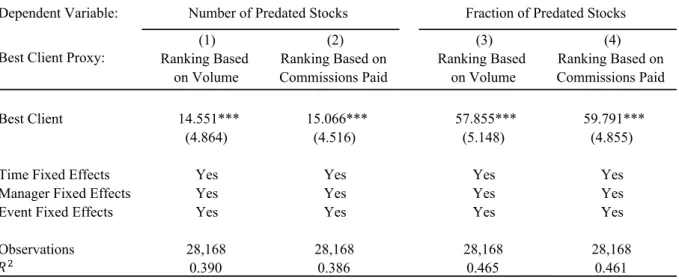
To test this conjecture, Table IV reports results where the outcome variable in
columns (1) and (2) is the number of fire-sale stocks that the manager sells and in
columns (3) and (4) the fraction of fire-sale stocks in which we observe predatory
behavior. We find that the top-decile clients of aware brokers tend to sell around eight
more stocks than bottom-decile clients do (column (1)) and to predate about 33% more
of the stocks involved in the fire sale (column (3)).
18These results are consistent with
aware brokers selectively leaking information to their best clients.
3.5 Evidence of Trade Reversion
To further support the view that our results are driven by predatory behavior by asset
managers who acquire order flow information from an aware broker, we examine
whether these same asset managers are also likely to cover their positions by
repurchasing the stock in the following days.
To do so, we compute the fraction of a manager’s negative position that is
subsequently reversed. Specifically, we define the percentage of manager m’s position
in stock j that is reversed during event e as R4S
7,+,5= C(ITℎ9C2VW
7,+,5/ Y();
7,+,5,
where Y();
7,+,5is the dollar sum of all sell orders in the period and
C(ITℎ9C2VW
7,+,5is the dollar sum of buy orders during the period, where we sum only over the buy
orders that are preceded by negative cumulative order flow to avoid counting as
reversals those buy orders that occur before sales have taken place. We compute this
measure around the 10 days before and after each fire-sale event. We then compare
18 The bottom decile of the best client proxy based on volume is 0, while that for the top decile is 0.58 (median point between
the 90th percentile and the max of the distribution). Hence, we obtain an increase of 14.5 × 0.58 = 8.4 stocks, while the
the fraction of the position that is reversed across clients of aware brokers before and
after fire-sale events. The liquidating funds are excluded from the sample.
Table V reports the results. We find that a significant fraction of predating managers’
positions is covered in the 10 days following the fire sale. We interpret this result as
strong evidence that predating managers are motivated by the prospect of short-term
gains at the expense of the liquidating fund.
193.6 Late-Trading Scandal as a Natural Experiment
Yet another possible explanation for our results is that the intermediating broker is the
original source of the information about the liquidated stocks, that is, the broker
triggers both the large sale as well as smaller sales by other managers in the same
direction.
To rule out this possibility, we need to identify an exogenous determinant of fire sales.
In particular, we need to identify a determinant of liquidations that is
manager-specific, that is not induced by the broker, and that does not depend on the identity of
the liquidated stocks or the composition of the manager’s portfolio.
Anton and Polk (2014) use the liquidations triggered by outflows following the
late-trading scandal as a natural experiment to identify exogenous selling activity (see also
Kisin (2011)). Following these authors, we exploit the mutual fund scandal that
erupted in September 2003. At the time, New York Attorney General Eliot Spitzer
announced the discovery of illegal late-trading activities and market-timing practices
on the part of several hedge fund and mutual fund companies. The scandal had a
significant impact on the 27 fund families involved: they experienced significant
19 To give a sense of the magnitude of the trade reversal, we compare this unwinding activity to the reversal of sell trades
by the same predatory managers over a random sample of five-day intervals that do not include a fire sale (placebo sample). Figure IA.4 in the Internet Appendix compares the unwinding of predators’ trades after the fire sale to trades on placebo days, where predators are managers trading in the same direction as the fire sale and placebo days are days in which no fire sale takes place. It is evident that reversals are significantly higher after the fire sales. In particular, only one day after a fire sale, 30% of sell positions are bought back, while this number is closer to 3% in the placebo sample. After one month the reversal plateaus at about 50% of the positions, while it is below 25% in the placebo sample. We conclude that the evidence of trade reversal after fire sales is economically significant. The fact that not all sell trades are reversed suggests that either some investors already intended to sell the stock and took advantage of the price decline to do so, or some investors mistook the price drop for a negative signal on the stock and decided to drop it from their portfolio.
outflows, losing 14.1% of their capital within one year and 24.3% within two years
(Kisin, (2011)). This setting is ideal for our purposes because it allows us to identify
stocks subject to selling pressure for exogenous reasons. Although market participants
were aware that these fund families were experiencing investor outflows, brokers’
unique vantage point allowed them to pin down when these funds were liquidating
and which stocks were involved in the liquidation. Both pieces of information which
are not publicly available, are crucial to making predation profitable.
To test whether our main result, namely, that brokers leak information about stocks
that are liquidating and the timing of these liquidations, extends to this setting, we
manually match the identity of the fund families included in Spitzer’s complaint with
our trade-level data to identify the sell trades of these fund families and the brokers
through which they executed them.
20Corroborating the validity of our matching
procedure, we find that the matched managers rank in the top quartile by sales in the
two-year period following the scandal.
Next, we focus on the daily transactions of the managers not involved in the scandal
for the four-years period centered on the month of the announcement of Spitzer’s
complaint (September 2003) and construct the dummy :(D9 YV2=;2)
*, which
indicates the two years after the complaint broke out. We then define the
broker-stock-day-level dummy variable
Y4))<=T
6,5,*which indicates whether at least one of the
charged funds sold stock j on day t through broker b. The dependent variable,
Probability of Predation, is a dummy variable that equals to one if a non-charged
manager sold stock j on day t through broker b, and to zero if a non-charged manager
traded on a different day, on a different stock, or with a different broker. In a
difference-in-differences setting, we regress Probability of Predation on the
interaction between Y4))<=T
6,5,*and the :(D9 YV2=;2)
*dummy.
20 A complete list of the fund families involved in the scandal arising from Spitzer’s complaint can be found at
https://en.wikipedia.org/wiki/2003_mutual_fund_scandal#List_of_implicated_fund_companies.5B4.5D.5B5.5D. Out of the 27 families that were involved, we are able to find a match in our data set for 19 of them. These 19 managers were responsible for seven of the 31 fire-sale events in the two-year period after the scandal broke out, that is, the late-trading scandal families generated 23% of the fire sales. Importantly, the implicated funds represent only about 2.1% of the managers in the database (i.e., 19/900). Hence, the implicated families weigh about 10 times more heavily than the other managers in generating fire sales in those two years.