HAL Id: hal-00304249
https://hal.archives-ouvertes.fr/hal-00304249
Submitted on 10 Jun 2008HAL is a multi-disciplinary open access
archive for the deposit and dissemination of sci-entific research documents, whether they are pub-lished or not. The documents may come from teaching and research institutions in France or abroad, or from public or private research centers.
L’archive ouverte pluridisciplinaire HAL, est destinée au dépôt et à la diffusion de documents scientifiques de niveau recherche, publiés ou non, émanant des établissements d’enseignement et de recherche français ou étrangers, des laboratoires publics ou privés.
Relationships between submicrometer particulate air
pollution and air mass history in Beijing, China,
2004?2006
B. Wehner, W. Birmili, F. Ditas, Z. Wu, M. Hu, X. Liu, J. Mao, N. Sugimoto,
A. Wiedensohler
To cite this version:
B. Wehner, W. Birmili, F. Ditas, Z. Wu, M. Hu, et al.. Relationships between submicrometer par-ticulate air pollution and air mass history in Beijing, China, 2004?2006. Atmospheric Chemistry and Physics Discussions, European Geosciences Union, 2008, 8 (3), pp.11321-11362. �hal-00304249�
ACPD
8, 11321–11362, 2008
Aerosol pollution and air mass history in
Beijing, China Wehner et al. Title Page Abstract Introduction Conclusions References Tables Figures ◭ ◮ ◭ ◮ Back Close Full Screen / Esc
Printer-friendly Version Interactive Discussion Atmos. Chem. Phys. Discuss., 8, 11321–11362, 2008
www.atmos-chem-phys-discuss.net/8/11321/2008/ © Author(s) 2008. This work is distributed under the Creative Commons Attribution 3.0 License.
Atmospheric Chemistry and Physics Discussions
Relationships between submicrometer
particulate air pollution and air mass
history in Beijing, China, 2004–2006
B. Wehner1, W. Birmili1, F. Ditas1, Z. Wu2, M. Hu2, X. Liu3, J. Mao3, N. Sugimoto4, and A. Wiedensohler1
1
Leibniz-Institute for Tropospheric Research, 04318 Leipzig, Germany
2
State Key Joint Laboratory of Environmental Simulation and Pollution Control, College of Environmental Sciences and Engineering, Peking University, Beijing 100871, P. R. China
3
Department of Atmospheric Sciences, College of Physics, Peking University, Beijing 100871, P. R. China
4
Atmospheric Environment Division, National Institute for Environmental Studies, Tsukuba, Japan
Received: 11 April 2008 – Accepted: 7 May 2008 – Published: 10 June 2008 Correspondence to: B. Wehner ([email protected])
ACPD
8, 11321–11362, 2008
Aerosol pollution and air mass history in
Beijing, China Wehner et al. Title Page Abstract Introduction Conclusions References Tables Figures ◭ ◮ ◭ ◮ Back Close Full Screen / Esc
Printer-friendly Version Interactive Discussion
Abstract
The Chinese capital Beijing is one of the global megacities where the effects of rapid economic growth have led to complex air pollution problems that are not well under-stood. In this study, ambient particle number size distributions in Beijing between 2004 and 2006 are analysed as a function of regional meteorological transport. An
essen-5
tial result is that the particle size distribution in Beijing depends to large extent on the history of the synoptic scale air masses. A first approach based on manual back tra-jectory classification yielded differences in particulate matter mass concentration (PM1
and PM10) by a factor of two between four different air mass categories, including three main wind directions plus the case of stagnant air masses. A back trajectory cluster
10
analysis refined these results, yielding a total of six trajectory clusters. Besides the large scale wind direction, the transportation speed of an air mass was found to play an essential role on the PM concentrations in Beijing. Slow-moving air masses were shown to be associated with an effective accumulation of surface-based anthropogenic emissions due to both, an increased residence time over densely populated land, and
15
their higher degree of vertical stability. For the six back trajectory clusters, differences in PM1mass concentrations by a factor of 3.5, in the mean air mass speed by a factor of 6, and in atmospheric visibility by a factor of 4 were found. The main conclusion is that the air quality in Beijing is not only degraded by anthropogenic aerosol sources from within the megacity, but also by sources across the entire Northwest China plain
20
depending on the meteorological situation.
1 Introduction
Beijing with approximately 17 million inhabitants is one of the megacities in the world that are challenged by the imperative necessity of air quality management. Along with the rapid economic growth and increase in motor traffic during the last decade, the
25
ACPD
8, 11321–11362, 2008
Aerosol pollution and air mass history in
Beijing, China Wehner et al. Title Page Abstract Introduction Conclusions References Tables Figures ◭ ◮ ◭ ◮ Back Close Full Screen / Esc
Printer-friendly Version Interactive Discussion pollution to a complex mixture of domestic, industrial and traffic emissions combined
with the secondary gas and aerosol formation processes in the regional atmosphere. The number of motor vehicles has increased dramatically in Beijing and reached over 3 million in 2007. While the consumption of fossil-fuel energy in China is expected to increase by 50% until 2020 compared to 1995 (Streets et al.,2001), dust storm events
5
in spring time and re-suspended dust from traffic and construction activities further enhance the complexity especially of particulate air pollution in Beijing. A particular feature of town development in China is that groups of cities grow in parallel and build so-called city clusters. There are four of them these days covering less than 3% of Chi-nas territory but 12% of the total population and producing 47% of the gross domestic
10
product, GDP (Shao et al.,2006). Beijing belongs to one of these four city clusters making the air pollution situation in combination with its orographic location more deli-cate and not comparable to other mega cities worldwide (Lawrence et al.,2007). The ongoing economic growth and increasing number of inhabitants and cars without sig-nificant reductions in emission rates has lead to an increase in air pollution in the whole
15
area, and will most likely further aggravate this situation in the near future. Morever, the air pollution in Beijing is likely to be affected by emissions from the surrounding areas as well (Guinot et al.,2007).
The problem of particulate air pollution has become more and more serious during the last decades in terms of visibility degradation as well as an increase in
particle-20
related adverse health symptoms. Beside these local effects, also changes in the regional climate became obvious, such as the decrease of light rain events (Qian et al.,
2007b) and a decrease in sunshine duration in China (Kaiser and Qian,2002). These highly visible observations combined with the fact that Beijing is hosting the Olympic Games 2008 have increased political pressure on the local and state governments to
25
improve the air quality in the very near future. To achieve this, a more comprehensive knowledge of the formation, transformation, and transportation of aerosol particles is required.
ACPD
8, 11321–11362, 2008
Aerosol pollution and air mass history in
Beijing, China Wehner et al. Title Page Abstract Introduction Conclusions References Tables Figures ◭ ◮ ◭ ◮ Back Close Full Screen / Esc
Printer-friendly Version Interactive Discussion importance for public health, for instance in relation to mortality, and respiratory and
cardiovascular diseases. The relationship between particulate air pollution and daily mortality has now been studied for many regions in the world (e.g., Kettunen et al.,
2007;Dominici et al., 2005;Analitis et al.,2006). In addition to the mortality studies an increase in hospital admissions and emergency room visits for cardiovascular and
5
respiratory diseases has been recorded at elevated ambient particle concentrations (e.g.,Dominici et al.,2006;Kan et al.,2007). Most of the former studies were based on the measurement of particle mass concentration, i.e. TSP, PM10, or PM2.5. During the last decade more studies have targeted PM2.5 (e.g., Schwartz and Naes, 2000;
Franklin et al.,2006;Ostro et al.,2006). Based on epidemiologic evidence and results
10
from animal studies on the potential toxicity of ultra-fine particles, recent epidemiologic studies focus on the health effects of particles which are less than 100 nm in diameter (e.g., Peters et al., 2001, 2007; Ruckerl et al., 2007). The number concentration of these small particles exceeds usually that of larger ones in the urban area, but their contribution to the total mass concentration is relatively low.
15
Considering number size distributions for epidemiological studies, clearer effects were observed with smaller particle sizes (e.g., Ruckerl et al., 2007; St ¨olzel et al.,
2007;Yue et al.,2007). Until recently, the majority of ambient aerosol measurements in China was limited to aerosol mass concentration and chemical composition (e.g.,
Wang et al.,2006;Zheng et al.,2005;Huang et al.,2005). Consequently,
epidemio-20
logical studies have described the effects of mass-related aerosol properties on human health.Qian et al.(2007a) found a consistent evidence of acute effects of PM10on
car-diopulmonary mortality during a four-year study in Wuhan.Kan et al.(2007) found that PM2.5was associated with death rates from all causes and from cardiorespiratory dis-eases but not PM10−2.5in Shanghai. Wong et al.(2002) found a connection between
25
mortality and different pollutants such as PM10in Hongkong. Particulate air pollution is
estimated to be responsible for about one million premature deaths per year in China (Florig et al.,2002). Zhang et al.(2007) pointed out that economic costs to health are up to 6.5% of Beijing GDP each year.
ACPD
8, 11321–11362, 2008
Aerosol pollution and air mass history in
Beijing, China Wehner et al. Title Page Abstract Introduction Conclusions References Tables Figures ◭ ◮ ◭ ◮ Back Close Full Screen / Esc
Printer-friendly Version Interactive Discussion Measurements of ambient particle number size distributions down to a few
nanome-ters and aerosol chemical composition would be desirable to help elucidate the health effects of aerosol particles in highly polluted regions like China. Due to statistical rea-sons as well as the prevalence of long-term effects, such environmental measurements would also be required to be performed over a long period. A number of studies
in-5
vestigating the chemical composition of PM10 or PM2.5 aerosols in Beijing has been performed during the last years (e.g.,Wang et al.,2005a;Han et al.,2007;Zheng et
al.,2005) but also optical parameters have been measured (e.g., Guinot et al.,2006;
Wang et al.,2005b;Xia et al.,2007). The first number-based environmental particle measurements in China were performed with poor size resolution and limited to
di-10
ameters >100 nm (Li et al., 2002; Zhong et al.,2003). These authors found general relationships between aerosol number concentration and local meteorology as well as great changes in the characteristics of air pollution in Beijing during the last two decades. Number size distributions down to 6 nm have been measured by Yu et al.
(2005) for one week in summer and two weeks in winter. The analysis of long term
15
number size distribution measurements in the urban area of Beijing, which are useful to analyze trends, give hints about major sources, and to be connected with epidemi-ological studies have been still missing until 2004. So far, such studies have been performed using models (An et al.,2007) or optical data (Xia et al.,2007).
A joint research measuring site was established by the Leibniz-Institute of
Tropos-20
pheric Research and the Peking University (College of Environmental Sciences and Engineering) in March 2004 to improve the knowledge on the origin of air pollution in the Beijing region. A suite of aerosol measurements was implemented in order to monitor particle number size distributions in the size range 0.003–10 µm continuously. Former studies utilising data from these measurements have been published (Wehner 25
et al.,2004;Wu et al.,2007). This paper evaluates the size distribution measurements in Beijing over two years, with particular emphasis directed towards the variability in particulate number and volume, their relationship with local sources, air mass history, and further meteorological factors. A major goal is to understand the circumstances
ACPD
8, 11321–11362, 2008
Aerosol pollution and air mass history in
Beijing, China Wehner et al. Title Page Abstract Introduction Conclusions References Tables Figures ◭ ◮ ◭ ◮ Back Close Full Screen / Esc
Printer-friendly Version Interactive Discussion causing long-lasting pollution episodes in Beijing and to separate local and regional
pollution sources.
2 Experimental
2.1 Measurements site at the Peking University
Atmospheric measurements were performed on the campus of the Peking University
5
located in the northwest of Beijing, close to the fourth ring road. The sampling site is located on top of a 6-floor building, 20 m above ground. The location is at least 500 m away from major roads. The campus is a primarily residential and commercial area without industrial sources or agricultural activity. Local emission sources within a radius of 1 km could be vehicular traffic, fuel combustion for domestic cooking and
10
heating, and construction. An earlier examination of the spatial variability of PM2.5 mass and chemical composition in 1999–2002 showed only minor differences between the campus site and a downtown site. Consequently, the Peking University campus site is assumed as representative for the Beijing environment.
2.2 Number size distributions
15
Aerosol number size distributions are continuously measured between 3 nm and 10 µm since beginning of March 2004. A TDMPS (Twin Differential Mobility Particle Sizer,
Birmili et al.,1999) system consisting of two Hauke-type DMAs and two CPCs (model 3010 and model 3025, TSI Inc., St. Paul, MN, USA) is used to measure the size dis-tribution from 3 to 800 nm (mobility diameter, Dp). Additionally, an APS (Aerodynamic
20
Particle Sizer, model 3321, TSI Inc., St. Paul, MN, USA) measures number size dis-tributions between 800 nm and 10 µm (aerodynamic diameter). Size disdis-tributions are taken every 10 min. The data were corrected for losses due to diffusion and sedimenta-tion within the inlet line. To combine both measurements, the APS results were trans-formed from aerodynamic to Stokes diameters using a particle density of 1.7 g cm−3
ACPD
8, 11321–11362, 2008
Aerosol pollution and air mass history in
Beijing, China Wehner et al. Title Page Abstract Introduction Conclusions References Tables Figures ◭ ◮ ◭ ◮ Back Close Full Screen / Esc
Printer-friendly Version Interactive Discussion for the particles larger than 800 nm as a mean density for the coarse mode. A low
flow PM10 inlet is used to minimize contamination by large dust particles. The ambi-ent aerosol is dried in a diffusion drier before ambi-entering the air conditioned laboratory to avoid condensation of water in the inlet systems during warm and humid days in summer time. The number size distributions were used to calculate the total number
5
concentration, the submicrometer volume concentration from 3 nm to 1 µm and the to-tal volume concentration from 3 nm to 10 µm assuming spherical particles. Assuming a mean particle density of 1.5 g cm−3the particle mass concentration <800 nm
(corre-sponds approximately to 1 µm aerodynamic diameter, therefore later called PM1) and
<10 µm (PM10) was calculated. The assumption of this density is based on previous
10
measurements of chemical particle composition at Beijing. While the coarse mode is dominated by sulfate and crustal material, the submicrometer particles consist mainly of sulfate, organic and elemental carbon, therefore the densities for submicrometer and supermicrometer particles are assumed to be different. In Beijing, PM10 was found to
be dominated by particles < 800 nm, therefore the lower density was used also for the
15
total mass.
2.3 Meteorological measurements and back trajectories
Air temperature (T ), wind speed (ws), and wind direction (wd ) were measured at a me-teorological station on the University campus 200 m distant from the aerosol sampling site. A visibility sensor (model FD12, Vaisala, Helsinki, Finland) was operated at the
20
same site. Data from a two-wavelength backscattering lidar (1064 nm and 532 nm from a Nd-YAG laser) operated by the National Institute for Environmental Studies in Japan have been used to obtain planetary boundary layer (PBL) heights (Sugimoto et al.,
2003). Since aerosol concentrations are usually high within the PBL and low above, the PBL height can be determined from the falling edge of the range-corrected lidar
25
backscattering intensity. The PBL height is defined here as the height where the nor-malized gradient of the range-corrected lidar backscattering intensity at 1064 nm has its minimum. The Lidar instrument was located at the Sino-Japan Friendship Center
ACPD
8, 11321–11362, 2008
Aerosol pollution and air mass history in
Beijing, China Wehner et al. Title Page Abstract Introduction Conclusions References Tables Figures ◭ ◮ ◭ ◮ Back Close Full Screen / Esc
Printer-friendly Version Interactive Discussion for Environmental Protection in Beijing, around 10 km east of Peking University.
Regional atmospheric aerosol properties are related to the history of their meteo-rological air masses. Back trajectories are therefore a useful tool to follow the history of an air mass and to get a better insight into relevant processes and modifications on its way. The back trajectories for Beijing were calculated using the NOAA “On-line
5
Transport and Dispersion Model” (Draxler and Rolph, 2003). The trajectories termi-nated on a height of 200 m above ground level. From these data, mean lengths of the back trajectories were computed for periods of 1–3 days representing the mean trans-portation speed along the trajectory. The longer the trajectory, the higher is the mean transportation speed, because the air mass passed a longer distance within one day.
10
3 Results
3.1 General overview
The results shown here generally encompass the Beijing particle size distribution data between March 2004 and March 2006. Before allocating sections of data to specific air masses, daily mean values were calculated for the particle number concentration
15
N, particle volume concentration V , particle mass concentration PM, wind speed, and wind direction. Only days with data coverage of at least 22 h were considered, rep-resenting a total of 524 days with available TDMPS and APS measurements. The TDMPS-only data set, which was used to PM1amounts to a total of 575 days. Exclud-ing the days with desert dust influencExclud-ing the BeijExclud-ing air, the supermicrometer aerosol
20
fraction is dominated by anthropogenic emissions and locally re-suspended dust sim-ilar to the fraction below 800 nm. The submicrometer and supermicrometer aerosol show a linear relationship with a correlation factor of 0.98. In the following analysis, we will focus on the particle fraction below 800 nm, because of the larger data availability.
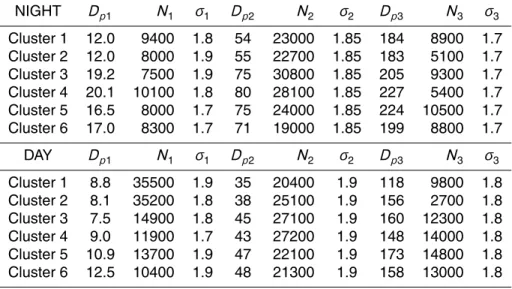
Figure1shows time series of daily averages of number and volume concentrations
25
maxi-ACPD
8, 11321–11362, 2008
Aerosol pollution and air mass history in
Beijing, China Wehner et al. Title Page Abstract Introduction Conclusions References Tables Figures ◭ ◮ ◭ ◮ Back Close Full Screen / Esc
Printer-friendly Version Interactive Discussion mum in winter time in both number and volume is recognizable, while the number
con-centration shows a second maximum during spring 2004. The volume concon-centration shows a higher variation during winter time. The maximum in number concentration is mainly caused by a high frequency of new particle formation events, which occurs usually in spring, but occasionally also in winter time (Wu et al.,2007). The maximum
5
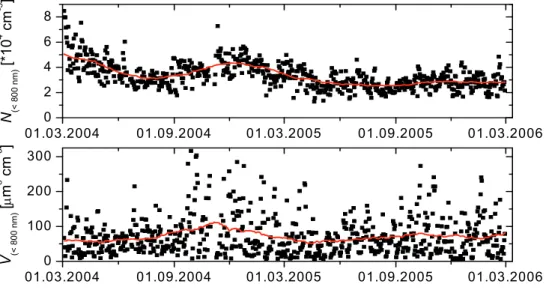
in volume concentration is due to higher primary emissions in winter time, mainly be-cause of domestic and industrial heating and a lower height of the mixing layer. The delineation between particle number and mass is more obvious when different particle number segments of the number size distributions are considered. Figure 2 shows scatter plots of particle number concentrations within selected size intervals versus the
10
total particle volume concentration (Dp<800 nm) based on daily averages. Quite ex-pectedly, the number of larger particles (Dp>100 nm) correlates well with total particle volume (Fig.2) because total particle volume is dominated by particles in the accumu-lation mode. Conversely, an anti-correaccumu-lation was found for the particle size intervals
<30 nm. The current explanation of this anti-correlation is that high concentration of
15
larger particles (and therefore particle mass) cause smaller particles to coagulate more frequently and thus reduce their concentration. A brief statistical analysis of the Bei-jing measurements yielded averaged number, surface, and volume concentration are 33 000 cm−3, 1400 µm2cm−3, and 90 µm3cm−3. The number concentration was found
to be highest in spring, while the volume concentration has its maximum during fall.
20
Average number concentrations in urban areas in Europe or North America were 21 000 cm−3 (Atlanta, USA Woo et al.,2001), 22 000 cm−3 (Pittsburgh, USA,Stanier
et al.,2004), 21 000 cm−3 (Leipzig, Germany, Wehner and Wiedensohler,2003), and
26 000 cm−3 (Helsinki, Finland,Ruuskanen et al.,2001) being 60–80% of the Beijing
value. However, the number concentration may also vary significantly within one city
25
(Tuch et al.,2003) and depend strongly on the instrumental lower size cut; therefore, variations are not unexpected. The volume concentration can be transferred to a mass concentration assuming a mean particle density. Taking 1.5 g cm−3 as a lower
esti-mate we obtain a PM10 mass concentration of 135 µg m−3. PM
ACPD
8, 11321–11362, 2008
Aerosol pollution and air mass history in
Beijing, China Wehner et al. Title Page Abstract Introduction Conclusions References Tables Figures ◭ ◮ ◭ ◮ Back Close Full Screen / Esc
Printer-friendly Version Interactive Discussion European cities have been reported in van Dingenen et al. (2004) with most of the
urban and kerbside values were between 40 and 50 µg m−3. The highest European
value was found at kerbside in Vienna with 55 µg m−3. The comparison highlights that
particulate mass concentrations in Beijing are currently about a factor of 3 higher than corresponding levels in Europe.
5
3.2 Air mass classification
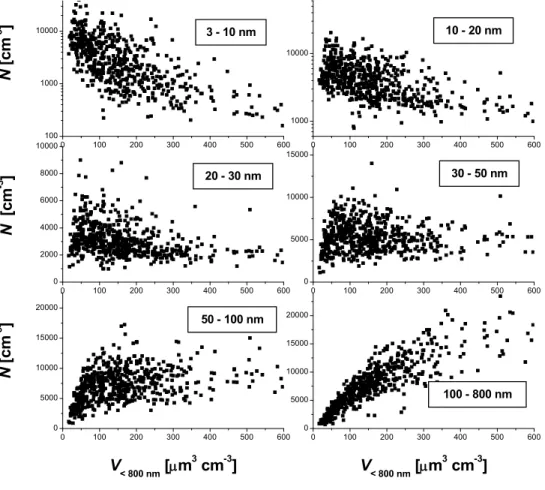
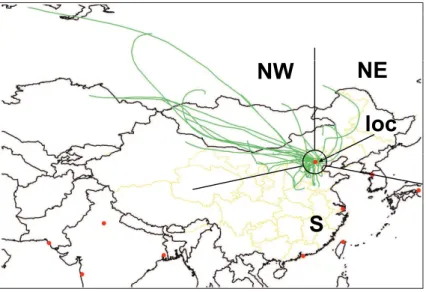
For the following analysis, measurement days have been classified according to the direction of their 72-hour-back trajectories. Four major sectors have been defined: the local one (loc) covering the city area of Beijing, and three others of the surrounding regions: Northwest (NW), Northeast (NE), and South (S), see also Figure3. However,
10
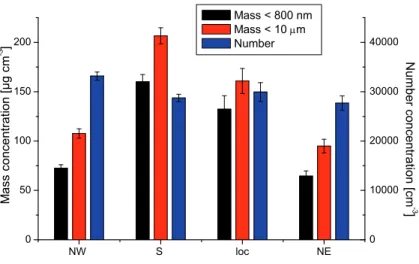
for some cases the connection between air mass and one of the sectors was not clear, i.e. the air mass spent equal time periods in two of the selected sectors during the past three days. Always, the more dominating part of the trajectory has been used to classify the day. Figure4shows mean daily mass concentrations <800 nm (PM1) and
<10 µm (PM10) as well as number concentrations calculated for each individual day
15
belonging to the main categories of back trajectories according to Fig. 3. Obviously PM10 and PM1 show a strong dependence on the air mass history: the highest PM10 value of 206 µg m−3 was found for air masses coming from the South, the lowest one
of 94 µg m−3 for air masses from the Northeast. The highest concentration in PM 1
mass was also found for air masses arriving from the South (160 µg m−3), the lowest 20
one again for Northeast (64 µg m−3). The mean values of total number concentration
are between 28 000 and 33 000 cm−3, while the maximum occurs for air masses from
the Northwest. The main differences between the air mass types become thus obvious in the mass concentration as a measure for the pollution level. PM1 and PM10 cover different numbers of measurement days because of various interruptions in APS
mea-25
surements. However, there is no significant difference in the ratio between PM1 and
ACPD
8, 11321–11362, 2008
Aerosol pollution and air mass history in
Beijing, China Wehner et al. Title Page Abstract Introduction Conclusions References Tables Figures ◭ ◮ ◭ ◮ Back Close Full Screen / Esc
Printer-friendly Version Interactive Discussion is sufficient. Fact is that the accumulation mode contributes most to particle volume
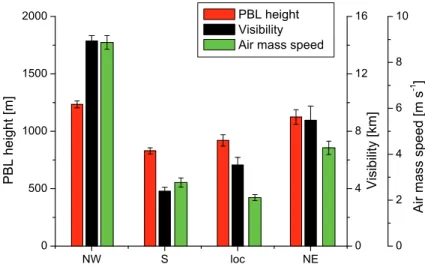
since dust storm events did not play a significant role during the observed period. Figure5shows three more parameters with significant differences for each back tra-jectory type. The mean boundary layer height during daytime has been received for most of the measurement days from the two-wavelength backscattering lidar as
de-5
scribed above. The mean boundary layer is highest for cases with air mass from the Northwest with 1230 m and lowest for those from the South with 830 m. The mean visibility is highest for the clean air coming from the Northwest (14.3 km) and lowest for those from southern directions (3.8 km). The visibility is a direct indicator for air quality in the urban area although it is depending on the relative humidity. Back trajectories
10
can be also used to calculate a mean transportation speed over the last 72 h. The mean mass speed for the four main directories is plotted in Fig. 6. The maximum mean wind speed of 8.9 m s−1 occurs again for NW and the minimum for local air masses is
2.1 m s−1
. There is a factor of 4 between them describing a significant difference in the air mass history. Those air masses arriving faster have less time to accumulate
pollu-15
tants such as primary and secondary aerosol mass. In connection with the dominating direction, the results show that clean air arrives faster from Northern directions. More polluted air masses from southern directions spent generally few days in the Beijing region. There are two main reasons for this: the main industrial and other anthro-pogenic sources for aerosols and gases are located in the regions South of Beijing.
20
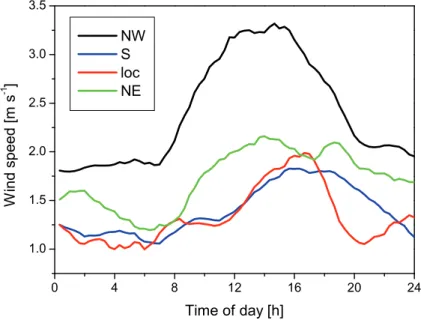
The urban area itself is a major source for traffic emissions. In addition to this fact the air masses passing the Southern regions are relatively slow, means they have much time to accumulate pollutants. The mean diurnal evolution of the local wind speed is shown in Fig.6. The trend is similar within the four groups, i.e. the wind speed is lowest during the night and highest between noon and early afternoon. The absolute values
25
show however significant differences: for air masses from the Northwest the maximum is around 3.3 m s−1, for the other three groups it is below 2 m s−1. This result indicates
completely different meteorological situations. Clean air masses from the Northwest lead to the development of a higher mixing layer with a greater local turbulent mixing,
ACPD
8, 11321–11362, 2008
Aerosol pollution and air mass history in
Beijing, China Wehner et al. Title Page Abstract Introduction Conclusions References Tables Figures ◭ ◮ ◭ ◮ Back Close Full Screen / Esc
Printer-friendly Version Interactive Discussion higher wind speeds, and subsequently to less accumulation of pollutants.
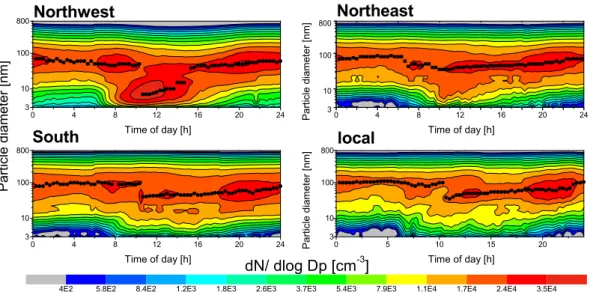
Figure7shows the mean evolution of number size distributions divided into the four types again. There are some differences in the diurnal variation recognizable: en-hanced concentrations in the ultrafine fraction are recognizable for air masses from the Northwest only. Air masses from other directions show one dominating accumulation
5
mode with a maximum around 100 nm with slightly higher values in the night and morn-ing hours. Integrated number and volume concentrations are shown in Fig.8. Here, it becomes obvious that the connection between both is very different. Particle num-ber and volume concentrations are nearly negatively correlated for air masses from the Northwest, while they seem to be well correlated for air masses from the South
10
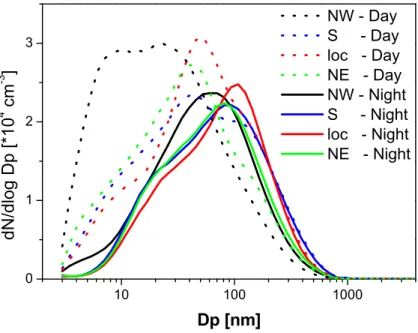
and local ones. Figure9shows mean number size distributions according to the back trajectory categories averaged over two periods for day and night time with relatively stable number size distributions. In general, the maximum number concentrations at night time are lower and shifted to larger diameters compared to those during day time. The largest difference occurs for air masses from the Northwest, because here new
15
particle formation occurs during day time producing high number particle concentra-tions in the size range below 40 nm. Obviously, there are no significant sources for ultrafine/Aitken particles in the night or the emissions do not reach the measurement site due to the stable stratification near the ground. During night time, size distributions are mainly dominated by the accumulation mode which is mainly caused by
coagula-20
tion of those particles which were emitted or formed during day time. The differences between individual air masses are less developed during nighttime, however the largest mean diameter occurs always for the local air masses and the smallest for those from the Northeast. Thus the accumulation mode represents always an indicator for the air mass origin consisting mainly of aged aerosol particles.
25
In an attempt to simplify the size distributions, trimodal lognormal functions were fit-ted to the experimental distributions shown in Fig.9. We applied a moment-preserving least squares fitting algorithm that can principally accommodate up to five lognormal modes (Birmili et al.,2001). A particular feature of the algorithm is that not only particle
ACPD
8, 11321–11362, 2008
Aerosol pollution and air mass history in
Beijing, China Wehner et al. Title Page Abstract Introduction Conclusions References Tables Figures ◭ ◮ ◭ ◮ Back Close Full Screen / Esc
Printer-friendly Version Interactive Discussion number but also higher moments such as surface area and volume are preserved
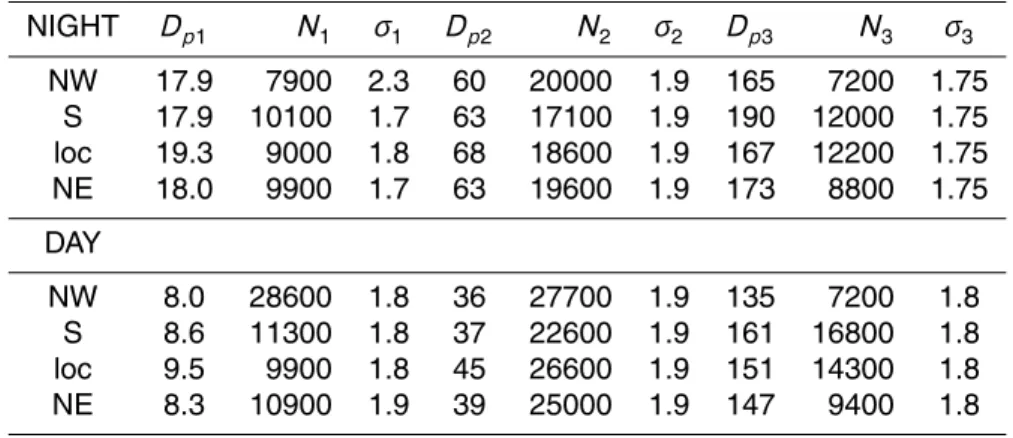
rela-tively accurately by the transformation. The results for the Beijing size distributions are shown in Table1giving geometric mean diameters Dp, particle number concentrations
N, and geometric standard deviation σ for each of the three lognormal modes (mode 1=nucleation mode, mode 2=Aitken mode, mode 3=accumulation mode). A particular
5
feature of the fit data is that the nucleation mode diameters tend to be significantly smaller during day-time as a result of photochemical secondary particle formation. 3.3 Back trajectory cluster analysis
Besides the manual air mass classification above, a back trajectory cluster analysis was applied to the size distribution data set. Importantly, the cluster analysis
consid-10
ers the three-dimensional transport features of the air mass (longitude, latitude, height above the ground, wind speed) across the length of an entire 6-day back trajectory. Here, we applied a k-means cluster algorithm (Engler et al.,2007), which was devel-oped closely following the approach first reported byDorling et al.(1992). The existing trajectory data set is divided into a pre-defined number k of clusters with the goal of
15
generating clusters that are as distinct from each other with respect to their mean val-ues, but as homogeneously as possible within each cluster. Meteorologically speaking, the cluster analysis aims at classifying and separating the weather situations governing the receptor site as distinctively as possible. A distance measure between different tra-jectories was defined that accounts for differences in geographical latitude, longitude,
20
and height above the ground. Straight radial trajectories were used as initial seed tra-jectories. For each day, one single trajectory was employed terminating in Beijing at 12:00 h local time (LT). The corresponding size distribution data were averaged over the period 10:00–18:00 h LT, which is the time when the urban measurements correspond best to the conditions in the well-mixed large-scale air mass.
25
The final number of clusters provided by the analysis needs to be determined for each data set individually and represents a compromise between an optimum sep-aration of the size distribution data set (larger number of clusters), and simplicity of
ACPD
8, 11321–11362, 2008
Aerosol pollution and air mass history in
Beijing, China Wehner et al. Title Page Abstract Introduction Conclusions References Tables Figures ◭ ◮ ◭ ◮ Back Close Full Screen / Esc
Printer-friendly Version Interactive Discussion display (lower number of clusters). Several runs of the clustering algorithm using
dif-ferent orientations with respect to the seed trajectories suggested an optimum number of 6 trajectory clusters for the Beijing site. Any lower number of clusters did not fully represent the variety of trajectories in terms of their wind speed and direction, whereas higher numbers did create superfluous information, such as clusters with mean
trajec-5
tories very close to each other. Figure10shows the mean back trajectories for the six clusters. Each of the clusters represents between 88 and 108 (out of 575) individual days. The mean back trajectories show significant differences in direction but also in length, and therefore represent the main classes of atmospheric flow conditions over north-eastern China. The two short trajectory clusters 5 and 6 arrive from southerly
10
directions, while the other four approach from the north-westerly section. Winds from southerly directions are usually connected with two main circulation patterns: Either a high pressure system south of Beijing, which leads to an inversion situation and slow winds from southerly directions, or a low pressure system over the Indian Ocean, which transports humid air over the Chinese coastal areas at low wind speeds. As the
Chi-15
nese mainland south of Beijing is generally densely populated, southerly air masses may be heavily polluted once they arrive at Beijing. Northerly and north-easterly winds, as represented by clusters 1–4, are typically connected with a dipole constellation in-volving a pressure high over central China and a pressure low over the northern Pacific. These situations lead to the advection of dry and continental air into the Beijing area.
20
Figure 11 shows the mean number size distribution for each cluster and reveals a general dichotomy in the data set: The size distributions of cluster 1 and 2 are char-acterized by a number concentration maximum around 40 nm, low concentrations in the accumulation mode, but significant numbers of particles <30 nm. All other clus-ters, in contrast, are characterized by a clear size distribution maximum around 80 nm,
25
which is indicative of significant anthropogenic influence. Hereof, clusters 3 and 4 show the highest concentrations in the accumulation mode range (>100 nm), while cluster 5 shows the highest concentration in the range above 250 nm.An et al.(2007) modelled a five day pollution episode in terms of PM2.5, PM10, and SO2, which corresponded to
ACPD
8, 11321–11362, 2008
Aerosol pollution and air mass history in
Beijing, China Wehner et al. Title Page Abstract Introduction Conclusions References Tables Figures ◭ ◮ ◭ ◮ Back Close Full Screen / Esc
Printer-friendly Version Interactive Discussion a similar weather situation represented by cluster 5. The transport model suggested
that non-Beijing pollution sources played an overwhelming role during the period. It is therefore suggestive that the high concentrations of accumulation mode aerosol in clusters 5 and 6 result from the uptake of anthropogenic pollution aerosol across the wider region south of Beijing. The clusters 1–4 arrive from north-westerly directions
5
and lead – depending on the transportation speed - to variable degrees of particulate pollution in Beijing. A main controlling factor seems to be the residence time of an air mass over the North China Plain, i.e. the populated lowlands surrounding Beijing: While the slow wind speed clusters 3 and 4 show particle size distributions very similar to the most polluted clusters 5 and 6, the high wind speed clusters show the lowest
10
accumulation mode concentration at all. It can be concluded here that fast air masses from Central Asia lead to the lowest particle mass concentrations observable in Beijing. Figure12shows contour diagrams of the diurnal variation of number size distributions, averaged for each of the trajectory clusters introduced in Fig.10. Significant differences are recognizable: Clusters 3 and 4 show their highest number concentrations around
15
a particle size of 100 nm. This maximum diameter is relatively stable during whole day with an additional small shoulder in the morning in the ultrafine range indicating few events of new particle formation. In contrast, the two clusters with fast air mass transport from the North and Northwest (clusters 1 and 2) show a clear ultrafine mode in the late morning growing into the Aitken mode at noon indicating frequent events of
20
new particle formation. The two clusters representing the very short back trajectories from the South (clusters 5 and 6) do not show any indication of new particle formation; in fact, particle formation events were observed on six days of cluster 5 and two days of cluster 6 only, all belonging to the polluted case as introduced byWu et al.(2007). The mean evolution of the total number and volume concentration is shown in Fig.13.
25
The general differences in particles characteristics are obvious again: cluster 1 and 2 show strongly negatively correlated number and volume concentration, this trend is less clear for 3 and 4 and for the two more polluted clusters 5 and especially 6 number and volume are partly correlated. This result is that in clean cases the particle number
ACPD
8, 11321–11362, 2008
Aerosol pollution and air mass history in
Beijing, China Wehner et al. Title Page Abstract Introduction Conclusions References Tables Figures ◭ ◮ ◭ ◮ Back Close Full Screen / Esc
Printer-friendly Version Interactive Discussion concentration is dominated by small particles, e.g. produced by new particle formation.
These particles are typically below 50 nm in diameter, and thus, they have a small in-fluence on volume concentration. During more polluted cases in Beijing new particle formation is suppressed and directly emitted particles >50 nm or particles grown into that size range dominate the number size distributions. These particles have a
signif-5
icant influence on the particle volume concentration. Similar to Sect. 3.2., lognormal parameters were calculated for the size distributions shown in Fig.11. The lognormal parameters are shown in Table2. It is worth to note that the back trajectory analysis provides a refined picture on the controlling factors.
Figure14displays the relationships between calculated PM1mass concentration as
10
well as meteorological and visibility parameters as a function of the six trajectory clus-ters. The highest mass concentration of 168 µg m−3 occurred in cluster 6 representing
slow air masses from the South, while the lowest concentrations (66 and 42 µg m−3)
were associated with northerly advection (clusters 1 and 2). Figure 14a illustrates the relationship between the PM1mass concentration and the height of the planetary
15
boundary layer (PBL) as determined from lidar. The average PBL height for the six clusters varied between 780 and 1070 m, with the highest values occurring in the clean northerly air masses (clusters 1 and 2). Notably, the mass concentration is negatively correlated to the PBL height, which we see as an indication of pollution trapping during situations of less intense vertical exchange. Figure14b shows mean PM1
concentra-20
tion and mean air mass speed calculated from the last day of the back trajectories before arriving at Beijing. According to the different lengths of the back trajectories, which were obvious from Fig.10, the air mass speed show significant differences too: the shortest trajectories (clusters 5 and 6) had a mean speed of 0.7 m s−1 while the
fastest one (cluster 1) had a mean transportation speed of 6.4 m s−1, i.e. there is al-25
most a factor of 10 between them. This means the slowest air mass spends at least 20 h within an area 50 km around the measurement site, while the fastest one only 2 h. Particle mass concentration shows also a negative correlation with the mean speed of the air mass, i.e. high mass concentrations are connected with low air mass speed
ACPD
8, 11321–11362, 2008
Aerosol pollution and air mass history in
Beijing, China Wehner et al. Title Page Abstract Introduction Conclusions References Tables Figures ◭ ◮ ◭ ◮ Back Close Full Screen / Esc
Printer-friendly Version Interactive Discussion and vice versa. A fast air mass can only accumulate fewer pollutants during its shorter
transit across a source area. For Beijing, this effect is emphasized by the fact that fast air masses arrive from the North, where sources are more scarce. Air masses belong-ing to shorter back trajectories (from the South) spend more time in polluted areas and are thus even more influenced by regional and local emissions and secondary aerosol
5
production. Figure 14c shows the visibility in relation to mass concentration, again they are negatively correlated. The visibility shows its maximum of 20 km for number 2 followed by number 1 with 15.6 km. The visibility was lowest for number 5 and 6 with 5.9 and 5.4 km. These findings emphasize again the characteristics of the different air masses: cleanest air, which is characterized by low mass concentrations and high
10
visibility arrives fast from Northern directions, while more polluted air showing higher PM1and low visibility is arriving slower from the South.
Figure 15 shows a more detailed version of Fig. 14a, taking into account all indi-vidual measurement days. Different colors and symbols are used to represent the corresponding clusters. This figure sharpens the impression of an anti-correlation
be-15
tween the boundary layer height (PBL) and the particle volume concentration, here representing the regional air pollution. High particulate volume (or mass) concentra-tions always correspond to poor vertical mixing condiconcentra-tions. For instance, the highest particle volume concentrations >180 µg m−3 are always associated with PBL heights
<800 m. The reverse conclusion is not true; days with low PBL heights feature both
20
high and low volume concentrations. However, mixed layer heights above 2000 m, which are predominantly associated with clusters 1 and 2, show, always low partic-ulate volume concentrations <25 µg m−3. The figure reiterates results shown above
that lower volume concentration (and high PBL heights) occurs mainly on days, which belong to cluster 1 or 2, while higher volume concentrations and low PBL heights are
25
more frequent for clusters 3–6.
Averages of meteorological data for the 6 cluster types show also significant differ-ences. The temperature is highest for clusters 5 and 6 (22.8 and 21.7◦C) representing
ACPD
8, 11321–11362, 2008
Aerosol pollution and air mass history in
Beijing, China Wehner et al. Title Page Abstract Introduction Conclusions References Tables Figures ◭ ◮ ◭ ◮ Back Close Full Screen / Esc
Printer-friendly Version Interactive Discussion 7.2 and 9.2◦C). This finding is probably caused by the origin of the air mass but also
by the time of the year when these trajectories have been observed. The polluted air masses from the South are thus more frequent in summer, while during winter time the air masses are coming more frequent from the Northwest. The measured global radia-tion shows the opposite behavior: it is lowest for 5 and 6, i.e. during high temperatures
5
and highest during low temperatures. To explain this behavior, the general pollution situation has to be considered: cluster 5 and 6 show the highest particle mass con-centration with the lowest visibility leading to a significant reduction in global radiation. The effect of visibility reduction is thus stronger than the fact that these cases occur mostly in summer, when more global radiation should reach the atmosphere. The
over-10
all result agrees well with the findings ofXia et al. (2007). They analyzed 5 years of back trajectories in connection with data of the aerosol optical depth (AOD) using the method of cluster analysis. Trajectories were also classified into 6 clusters separating fast from slowly moving air masses but in addition split by season. The main result was that the fast moving north-westerly air masses were basically associated with lower
15
AOD except in spring because of desert dust influence.
4 Conclusions
Long-term measurements since 2004 of atmospheric particle number size distribu-tions (0.003–10 µm) have confirmed the region of Beijing, China as a global hot spot of particulate air pollution. Such in-situ aerosol measurements have been, to our
20
knowledge, unique on the densely populated Southeast Asian mainland with respect to their duration and particle size range covered. For the period between 2004 and 2006 the mean concentrations of particle number, surface, and volume concentration were 32 800 cm−3, 1400 m2cm−3, and 90 µm3cm−3, respectively. The Beijing number
concentrations are only ∼30% higher than the values observed in European or North
25
American cities but the mass concentration exceeds the values at polluted sites in Eu-rope by a factor of three. This is indicative of two processes: First, the size-dependent
ACPD
8, 11321–11362, 2008
Aerosol pollution and air mass history in
Beijing, China Wehner et al. Title Page Abstract Introduction Conclusions References Tables Figures ◭ ◮ ◭ ◮ Back Close Full Screen / Esc
Printer-friendly Version Interactive Discussion profile of primary aerosol emissions might be different in current China compared to
Europe. Second, the higher surface area encountered in the Beijing atmosphere acts as a more effective coagulation sink for nucleation mode particles. Clear indications of a delineation of nucleation and accumulation mode particles were in fact found within the Beijing data set itself (see Fig.11).
5
Two different classification schemes were applied to characterize the history of the air masses arriving at Beijing. A simplistic categorization of trajectories yielded differences in mean particle mass concentration by a factor of two between southerly and northerly air masses. This result is qualitatively in agreement with an increased residence time of the air over densely populated areas along with different travelling speeds (the mean
10
wind speed in southerly air masses was by a factor of 3.5 lower than in northerly air masses). The analysis suggests that variations of aerosol parameters along with the air mass history are more significant than the seasonal, weekly or even diurnal cycles. The highest seasonal average of PM10 mass concentration was found with 149 µg m−3
in autumn, the lowest one with 115 µg m−3 in spring. An average PM
10 concentration 15
of 206 µg m−3was found for southerly air masses, but only 94 µg m−3for northeasterly
air masses from inner Asia.
The picture could be improved by a back trajectory cluster analysis, which is not only sensitive to wind direction but wind speed and vertical trajectory motion. According to this analysis the highest particle mass concentrations prevailed in slow air masses,
20
particularly those originating in the densely populated regions south of Beijing. Low particle mass concentrations, in contrast, were found in air from the high Central Asian plains. On the one hand, these plains are sparsely populated while on the other hand, air from those regions usually travels at higher speeds (∼6.5 m s−1). The transport of
air from the Central Asian plains is usually facilitated by stationary high pressure
sys-25
tems that reside over central China in winter. More polluted situations are connected with high pressure systems south of Beijing leading to an inversion with slow southern wind or the so-called monsoon transporting humid air over the coastal areas mainly during the summer months. The mean transportation speeds in the latter situations
ACPD
8, 11321–11362, 2008
Aerosol pollution and air mass history in
Beijing, China Wehner et al. Title Page Abstract Introduction Conclusions References Tables Figures ◭ ◮ ◭ ◮ Back Close Full Screen / Esc
Printer-friendly Version Interactive Discussion are typically below 1 m s−1. Different air masses and their levels of PM
1 and PM10
were also associated with different degrees of atmospheric visibility: For two trajectory clusters coming from the north, for example, the PM1mass concentration and visibility co-varied by a factor of approximately 2.
High concentrations of small particles (Dp<30 nm) were found predominantly in clean
5
northerly air masses. A likely explanation for the nucleation mode in northerly air masses is its efficient vertical dilution and therefore relatively low pre-existing particle surface area. Our impression is that in the Beijing area the formation of new particles (Dp<40 nm) from gaseous precursors is never limited by the precursor concentrations but rather the pre-existing population of larger particles that act as a coagulation sink.
10
A salient conclusion is that the levels of particle mass and number in Beijing are not always of a high level, but depend strongly on the synoptic scale meteorological situation. This finding has considerable implications for air quality regulation. Any local emission reduction measures, such as traffic reductions of temporary close-downs of industrial plants may have only negligible impact when the air mass is stagnant, or
15
when being transported from southerly directions.
Acknowledgements. The authors thank all co-workers from IfT and State Key Lab for their
help in installing and operating the instruments. This work was supported by the National Natural Science Foundation of China (204100XX) and the National Basic Research Program (2002CB211605) and the DFG (WI 14449/9-1), Germany. The data evaluation for this paper 20
was conducted within the European Integrated project on Aerosol Cloud Climate and Air Quality Interactions (EUCAARI), coordinated by the University of Helsinki, Finland.
References
An, X., Zhu, T., Wang, Z., Li, C., Wang, Y.: A modeling analysis of a heavy air pollution episode occurred in Beijing, Atmos. Chem. Phys., (7), 3103–3114, 2007. 11325,11334
25
Analitis, A., Katsouyanni, K., Dimakopoulou, K., Samoli, E., Nikoloulopoulos, A. K., Petasakis, Y., Touloumi, G., Schwartz, J., Anderson, H. R., Cambra, K., Forastiere, F., Zmirou, D., Vonk,
ACPD
8, 11321–11362, 2008
Aerosol pollution and air mass history in
Beijing, China Wehner et al. Title Page Abstract Introduction Conclusions References Tables Figures ◭ ◮ ◭ ◮ Back Close Full Screen / Esc
Printer-friendly Version Interactive Discussion
J. M., Clancy, L., Kriz, B., Bobvos, J., Pekkanen, J.: Short-term effects of ambient particles on cardiovascular and respiratory mortality, Epidemiology, 17(2), 230–233, 2006. 11324
Birmili, W., Stratmann, F., and Wiedensohler, A.: Design of a DMA-based Size Spectrometer for large particle size range and stable operation, J. Aerosol Sci., 30(4), 549–554, 1999.11326
Birmili, W., Wiedensohler, A., Heintzenberg, J., and Lehmann, K.: Atmospheric particle number 5
size distribution in Central Europe: Statistical relations to air masses and meteorology, J. Geophys. Res., 106(D23), 32005–32018, 2001. 11332
Draxler, R. R. and Rolph, G. D.: HYSPLIT (Hybrid Single-Particle Lagrangian Integrated Trajec-tory) Model access via NOAA ARL READY Website (http://www.arl.noaa.gov/ready/hysplit4.
html), NOAA Air Resources Laboratory, Silver Spring, MD, 2003. 11328
10
Dominici, F., McDermott, A., Daniels, M., Zeger, S. L., and Samet, J. M.: Revised analyses of the National Morbidity, Mortality, and Air Pollution Study: mortality among residents of 90 cities, J. Toxicol. Environ. Health A, 68(13–14), 1071–1092, 2005. 11324
Dominici, F., Peng, R. D., Bell, M. L., Pham, L., McDermott, A., Zeger, S. L., and Samet, J. M.: Fine particulate air pollution and hospital admissions for cardiovascular and respiratory 15
deseases, JAMA, 295, 1127–1134, 2006.11324
Dorling, S. R., Davies, T. D., and Pierce, C. E.: Cluster analysis: a technique for estimating the synoptic meteorological controls on air and precipitation chemistry – method and appli-cations, Atmos. Env., 26A, 2575–2581, 1992. 11333
Engler, C., Rose, D., Wehner, B, Wiedensohler, A., Br ¨uggemann, E., Gnauk, T., Spindler, G., 20
Tuch, T., and Birmili, W.: Size distributions of non-volatile particle residuals (Dp < 800 nm) at a rural site in Germany and relation to air mass origin, Atmos. Chem. Phys., 7, 5785–5802,
2007. 11333
Florig, H. K., Sun, G., and Song, G.: Evolution of particulate regulation in China–prospects and challenges of exposure-based control, Chemosphere, 49(9), 1163–1174, 2002.11324
25
Franklin, M., Zeka, A., and Schwartz, J.: Association between PM2.5and all-cause and
specific-cause mortality in 27 US communities, J Expos Sci Environ Epidemiol, 17(3), 279–287, 2006.
11324
Guinot, B., Roger, J.-C., Cachier, H., Pucai, W., Jianhui, B., and Tong, Y.: Impact of vertical atmospheric structure on Beijing aerosol distribution, Atmos. Environ., 40, 5167–5180, 2006. 30
11325
Guinot, B., Cachier, H., Sciare, J., Tong, Y., Xin, W., Jianhua, Y.: Beijing aerosol: Atmospheric interactions and new trends, J. Geophys. Res., 112, D14314, 10.1029/2006JD008195, 2007.
ACPD
8, 11321–11362, 2008
Aerosol pollution and air mass history in
Beijing, China Wehner et al. Title Page Abstract Introduction Conclusions References Tables Figures ◭ ◮ ◭ ◮ Back Close Full Screen / Esc
Printer-friendly Version Interactive Discussion 11323
Han, L., Zhuang, G., Cheng, S., Wang, Y., and Li, J.: Characteristics of re-suspended road dust and its impact on the atmospheric environment in Beijing, Atmos. Environ., 41, 7485–7499,
2007. 11325
Huang, X.-F., Hu, M., He, L.-Y., and Tang, X.-Y.: Chemical characterization of water-soluble 5
organic acids in PM2.5in Beijing, China, Atmos. Environ., 39, 2819–2827, 2005. 11324
Kan, H., London, S. J., Chen, G., Zhang, Y., Song, G., Zhao, N., Jiang, L., Chen, B.: Differen-tiating the effects of fine and coarse particles on daily mortality in Shanghai, China, Environ Int., 33(3), 376–384, 2007. 11324
Kaiser, D. P. and Qian, Y.: Decreasing trends in sunshine duration over China for
10
1954 - 1998: Indication of increased haze pollution? Geophys. Res. Lett., 29, 2042,
10.1029/2002GL016057, 2002. 11323
Kettunen, J., Lanki, T., Tiittanen, P., Aalto, P. P., Koskentalo, T., Kulmala, M., Salomaa, V., and Pekkanen, J.: Associations of fine and ultrafine particulate air pollution with stroke mortality in an area of low air pollution levels, Stroke, 38(3), 918–922, 2007.11324
15
Lawrence, M. G., Butler, T. M., Steinkamp, J., Gurjar, B. R., and Lelieveld, J.: Regional pollution potentials of megacities and other major population centers, Atmos. Chem. Phys., 7, 3969– 3987, 2007. 11323
Li, X., Kikuo, O., Peng, Z., Daizhou, Z., and Guangyu, S.: An Observational Study of Physical and Chemical Characteristics of Atmospheric Aerosol Particles from Late Spring to Early 20
Autumn over the Beijing Area, Chinese Journal of Atmospheric Sciences, 26(3), 401–411,
2002. 11325
Ostro, B., Broadwin, R., Green, S., Feng, W. Y., and Lipsett, M.: Fine particulate air pollu-tion and mortality in nine California counties: Results from CALFINE, Environmental Health Perspectives, 114(1), 29–33, 2006. 11324
25
Peters, A., Dockery, D. W., Muller, J. E., and Mittleman, M. A.: Increased particulate air pollution and the triggering of myocardial infarction, Circulation, 103, 2810–2815, 2001. 11324
Peters, A., Schneider, A., Greven, S., Bellander, T., Forastiere, F., Ibald-Mulli, A., Illig, T., Jacquemin, B., Katsouyanni, K., Koenig, W., Lanki, T., Pekkanen, J., Pershagen, G., Pic-ciotto, S., Ruckerl, R., Rosario, A. S., Stefanadis, C., and Sunyer, J.: Air pollution and in-30
flammatory response in myocardial infarction survivors: gene-environment interactions in a high-risk group, Inhal.Toxicol, 19(1), 161–175, 2007.11324
Asso-ACPD
8, 11321–11362, 2008
Aerosol pollution and air mass history in
Beijing, China Wehner et al. Title Page Abstract Introduction Conclusions References Tables Figures ◭ ◮ ◭ ◮ Back Close Full Screen / Esc
Printer-friendly Version Interactive Discussion
ciation of daily cause-specific mortality with ambient particle air pollution in Wuhan, China, Environmental Research, 105(3), 380–389, 2007a. 11324
Qian, W., Fu, J., and Yan, Z.: Decrease of light rain events in summer associated with a warming environment in China during 1961–2005, Geophys. Res. Lett., 34, L11705,
10.1029/2007GL029631, 2007b.11323
5
Ruckerl, R., Phipps, R. P., Schneider, A., Frampton, M., Cyrys, J., Oberdorster, G., Wichmann, H. E., and Peters, A.: Ultrafine particles and platelet activation in patients with coronary heart disease–results from a prospective panel study, Part Fibre. Toxicol., 4, 1, 2007.11324
Ruuskanen, J., Tuch, Th., ten Brink, H., Peters, A., Khlystov, A., Mirme, A., Kos, G. P. A., Brunekreef, B., Wichmann, H. E., Buzorius, G., Vallius, M., Kreyling, W. G., and Pekkanen, 10
J.: Concentrations of ultrafine, fine and PM2.5particles in three European cities, Atmos. Env.,
35, 3729–3738, 2001. 11329
Schwartz, J. and Neas, L. M.: Fine particles are more strongly associated than coarse particles with acute respiratory health effects in schoolchildren [see comments], Epidemiology, 11(1), 6–10, 2000. 11324
15
Shao, M., Tang, X., Zhang, Y., and Li, W.: City clusters in China: air ad surface water pollution, Front Ecol Environ, 4, 353–361, 2006.11323
Stanier, C. O., Khlystov, A. Y., and Pandis, S. N.: Nucleation events during the Pittsburgh Air Quality study: Description and relation to key meteorological, gas phase, and aerosol parameters, Aerosol Sci. Technol., 38, 253–264, 2004. 11329
20
St ¨olzel, M., Breitner, S., Cyrys, J., Pitz, M., Wolke, G., Kreyling, W., Heinrich, J., Wichmann, H.-E., and Peters, A.: Daily mortality and particulate matter in different size classes in Erfurt, Germany, J. Expo. Sci. Environ. Epidemiol., 17(5) 458–467, 2007. 11324
Streets, D. G., Gupta, S., Waldhoff, S. T., Wang, M. Q., Bond, T. C., and Yiyun, B.: Black carbon emissions in China, Atmospheric Environ., 35, 4281–4296, 2001. 11323
25
Sugimoto N., Uno, I., Nishikawa, M., Shimizu, A., Matsui, I., Dong, X., Chen, Y., and Quan, H.: Record Heavy Asian Dust in Beijing in 2002: Observations and Model Analysis of Recent Events, Geophys. Res. Lett., 30(12), 1640, 10.1029/2002GL016349, 2003.11327
Tuch, T. M., Wehner, B., Pitz, M., Cyrys, J., Heinrich, J., Kreyling, W. G., Wichmann, H. E., and Wiedensohler, A.: Long-term measurements of size-segregated ambient aerosol in two 30
German cities located 100 km apart, Atmospheric Environ., 37, 4687–4700, 2003. 11329
van Dingenen, R., Raes, F., Putaud, J.-P., Baltensperger, U., Charron, A., Facchini, M.-C., Decesari, S., Fuzzi, S., Gehrig, R., Hansson, H.-C., Harrison, R. M., H ¨uglin, C., Jones, A. M.,
ACPD
8, 11321–11362, 2008
Aerosol pollution and air mass history in
Beijing, China Wehner et al. Title Page Abstract Introduction Conclusions References Tables Figures ◭ ◮ ◭ ◮ Back Close Full Screen / Esc
Printer-friendly Version Interactive Discussion
Laj, P., Lorbeer, G., Maenhaut, W., Palmgren, F., Querol, X., Rodriguez, S., Schneider, J., ten Brink, H., Tunved, P., Tørseth, K., Wehner, B., Weingartner, E., Wiedensohler, A., and W ˚ahlin, P.: A European aerosol phenomenology 1: Physical characteristics of particulate matter at kerbside, urban, rural and background sites in Europe, Atmospheric Environ., 38,
2561–2577, 2004. 11330
5
Wang, Y., Zhuang, G. S., Tang, A. H., Yuan, H., Sun, Y. L., Chen, S. A., and Zheng, A. H.: The ion chemistry and the source of PM2.5 aerosol in Beijing, Atmospheric Environ., 39,
3771–3784, 2005a.11325
Wang, Y., Hu, B., and Liu, G.: A primary study of the variations of vertical radiation with the Bei-jing 325-m Meteorological tower, Advances in Atmospheric Sciences, 22, 401–407, 2005b. 10
11325
Wang, Y., Zhuang, G., Sun, Y., and An, Z.: The variation of characteristics and formation mechanisms of aerosols in dust, haze and clear days in Beijing, Atmos. Environ. 40, 6579– 6591, 2006. 11324
Wehner, B., Wiedensohler, A.: Long term measurements of submicrometer urban aerosols: 15
statistical analysis for correlations with meteorological conditions and trace gases, Atmos. Chem. Phys., 3, 867–879, 2003.11329
Wehner, B., Wiedensohler, A., Tuch, T. M., Wu, Z. J., Hu, M., Slanina, J., and Kiang, C. S.: Variability of the aerosol number size distribution in Beijing, China: New particle forma-tion, dust storms, and high continental background, Geophys. Res. Lett., 31(22), L22108, 20
10.1029/2004GL021596, 2004. 11325
Wong, T. W., Tam, W. S., Yu, T. S., and Wong, A. H.: Associations between daily mortalities from respiratory and cardiovascular diseases and air pollution in Hong Kong, China, Occupational and Environmental Medicine, 59(1), 30–35, 2002.11324
Woo, K. S., Chen, D. R., Pui, D. Y. H., and McMurry, P. H.: Measurement of Atlanta Aerosol 25
Size Distributions: Observation of ultrafine particle events, Aerosol Sci. Technol., 34, 75–87,
2001. 11329
Wu, Z., Hu, M., Liu, S., Wehner, B., Bauer, S., Wiedensohler, A., Pet ¨aj ¨a, T., Dal Maso, M., and Kulmala, M.: New particle formation in the mega-city: Beijing, China, J. Geophys. Res., 112, D09209, doi:10.1029/2006JD007406, 2007. 11325,11329,11335
30
Xia, X., Chen, H., and Zhang, W.: Analysis of the dependence of column-integrated aerosol properties on the long-range transport of air masses in Beijing, Atmospheric Environ., 41, 7739–7750, 2007. 11325,11338
ACPD
8, 11321–11362, 2008
Aerosol pollution and air mass history in
Beijing, China Wehner et al. Title Page Abstract Introduction Conclusions References Tables Figures ◭ ◮ ◭ ◮ Back Close Full Screen / Esc
Printer-friendly Version Interactive Discussion
Yu, J., Guinot, B., Yu, T., Wang, X., and Liu, W.: Seasonal variations of number size distribu-tions and mass concentration of atmospheric particles in Beijing, Advances in Atmospheric Sciences, 22, 401–407, 2005. 11325
Yue, W., Schneider, A., Stolzel, M., Ruckerl, R., Cyrys, J., Pan, X., Zareba, W., Koenig, W., Wichmann, H. E., and Peters, A.: Ambient source-specific particles are associated with pro-5
longed repolarization and increased levels of inflammation in male coronary artery disease patients, Mutat. Res., 621, 50–60, 2007. 11324
Zhang, M., Zhong, Y., and Cai, X.: A health-based assesment of particulate air pollution in urban areas of Beijing in 2000–2004, Science of the Total Environment 376, 100–108, 2007.
11324
10
Zheng, M., Salmon, L. G., Schauer, J. J., Zeng, L. M., Kiang, C. S., Zhang, Y. H., and Cass, G. R.: Seasonal trends in PM2.5source contributions in Beijing, China, Atmos. Environ., 39,
3967–3976, 2005. 11324,11325
Zhong, J., Guangyu, S., and Huansen, C.: Analysis on Aerosol concentration of Beijing during 1998-2001, Climate and Environmental Research, 8(4), 495–502, 2003. 11325
ACPD
8, 11321–11362, 2008
Aerosol pollution and air mass history in
Beijing, China Wehner et al. Title Page Abstract Introduction Conclusions References Tables Figures ◭ ◮ ◭ ◮ Back Close Full Screen / Esc
Printer-friendly Version Interactive Discussion
Table 1.Calculated parameters to represent number size distributions by 3 lognormal modes. The symbols mean: geometric mean diameters Dp, particle number concentration N, and geometric standard deviation σ for the three modes: mode 1=nucleation mode, mode 2=Aitken mode, mode 3=accumulation mode.
NIGHT Dp1 N1 σ1 Dp2 N2 σ2 Dp3 N3 σ3 NW 17.9 7900 2.3 60 20000 1.9 165 7200 1.75 S 17.9 10100 1.7 63 17100 1.9 190 12000 1.75 loc 19.3 9000 1.8 68 18600 1.9 167 12200 1.75 NE 18.0 9900 1.7 63 19600 1.9 173 8800 1.75 DAY NW 8.0 28600 1.8 36 27700 1.9 135 7200 1.8 S 8.6 11300 1.8 37 22600 1.9 161 16800 1.8 loc 9.5 9900 1.8 45 26600 1.9 151 14300 1.8 NE 8.3 10900 1.9 39 25000 1.9 147 9400 1.8
ACPD
8, 11321–11362, 2008
Aerosol pollution and air mass history in
Beijing, China Wehner et al. Title Page Abstract Introduction Conclusions References Tables Figures ◭ ◮ ◭ ◮ Back Close Full Screen / Esc
Printer-friendly Version Interactive Discussion
Table 2.Calculated parameters to represent mean number size distributions from cluster analy-sis by 3 lognormal modes. The symbols mean: geometric mean diameters Dp, particle number concentration N, and geometric standard deviation σ for the three modes: mode 1=nucleation mode, mode 2=Aitken mode, mode 3=accumulation mode.
NIGHT Dp1 N1 σ1 Dp2 N2 σ2 Dp3 N3 σ3 Cluster 1 12.0 9400 1.8 54 23000 1.85 184 8900 1.7 Cluster 2 12.0 8000 1.9 55 22700 1.85 183 5100 1.7 Cluster 3 19.2 7500 1.9 75 30800 1.85 205 9300 1.7 Cluster 4 20.1 10100 1.8 80 28100 1.85 227 5400 1.7 Cluster 5 16.5 8000 1.7 75 24000 1.85 224 10500 1.7 Cluster 6 17.0 8300 1.7 71 19000 1.85 199 8800 1.7 DAY Dp1 N1 σ1 Dp2 N2 σ2 Dp3 N3 σ3 Cluster 1 8.8 35500 1.9 35 20400 1.9 118 9800 1.8 Cluster 2 8.1 35200 1.8 38 25100 1.9 156 2700 1.8 Cluster 3 7.5 14900 1.8 45 27100 1.9 160 12300 1.8 Cluster 4 9.0 11900 1.7 43 27200 1.9 148 14000 1.8 Cluster 5 10.9 13700 1.9 47 22100 1.9 173 14800 1.8 Cluster 6 12.5 10400 1.9 48 21300 1.9 158 13000 1.8
ACPD
8, 11321–11362, 2008
Aerosol pollution and air mass history in
Beijing, China Wehner et al. Title Page Abstract Introduction Conclusions References Tables Figures ◭ ◮ ◭ ◮ Back Close Full Screen / Esc
Printer-friendly Version Interactive Discussion 01.03.2004 01.09.2004 01.03.2005 01.09.2005 01.03.2006 0 2 4 6 8 01.03.2004 01.09.2004 01.03.2005 01.09.2005 01.03.2006 0 100 200 300 N (< 8 0 0 n m ) [ *1 0 4 cm -3 ] V (< 8 0 0 n m ) [ μ m 3 cm -3 ]
Fig. 1. Daily averages and running mean of calculated particle number (N) and volume (V ) concentrations (Dp<800 nm) from March 2004 until March 2006.
ACPD
8, 11321–11362, 2008
Aerosol pollution and air mass history in
Beijing, China Wehner et al. Title Page Abstract Introduction Conclusions References Tables Figures ◭ ◮ ◭ ◮ Back Close Full Screen / Esc
Printer-friendly Version Interactive Discussion 0 100 200 300 400 500 600 100 1000 10000 0 100 200 300 400 500 600 1000 10000 0 100 200 300 400 500 600 0 2000 4000 6000 8000 10000 0 100 200 300 400 500 600 0 5000 10000 15000 0 100 200 300 400 500 600 0 5000 10000 15000 20000 0 100 200 300 400 500 600 0 5000 10000 15000 20000 3 - 10 nm N [c m -3 ] 10 - 20 nm 20 - 30 nm N [c m -3 ] 30 - 50 nm 50 - 100 nm N [c m -3 ] V< 800 nm [μm3 cm-3] 100 - 800 nm V< 800 nm [μm3 cm-3]
Fig. 2. Number concentration of selected size classes vs. total volume concentration
ACPD
8, 11321–11362, 2008
Aerosol pollution and air mass history in
Beijing, China Wehner et al. Title Page Abstract Introduction Conclusions References Tables Figures ◭ ◮ ◭ ◮ Back Close Full Screen / Esc
Printer-friendly Version Interactive Discussion
NW
NE
loc
S
Fig. 3.Representative back trajectories over 72 h and their classification into four sectors: NW: Northwest, NE: Northeast, S: South, loc: local Beijing. Red dots mark cities with more than 5 million inhabitants.