HAL Id: hal-00296920
https://hal.archives-ouvertes.fr/hal-00296920
Submitted on 30 Jan 2006
HAL is a multi-disciplinary open access
archive for the deposit and dissemination of
sci-entific research documents, whether they are
pub-lished or not. The documents may come from
teaching and research institutions in France or
abroad, or from public or private research centers.
L’archive ouverte pluridisciplinaire HAL, est
destinée au dépôt et à la diffusion de documents
scientifiques de niveau recherche, publiés ou non,
émanant des établissements d’enseignement et de
recherche français ou étrangers, des laboratoires
publics ou privés.
The impact of El Niño-Southern Oscillation on the
Canadian climate
A. Shabbar
To cite this version:
A. Shabbar. The impact of El Niño-Southern Oscillation on the Canadian climate. Advances in
Geosciences, European Geosciences Union, 2006, 6, pp.149-153. �hal-00296920�
SRef-ID: 1680-7359/adgeo/2006-6-149 European Geosciences Union
© 2006 Author(s). This work is licensed under a Creative Commons License.
Advances in
Geosciences
The impact of El Ni ˜no-Southern Oscillation on the Canadian climate
A. Shabbar
Environment Canada, Toronto, Ontario, M3H 5T4, Canada
Received: 19 August 2005 – Revised: 16 December 2005 – Accepted: 21 December 2005 – Published: 30 January 2006
Abstract. The quasi-periodic El Ni˜no -Southern Oscillation
(ENSO) phenomenon in the tropical Pacific Ocean produces the largest interannual variation in the cold season climate of Canada. The diabatic heating in the eastern tropical Pacific, associated with the warm phase of ENSO (El Ni˜no), triggers Rossby waves which in turn gives rise to the Pacific-North American teleconnection (PNA) over the North American sector. The strongest cell of the PNA pattern lies over west-ern Canada. In most of southwest-ern Canada, mean winter tem-perature distribution is shifted towards warmer values, and precipitation is below normal. The presence of El Ni˜no pro-vides the best opportunity to make skillful long-range winter forecast for Canada. A strong El Ni˜no event, while bring-ing respite from the otherwise cold winter in Canada, can be expected to cost the Canadian economy two to five billion dollars.
1 Introduction
Second only to the seasonal cycle, the El Ni˜no-Southern Os-cillation (ENSO) phenomenon provides one of the strongest sources of interannual variability in the Canadian climate. The quasi-periodic, anomalous, diabatic heating in the trop-ical Pacific Ocean forces anomalies in troptrop-ical convection, which in turn forces strong upper tropospheric divergence in the tropics and convergence in the subtropics. This dynami-cal response appears as a standing Rossby wave, with energy propagating from the tropics into the midlatitudes, charac-teristically producing a pattern reminiscent of the Pacific-North American teleconnection pattern (Wallace and Gut-lzer, 1981). There is a strong theoretical framework for the midlatitude circulation response to the tropical heating (Hoskin and Karoly, 1981). The strongest midlatitude cen-tre of the PNA teleconnection lies over western Canada. The PNA pattern not only changes the mean boreal winter and
Correspondence to: A. Shabbar
(amir.shabbar@ec.gc.ca)
spring climate conditions in Canada, but it also affects the ex-tremes in such parameters as temperature, precipitation and wind speed (Shabbar and Khandekar, 1996). The deleterious effects of a strong El Ni˜no on the Canadian economy are be-tween two to five billion dollars. The focus of this paper is on the impact of the warm phase of ENSO on the Canadian climate.
El Ni˜no also provides the best opportunity to make skillful long-range forecasts for Canada. Both the dynamical and sta-tistical forecast models are designed to fully recognize major El Ni˜no events, and are expected to produce the most skillful seasonal forecasts during such events (Derome et al., 2001; Shabbar and Barnston, 1996). The success enjoyed provides a boost to the long-range prediction program in Canada. The early warning system in place assures preparedness by both the public and the industrial sector.
2 Definition of El Ni ˜no and circulation
Over time, a number of indices have been used to measure the intensity of El Ni˜no. One such measure is the Oceanic Ni˜no Index (ONI). It is defined as the running three-month mean SST anomaly for the Ni˜no 3.4 region. Ni˜no 3.4 encom-passes the area from 5◦N to 5◦S and 120◦to 170◦W. ONI is now most frequently used to identify El Ni˜no (warm) and its counterpart La Ni˜na (cool) events in the tropical Pacific. Warm events are defined when the five month standardized anomaly exceeds 0.5. Strong El Ni˜no events are character-ized by values higher than 1.5. Figure 1 shows the evolution of the ONI from 1950 to 2005. The very strong 1982–83 and 1997–98 events clearly stand above all others during the last half of the twentieth century.
In response to the changes in the quasi-stationary Rossby waves, the storm track over the Pacific also changes. During El Ni˜no winters, the main jet stream over the North Pacific is likely to split on its approach to North America (Shab-bar et al., 1997). Figure 2 shows that a weaker branch is diverted northward into the Arctic while the stronger lower
150 A. Shabbar: The impact of El Ni˜no-Southern Oscillation on the Canadian climate
Fig. 1. SST anomalies in the Ni˜no 3.4 region (5◦N–5◦S, 120◦– 170◦W).
Fig. 2. Anomaly in 500 hPa height during El Ni˜no winters. Jet
stream position is indicated by heavy arrows.
subtropical branch (whose mean position is over the Pacific northwest United States and southwestern Canada) is shifted several degrees of southward. The southern Canadian region lies in between the two jets and receives milder and drier-than-normal winters, while southern California experiences above-normal precipitation (Cayan and Peterson, 1989).
With the establishment of a positive anomaly centre over the western two-third of southern Canada, peak winds at the surface show a distinct reduction over Canada during El Ni˜no winters (Fig. 3). Here, peak wind is defined as a wind speed of at least 28 km/h. Reduction in wind speed has implications for the generation of wind energy during El Ni˜no years.
Fig. 3. Percent change in mean peak wind between El Ni˜no and
neutral years.
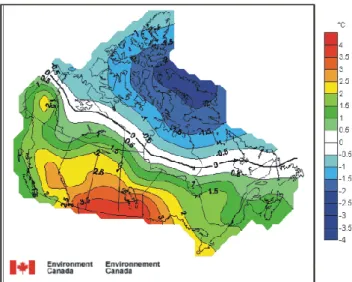
Fig. 4. Composite winter temperature departure from 1951–2000
normal during strong ONI events.
3 Climatic impact of El Ni ˜no
3.1 Temperature
In response to the Rossby wave, the PNA teleconnec-tion becomes established over western Canada, and natu-rally induces changes in extratropical atmospheric circula-tion (Horel and Wallace, 1981). The result is the amplifi-cation of the western Canadian ridge. Positive surface tem-perature anomalies emerge over northwestern Canada in late autumn. The positive temperature anomalies strengthen and expand eastward to cover most of southern Canada during the course of the winter season (Shabbar and Khandekar, 1996). Figure 4 shows positive December–January–February tem-perature anomalies from the Yukon through southern Canada to the Maritime Provinces. The polar jet stream over north-eastern Canada keeps the Arctic air mass over the high Arctic and northeastern Arctic, resulting in colder-than-normal win-ter in those regions.
Fig. 5. Frequency distribution of El Ni˜no, La Ni˜na and
ENSO-neutral events.
A composite of the mean temperature anomaly distribu-tion for El Ni˜no, La Ni˜na and ENSO-neutral years over west-ern Canada (west of 100◦W) during the January–February– March period is shown in Fig. 5. A Gaussian curve is fitted to each of the three distributions separately. Distribution of temperature in El Ni˜no years is shifted toward warmer val-ues relative to the ENSO-neutral years and the distribution of temperatures in La Ni˜na years is shifted toward colder values. 3.2 Precipitation
El Ni˜no has a significant impact on the precipitation pattern over southern Canada during the first winter following its onset. The results show that a distinct pattern of negative precipitation anomalies in a region stretching from British Columbia, through the Canadian Prairie Provinces, and into the Great Lakes region. The precipitation anomalies can be explained by the associated mid-tropospheric flow, which, following the onset of El Ni˜no, resembles the positive phase of the PNA. The diversion of the jet stream southward leaves most of southern Canada in a drier-than-normal regime. Un-like the eastward propagative nature of the temperatures, no progression of precipitation anomalies is evident in the anal-ysis. Figure 6 highlights December–January–February pre-cipitation anomalies (mm/day) in response to a strong ONI.
4 El Ni ˜no and climatic extremes
Shown in Fig. 7 are the changes in the likelihood of an ex-treme warm temperature anomaly in percent above average during an El Ni˜no episode. Chances of warm temperature anomalies are increased over southern Canada from early winter to early spring. These statistics are based on past
Fig. 6. Composite winter precipitation departure from 1951–2000
normal during strong ONI events.
Fig. 7. The likelihood of temperature extremes (in % above chance)
increases following the onset of El Ni˜no. The probability of extreme warmth increase substantially across southern Canada.
events (1900–1995) and there is no guarantee that the same relationships will exist in future El Ni˜no events.
152 A. Shabbar: The impact of El Ni˜no-Southern Oscillation on the Canadian climate
Fig. 8. Coupled singular decomposition mode between winter SSTs
(top) and summer PDSI (bottom) over Canada.
Anomalous winter global SSTs in the tropical Pacific Ocean also affect probability of extreme dry and wet summer conditions in Canada. Investigation of the coupled modes, as revealed by the singular value decomposition (Bretheton et al., 1992), between the wintertime global SSTs and subse-quent summer moisture availability in Canada reveals that El Ni˜no events lead to a summer moisture deficit in the west-ern two-thirds of Canada (Fig. 8). The moisture availability is measured by the Palmer Drought Severity Index (PDSI). Nearly one-half of the squared covariance fraction between the SSTs and the PDSI is explained by the ENSO-like annual and interdecadal variability (Shabbar and Skinner, 2004).
5 Seasonal forecast
The skill of long-range forecasting of Canadian tempera-tures and precipitation is evaluated in the hindcast mode by two dynamical models over the 26-year period. Hindcast skill is examined in an ensemble framework, and the bound-ary condition SSTs are prescribed by the previous month’s global values. Skill is measured as a percent-correct score in three equi-probable classes. The 500 hPa geopotential height anomaly forecasts averaged over the season (one-month lead predictions) show skill in winter over the north-eastern Pa-cific, western Canada and eastern North America. Fig-ure 9 shows that the temperatFig-ure skill originates from ENSO
years. For the non-ENSO years, predictions show little skill (Derome et al., 2001).
6 Economic impact of El Ni ˜nos
To an otherwise cold-climate country like Canada, El Ni˜no brings respite from the very cold winters. But some sectors of the Canadian economy are impacted adversely by the pres-ence of El Ni˜no. Foremost among them is the agriculture in-dustry. The dearth of snowfall, especially in the grain grow-ing areas of Canada, often exacerbates any existgrow-ing droughty conditions. Hydroelectric generation capacity is reduced by the decrease in spring precipitation and spring runoff. The west coast fishery is also affected by El Ni˜no. The presence of warm water along the west coast of North America en-courages the migration into the west coast fishing grounds, of species that do not normally live there. In 1982/83, 1991/92, 1992/93, 1997/98, mackerel ranged farther north than usual. These are voracious feeders and prey on juvenile salmon. The effect can be very large. Mackerel caught in Barkley Sound in 1992 and 1993 were discovered to have an average of six to eight juvenile salmon in their stomachs. Some of the main impacts on the Canadian climate during the 1997–98 El Ni˜no were:
– Crop loss owing to dry weather or prolonged drought
exacerbated by El Ni˜no: $2.0 billion
– Loss to the heating industry owing to low heating
de-mand: $1.5 billion
– Loss to the recreation industry (lack of snow for winter
recreation): $300 million
– Loss to the fishery industry (mainly Pacific salmon):
$400–500 million
– Loss to the ice wine industry in the Niagara Peninsula:
$20–30 million
Edited by: P. Fabian and J. L. Santos Reviewed by: two anonymous referees
References
Bretherton, C. S., Smith, C., and Wallace, J. M.: An intercompar-ison of methods for finding coupled patterns in climate data, J. Climate, 5, 541–560, 1992.
Cayan, D. R. and Peterson, D. H.: The influence of the North Pacific atmospheric circulation on streamflow in the west, PA-CLIM, Geophys. Monogr., 55, Amer. Geophys. Union, 375–397, 1989.
Derome, J., Brunet, G., Plante, A., Gagnon, N., Boer, G. J., Zwiers, F. W., Lambert, S. J., Sheng, S., and Ritchie, H.: Seasonal predic-tions based on two dynamical models, Atmos-Ocean., 39, 485– 501, 2001.
Horel, J. D. and Wallace, J. M.: Planetary scale atmospheric phe-nomena associated with the Southern Oscillation, Mon. Wea. Rev., 109, 813–829, 1981.
Fig. 9. (Top panels) Percent-correct skill score of temperature (left) and its statistical significance (right) over the hindcast period 1969–94
in ENSO years. (Bottom panels) Same as top panels but for non-ENSO years.
Hoskin, B. J. and Karoly, D. J.: The steady linear response of a spherical atmosphere thermal and orographic forcing, J. Atmos. Sci., 38, 1179–1196, 1981.
Shabbar, A. and Khandekar, M.: The impact of El Ni˜no-Southern Oscillation on the temperature field over Canada, Atmos.-Ocean, 34, 401–416, 1996.
Shabbar, A. and Barnston, A. G.: Skill of seasonal climate forecasts in Canada using canonical correlation analysis, Mon. Wea. Rev., 124, 2370–2385, 1996.
Shabbar, A., Bonsal, B., and Khandekar, M.: Canadian precipitation patterns associated with the Southern Oscillation, J. Climate, 10, 3016–3027, 1997.
Shabbar, A. and Skinner, W.: Summer drought patterns in Canada and the relationship to global sea surface temperatures, J. Cli-mate, 14, 2866–2880, 2004.
Wallace J. M. and Gutlzer, D. S.: Teleconnections in the geopo-tential height field during the northern hemisphere winter, Mon. Wea. Rev., 109, 784–812, 1981.