HAL Id: hal-00302618
https://hal.archives-ouvertes.fr/hal-00302618
Submitted on 26 Feb 2007HAL is a multi-disciplinary open access
archive for the deposit and dissemination of sci-entific research documents, whether they are pub-lished or not. The documents may come from teaching and research institutions in France or abroad, or from public or private research centers.
L’archive ouverte pluridisciplinaire HAL, est destinée au dépôt et à la diffusion de documents scientifiques de niveau recherche, publiés ou non, émanant des établissements d’enseignement et de recherche français ou étrangers, des laboratoires publics ou privés.
Predicting arene rate coefficients with respect to
hydroxyl and other free radicals in the gas-phase: a
simple and effective method using a single topological
descriptor
M. R. Mcgillen, C. J. Percival, G. Pieterse, L. A. Watson, D. E. Shallcross
To cite this version:
M. R. Mcgillen, C. J. Percival, G. Pieterse, L. A. Watson, D. E. Shallcross. Predicting arene rate coefficients with respect to hydroxyl and other free radicals in the gas-phase: a simple and effec-tive method using a single topological descriptor. Atmospheric Chemistry and Physics Discussions, European Geosciences Union, 2007, 7 (1), pp.2961-2989. �hal-00302618�
ACPD
7, 2961–2989, 2007Predicting arene rate coefficients M. R. McGillen et al. Title Page Abstract Introduction Conclusions References Tables Figures ◭ ◮ ◭ ◮ Back Close
Full Screen / Esc
Printer-friendly Version Interactive Discussion
EGU
Atmos. Chem. Phys. Discuss., 7, 2961–2989, 2007 www.atmos-chem-phys-discuss.net/7/2961/2007/ © Author(s) 2007. This work is licensed
under a Creative Commons License.
Atmospheric Chemistry and Physics Discussions
Predicting arene rate coefficients with
respect to hydroxyl and other free
radicals in the gas-phase: a simple and
effective method using a single
topological descriptor
M. R. McGillen1, C. J. Percival1, G. Pieterse2, L. A. Watson3, and D. E. Shallcross3
1
School of Earth, Atmospheric and Environmental Sciences, The University of Manchester, The Sackville Building, Sackville Street, P.O. Box 88, Manchester M60 1QD, UK
2
Department of Air Quality and Climate Change, Energy Research Centre for the Netherlands, P.O. Box 1, 1755 ZG Petten, The Netherlands
3
Biogeochemistry Research Centre, School of Chemistry, The University of Bristol, Cantock’s Close BS8 1TS, UK
Received: 13 November 2006 – Accepted: 2 February 2007 – Published: 26 February 2007 Correspondence to: C. J. Percival ([email protected])
ACPD
7, 2961–2989, 2007Predicting arene rate coefficients M. R. McGillen et al. Title Page Abstract Introduction Conclusions References Tables Figures ◭ ◮ ◭ ◮ Back Close
Full Screen / Esc
Printer-friendly Version Interactive Discussion
EGU Abstract
The reactivity of aromatic compounds is of great relevance to pure and applied chemi-cal disciplines, yet existing methods for estimating gas-phase rate coefficients for their reactions with free radicals lack accuracy and universality. Here a novel approach is taken, whereby strong relationships between rate coefficients of aromatic hydrocar-5
bons and a Randi´c-type topological index are investigated, optimized and developed into a method which requires no specialist software or computing power.
Measured gas-phase rate coefficients for the reaction of aromatic hydrocarbons with OH radicals were correlated with a calculated Randi´c-type index, and optimized by in-cluding a term for side chain length. Although this method is exclusively for use with 10
hydrocarbons, it is more diverse than any single existing methodology since it incor-porates alkenylbenzenes into correlations, and can be extended towards other radical species such as O(3P) (and tentatively NO3, H and Cl). A comparison (with species
common to both techniques) is made between the topological approach advocated here and a popular approach based on electrophilic subsituent constants, where it 15
compares favourably.
A modelling study was carried out to assess the impact of using estimated rate co-efficients as opposed to measured data in an atmospheric model. The difference in model output was negligible for a range of NOx concentrations, which implies that this
method has utility in complex chemical models. 20
Strong relationships (e.g. for OH, R2= 0.96) between seemingly diverse compounds including benzene, multisubstituted benzenes with saturated, unsaturated, aliphatic and cyclic substitutions and the nonbenzenoid aromatic, azulene suggests that the Randi´c-type index presented here represents a new and effective way of describing aromatic reactivity, based on a quantitative structure-activity relationship (QSAR). 25
ACPD
7, 2961–2989, 2007Predicting arene rate coefficients M. R. McGillen et al. Title Page Abstract Introduction Conclusions References Tables Figures ◭ ◮ ◭ ◮ Back Close
Full Screen / Esc
Printer-friendly Version Interactive Discussion
EGU 1 Introduction
Since its conception, the term “aromatic” used in description of a specific class of organic compound has been subjected to many refinements, and where ambiguity remains (e.g. where H ¨uckel’s rule is not obeyed or where the compound in question is of nonplanar geometry) consensus is met chiefly on the empirical grounds of the 5
characteristic reactivity of aromatic compounds in general. The present study uses a quantitative structure-activity relationship to describe the reactivity of a subset of these compounds, the arenes, whose gas-phase rate coefficients have hitherto appeared to have no discernable correlation from knowledge of their constitution alone.
The reactivity of aromatic hydrocarbons with free radicals is of direct importance to a 10
variety of chemical subdisciplines including atmospheric chemistry, chemical epidemi-ology and combustion processes. Motor vehicle emissions and fuel spillage are a major source of arenes in the urban environment (Calvert et al., 2002), resulting from the high proportion of arenes present in gasoline (especially in European and diesel formula-tions) and the close relationship between fuel composition and exhaust composition 15
with respect to aromatics (Leppard et al., 1993, 1995). Arenes are classified as car-cinogenic by the International Agency for Research on Cancer (IARC) and exposure has been linked to dermal absorption and subsequent biotransformation into harm-ful metabolites (Pellack-Walker and Blumer, 1986); leukaemia (Carletti and Romano, 2002), cytogenetic damage (Celik et al., 2003) and persisting neurobehavioural dis-20
turbances in humans (Mikkelsen, 1997) and laboratory rats (Gralewicz and Wiaderna, 2001).
Aromatic hydrocarbons are common trace components of the urban atmosphere, and given their associated health risk, their primacy as tropospheric ozone precursors (Derwent et al., 1996) and the contributions of their oxidation products towards sec-25
ondary organic aerosol (SOA) formation (Odum et al., 1997), it is highly pertinent to investigate factors affecting the atmospheric lifetime (e.g. their reactivity towards free radicals) and the volatility of oxidation products (e.g. the branching ratio between
radi-ACPD
7, 2961–2989, 2007Predicting arene rate coefficients M. R. McGillen et al. Title Page Abstract Introduction Conclusions References Tables Figures ◭ ◮ ◭ ◮ Back Close
Full Screen / Esc
Printer-friendly Version Interactive Discussion
EGU
cal addition and radical abstraction reactions) of aromatic hydrocarbons.
The present study describes an accurate and accessible method by which unknown rate coefficients can be estimated for the reaction of arenes with OH and O(3P) radicals and provisional estimation methods for certain arene species with H and Cl (where data are sparse).
5
2 Methodology
Methods for calculating the Randi´c index for saturated and unsaturated hydrocarbons are described elsewhere in the literature (Randi´c, 1975; McGillen et al., 2006a, b). The present method is an extension of that used to calculate the Randi´c index for unsatu-rated hydrocarbons (McGillen et al., 2006b), whereby a Kekul ´e structure is assumed 10
for a phenyl group. Although not a true representation of the benzene ring, the alter-nating single and double bond arrangement of the Kekul ´e structure assigns the same hydrogen-suppressed valency to each carbon atom of the aromatic ring and the va-lency value that is assigned is therefore unimportant, since any error associated with carbon valence is systematic and is of no concern to a correlation study such as this. 15
The Randi´c index (R) is calculated using Eq. (I)
R = Σ(mn)−0.5 (I)
where m and n are valencies of adjacent vertices joined by an edge. The following is a worked example for the structural graph of indene, (see Fig. 1).
The valencies are 4 for vertices 1 and 5, 2 for vertex 4 and 3 for vertices 2, 3, 6, 7, 8 20
and 9. Using Eq. (I), R is calculated:
R = (4 × 3)−0.5+ (3 × 3)−0.5+ (3 × 3)−0.5+ (3 × 2)−0.5+ (2 × 4)−0.5+ (4 × 4)−0.5+ (4 × 4)−0.5+ (4 × 3)−0.5 + (3 × 3)−0.5 + (3 × 3)−0.5 + (3 × 3)−0.5+ (3 × 3)−0.5 + (3 × 3)−0.5 + (3 × 4)−0.5
Where m and n correspond to vertices 1 and 2, 2 and 3, 2 and 3, 3 and 4, 4 and 5, 25
ACPD
7, 2961–2989, 2007Predicting arene rate coefficients M. R. McGillen et al. Title Page Abstract Introduction Conclusions References Tables Figures ◭ ◮ ◭ ◮ Back Close
Full Screen / Esc
Printer-friendly Version Interactive Discussion
EGU
respectively, giving the result 4.46.
One drawback of using the Kekul ´e structure in this approach is that certain arenes (notably those containing an ortho-substitution) will generate a slightly different index (typically ±0.01) depending on which of the two resonance structures is used in cal-culation of the index. Although such a minor difference is considered inconsequential 5
for predictive purposes, for thoroughness these two values have been averaged in this study.
Similar to a phenomenon observed previously for alkenes (McGillen et al., 2006b), species plot on separate trendlines according to the total number of primary (1◦), sec-ondary (2◦) and tertiary (3◦) carbon atoms (Σx◦x) present in the side chain(s), examples 10
of these subgroups based on Σx◦are given in Table 1.
Correlation was improved using a nonlinear regression method to model these data, and incorporating a term for Σx◦using Eq. (II)
ln k = a0ln R + a1+ b0ln (D + 1) (II)
where R is the Randi´c index, D is Σx◦ and a0, a1 and b0 are the model parameters, 15
which can be determined by minimizing the l2-norm of the difference between the rate coefficient measurements and regression model output.
3 Results
Table 2 lists all known measured room temperature rate coefficients for the reaction of C6-C10 arenes with OH, O(3P), NO3, H and Cl radicals together with the respective 20
Σx◦ subgroup and calculated Randi´c index for each species. Experimental data were obtained from the National Institute of Standards and Technology (NIST) Chemical Kinetics Database (2006).
ACPD
7, 2961–2989, 2007Predicting arene rate coefficients M. R. McGillen et al. Title Page Abstract Introduction Conclusions References Tables Figures ◭ ◮ ◭ ◮ Back Close
Full Screen / Esc
Printer-friendly Version Interactive Discussion
EGU
3.1 OH dataset
The OH dataset is the most comprehensive of those covered, and its range of reactivity extends over two orders of magnitude. Rate coefficients for a large variety of species are measured, and the dataset therefore offers the most insight into the distribution of Σx◦subgroups.
5
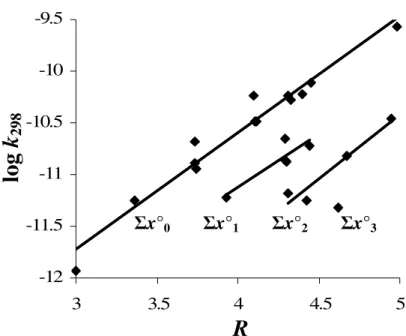
Figure 2 is a plot of Randi´c index against the logarithm of the room temperature rate coefficient (log k298). When plotted with an unmodified Randi´c index, data are observed
to subdivide into parallel and equally offset lines, similar to correlations observed in alkene data (McGillen et al., 2006b). Scatter within respective Σx◦0−2 is minimal and
the gradients of trendlines are in good agreement. 10
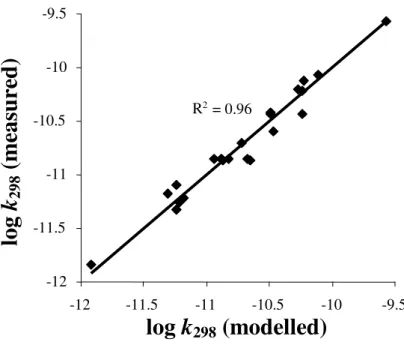
Figure 3 is a plot of log k298 against log k298 modelled using Eq. (II) where a0, b0
and b1 are 10.21, –38.51 and –1.11 respectively. An excellent correlation coefficient of 0.96 is observed. Species possessing m-substituents appear to contribute most to-wards the scatter, shown by the enhanced rate coefficients of m-xylene, mesitylene and
m-ethyltoluene, which results from contributions to the rate coefficients from the
stabil-15
ity of the resonance structures of m-substituted radical transition states. The alkenyl-benzene, β-dimethylstyrene is not included in these correlations because of its highly anomalous rate coefficient. The unusually slow rate coefficient of this compound was noted by the original experimental investigators (Chiorboli et al., 1983), who attributed the non-planar geometry of this compound’s two methyl groups as a contributor to 20
the steric hindrance of the molecule with respect to its otherwise reactive substituent unsaturated bond.
3.2 O(3P) dataset
The second strongest correlation is observed for the O(3P) dataset with r2 = 0.92, furthermore the dataset possesses a similar range of reactivity to the OH dataset, 25
although does not cover as wide a range in terms of structural diversity.
ACPD
7, 2961–2989, 2007Predicting arene rate coefficients M. R. McGillen et al. Title Page Abstract Introduction Conclusions References Tables Figures ◭ ◮ ◭ ◮ Back Close
Full Screen / Esc
Printer-friendly Version Interactive Discussion
EGU
and b1are 13.15, –46.04 and -1.62 respectively. Again, a good correlation is observed
and it is expected that with supplementary data for Σx◦>0, a better correlation could be
achieved by improving constraints on model parameters and spacing between Σx◦0−3.
3.3 NO3dataset
The NO3dataset covers the largest range of reactivity, extending over seven orders of
5
magnitude and is the second most extensive dataset in this study.
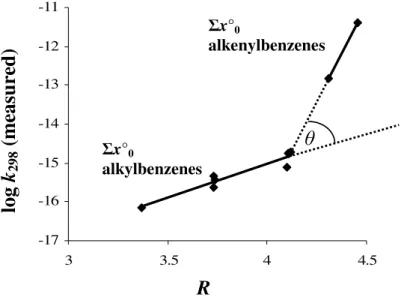
Figure 5 is a plot of Randi´c index against log k298 with respect to NO3. Unlike
the other datasets, an inflection is observed in the data between alkylbenzenes and alkenylbenzenes. Treated as a single trendline, this phenomenon clearly contributes to scatter within the correlation of Σx◦0. Although data appear to segregate into Σx
◦
10
subgroups as observed in the OH and O(3P) data, subgroups do not appear to exhibit the uniformity present in the OH data (this data is not presented in Fig. 5 for reasons of clarity) and further rate coefficient measurements from these subgroups would be expected to provide further insight into whether or not Σx◦subgroups are distributed in a manner analogous to those of OH.
15
3.4 H dataset
The H dataset is limited to six measurements. Despite this small sample size, correla-tion is excellent and appears to exhibit similar trends to those of OH and O(3P). The Σx◦0 possesses a strong correlation coefficient of 0.99, and the only known
measure-ment of a Σx◦1 compound, ethylbenzene plots above the Σx ◦
0 trendline as expected.
20
As with other species, kinetic measurements of Σx◦>0would be expected to strengthen
the relationships observed so far. 3.5 Cl dataset
Likewise limited to six measurements, the Cl correlation is strong, but may exhibit some curvature. It is anticipated that with further experimental measurements the Σx◦0
ACPD
7, 2961–2989, 2007Predicting arene rate coefficients M. R. McGillen et al. Title Page Abstract Introduction Conclusions References Tables Figures ◭ ◮ ◭ ◮ Back Close
Full Screen / Esc
Printer-friendly Version Interactive Discussion
EGU
relation could be strengthened, and it is expected that similar trends will emerge for Σx◦>0. However, given the rapidity of Cl-arene reactions, rate coefficients for many
species will approach the collision limit and estimation methods will be unable to differ-entiate reactivity as it becomes pressure limited.
4 Discussion
5
The hydroxyl radical dataset is most comprehensive both in terms of number of rate coefficients and range of arene substitutions studied. As such, it is the most insightful with respect to the distribution of Σx◦ subgroups and is used as a template for other radicals whose behaviour is assumed to be analogous (e.g. O(3P), H and Cl).
The hydroxyl dataset is likewise most useful for testing the effectiveness of the topo-10
logical approach, since the established arene rate coefficient estimation method of Zetzsch (1982) and optimized further by Atkinson (1991), based on electrophilic sub-stituent constants of Brown and Okamoto (1958) appears to have been developed solely for OH-arene reactions. A direct comparison between the topological approach and Zetzsch’s method is impossible, since the two techniques predict for a different 15
range of aromatic compounds: the topological approach can describe alkenyl substi-tution whereas Zetzsch’s method cannot, and Zetzsch’s method considers oxygenated and nitrated substitution whereas the topological approach, at the time of writing has not been developed to do so. However, where overlap exists between the two meth-ods (i.e. the alkylbenzenes), a comparison can be made, as is shown in Table 3. It 20
is considered most intuitive to assess the predictive capabilities of the two methods by expressing a ratio relationship, r, between the estimated rate coefficient and the measured rate coefficient using Eq. (III).
r = kestimated
kmeasured (III)
To ensure a direct comparison, where the measured rate coefficient exceeds the esti-25
ACPD
7, 2961–2989, 2007Predicting arene rate coefficients M. R. McGillen et al. Title Page Abstract Introduction Conclusions References Tables Figures ◭ ◮ ◭ ◮ Back Close
Full Screen / Esc
Printer-friendly Version Interactive Discussion
EGU
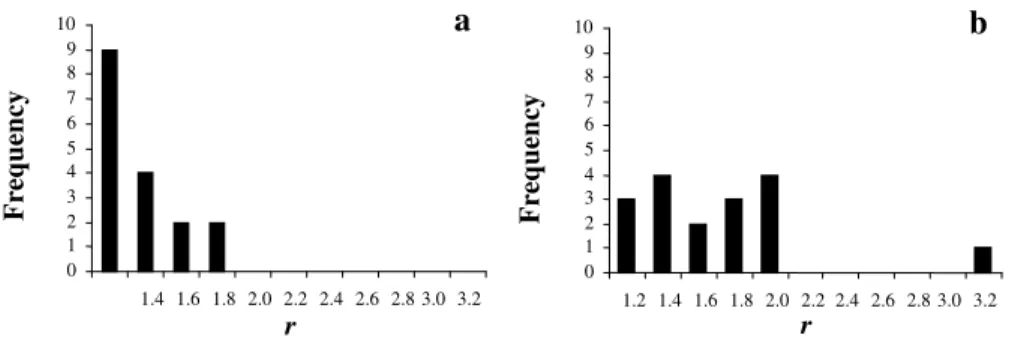
mated rate coefficient, r is inverted. As is evident from histograms of these data shown in Figs. 6a–b, the predictive capability of the topological approach is significantly bet-ter than Zetzsch’s method, which exhibits a larger range of error and a more diffuse distribution across this range.
The range of arenes incorporated into the hydroxyl radical correlation surpasses 5
Zetzsch’s method in the sense that it includes alkenyl substituted species. This is a surprising result since the literature suggests that alkenyl substituted arenes react al-most exclusively through radical addition to the substituted unsaturated bond (Calvert et al., 2002; personal communication, R. Atkinson, 2006). A corollary of this hypothesis is that reactions involving alkenyl substituted arenes ought to react via a distinctly dif-10
ferent mechanism to the remaining arenes, where radical addition to the aromatic ring, hydrogen abstraction from the substituent group(s) and hydrogen abstraction from the aromatic ring are possible mechanisms. The correlations observed in Figs. 2 and 3 ap-pear to contradict this hypothesis, since alkenyl substituted arenes fit seamlessly into the Σx◦0 trendline, a phenomenon that is observed in all datasets studied except for
15
that of the nitrate radical. Short of comprehensive product analyses, this study can only offer a preliminary interpretation of this result, viz. that there are common mechanisms between alkenyl substituted arenes and other arenes. This hypothesis is supported by electron density calculations of alkenyl substituted arenes, which indicate that the aromatic ring possesses comparable electron density to their alkenyl substituents, and 20
ought therefore to possess similar reactivity.
From the strong correlations observed in the O(3P), H and Cl datasets, it appears that these radicals behave in an analogous way to the OH radical. This is especially apparent in the O(3P) correlation, where a similar range of reactivity is observed, and members of Σx◦0−3 plot in their respective fields on a scatter graph of log k298
25
vs. Randi´c index. However, each Σx◦>0 contains only one data point per subgroup,
assuming there is scatter among these subgroups, the position of the respective trend-lines of Σx◦1−3 is therefore rather conjectural at the time of writing, but could be
ACPD
7, 2961–2989, 2007Predicting arene rate coefficients M. R. McGillen et al. Title Page Abstract Introduction Conclusions References Tables Figures ◭ ◮ ◭ ◮ Back Close
Full Screen / Esc
Printer-friendly Version Interactive Discussion
EGU
in mind, the method used for modelling the hydroxyl radical rate coefficients cannot be adapted easily to the other classes of compound with the present dataset because of uncertainties associated with deriving the model parameters in Eq. (II). However, the position of the Σx◦0trendline is unlikely to change significantly, and it is recommended
that, as a provisional method for Σx◦0 species, a simple linear regression fit between
5
experimental rate coefficient data and the Randi´c index will produce estimated rate co-efficients of satisfactory accuracy, given by the equation of the straight line, y=mx + c of the linear regression. Where y is log k298, x is the Randi´c index of the compound in question, the gradient m is 1.648, 1.359 and 1.052 for O(3P), H and Cl respectively and the y-intercept c is –18.628, –17.359 and –13.836 for O(3P), H and Cl respectively. For 10
smaller datasets, H and Cl, this method should be used with caution, since the small sample size precludes a confident analogy with the hydroxyl radical.
The nitrate radical dataset exhibits different and more complex behaviour than the OH, O(3P), H and Cl radical datasets. This is to be expected, since the branching ratio between the reaction pathways of the nitrate radical with arenes are known to 15
differ considerably from those of the hydroxyl radical and likely other radicals of simi-lar behaviour – the major difference being the negligibility of the reaction of the NO3
radical with arene ring systems (Wayne et al., 1990). Evidence for this lack of inter-action with the ring system is presented by the reversal of the trend of reactivity in
o-, m- and p-substituted alkylbenzenes observed in OH-arene reactions (Wayne et 20
al., 1990), whereby m-substituted species are slowest, despite increased activation of reactive sites in the ring system. In contrast, it appears that interactions with the aromatic ring system are of primary importance in the reaction of arenes with the hy-droxyl radical, since m-substitution enhances rates of reaction significantly. Since NO3
attack must therefore occur predominantly on arene substituent sites, the comparison 25
between alkyl and alkenyl substituted arenes becomes analogous to a comparison be-tween NO3-alkane and NO3-alkene reactions, which are kinetically and mechanistically
dissimilar. It is therefore reassuring to note that the Σx◦0trendline of the NO3 dataset
sub-ACPD
7, 2961–2989, 2007Predicting arene rate coefficients M. R. McGillen et al. Title Page Abstract Introduction Conclusions References Tables Figures ◭ ◮ ◭ ◮ Back Close
Full Screen / Esc
Printer-friendly Version Interactive Discussion
EGU
stituted arenes, styrene and indene. It is also notable that the difference in gradient in the correlation of log k298and Randi´c index between alkylbenzene and alkenylbenzene trendlines, denoted by θ in Fig. 5, is almost identical to that of alkanes and alkenes (not presented here) calculated using the same method (0.42 and 0.43 respectively).
The emergence of several trends in the NO3 dataset precludes accurate estimation 5
of NO3-arene rate coefficients at this time, and it is expected that further experimental
data especially from alkenyl substituted arenes and Σx◦>0 will provide greater insight
into the interaction of nitrate radicals with arenes.
Despite the complex behaviour observed in the NO3dataset, in general, correlations
with radical-arene rate coefficients are excellent. Since the Randi´c-type index used 10
only encodes the valency of carbon atoms with respect to other carbon atoms, their adjacency and a term for Σx◦, other molecular properties are not incorporated in the index, and given the high level of correlation, appear to be of minor importance in comparison.
Despite the simplicity of the method used, this topological approach generates very 15
strong relationships with the overall rate coefficients of arenes. Although an exact physical interpretation of what the Randi´c index measures remains subject to discus-sion (Estrada, 2002), the factors governing arene reactivity are simple enough that this index can describe them in adequate detail. The Randi´c index calculation requires few input parameters, and the result is a description of the connectivity of carbon atoms 20
within the molecule. Other factors that might be expected to be of importance such as the geometry and 3-dimensional spatial configuration of a molecule appear to be minor in comparison and by considering the details that the Randi´c index omits, some qual-itative insight may be gained regarding the relative importance of factors contributing towards arene reactivity.
ACPD
7, 2961–2989, 2007Predicting arene rate coefficients M. R. McGillen et al. Title Page Abstract Introduction Conclusions References Tables Figures ◭ ◮ ◭ ◮ Back Close
Full Screen / Esc
Printer-friendly Version Interactive Discussion
EGU 5 Atmospheric implications
The impact of using rate coefficients estimated through our method versus the recom-mended values of Calvert et al. (2002) upon the output of an atmospheric model was assessed. This model employs a simple one-box approach to model the boundary layer. The box is subjected to emissions and depositions at the Earth’s surface and 5
contains rate coefficients, physical and dynamic information, and measurement data. It uses the rate coefficients of hydrocarbons with respect to OH, NO3 and O3 taken
from the Master Chemical Mechanism (MCM), which is a benchmark mechanism for chemical and photochemical processes in the troposphere (Jenkin et al., 1997).
To reduce computational effort, a reduced mechanism similar to the CRI scheme 10
(Jenkin et al., 2002), which limits the number of reactions within the reaction scheme was employed. Although this is a simplification, this reduced mechanism is designed to maintain essential features.
Arene concentrations were obtained from emission inventories. Rate coefficients of arenes with respect to OH were obtained from measurement data as recommended 15
by Calvert et al. (2002). The rate of change of each arene is dependent on its initial concentration, the level of emission, and the concentrations of atmospheric oxidants (mainly NO3and OH). The emissions of NOx, CO, SO2, and VOCs into the model are
based on the UK totals for 2001 reported by the National Atmospheric Emissions In-ventory. A range of NOxconditions appropriate to the urban environment were required
20
for this study, the NOx emissions were scaled by factors of 0.1, 0.5, 1.0, 2.0, and 3.0. The reduced mechanism was restricted to C≤8 arenes, therefore the list of arenes
for which rate coefficients were altered are: benzene, toluene, p-xylene, o-xylene, m-xylene, mesitylene, hemimellitene, ψ-cumene, styrene, ethylbenzene, p-ethyltoluene,
o-ethyltoluene, m-ethyltoluene, cumene, and n-propylbenzene. Figure 7 shows that 25
over the whole range of NOx conditions, our rate coefficients estimates have a minor
effect upon the modelled mixing ratios of ozone in comparison to using measurement data. Furthermore, only minor effects were observed upon the concentrations of other
ACPD
7, 2961–2989, 2007Predicting arene rate coefficients M. R. McGillen et al. Title Page Abstract Introduction Conclusions References Tables Figures ◭ ◮ ◭ ◮ Back Close
Full Screen / Esc
Printer-friendly Version Interactive Discussion
EGU
major species (such as NOxand HOx), especially under conditions of low NOx. Differ-ences in the concentrations of other important species e.g. formaldehyde (HCHO) and peroxyacetyl nitrate (PAN) mixing ratios only began to emerge at NOxemission factors
greater than 1.0.
Further modelling studies were conducted to compare the estimates using the topo-5
logical approach with those predicted using the Zetzsch method. As Zetzsch’s method does not include alkenyl substituted arenes, the rate coefficient of styrene was not al-tered. The results suggest that rate coefficients predicted by the topological approach compare to measured values as well as, if not better than the values predicted by Zet-zsch. The differences between the Zetzsch method versus the topological approach 10
become most apparent for [PAN] and [HCHO] under high NOxconditions (see Fig. 8). As a result of these modelling studies, it is clear that rate coefficients perform well in a simplified version of the MCM, and it is suggested that the topological approach is most suitable for inclusion in the full MCM mechanism, where advantage could be made of the range of arene rate coefficients that can be predicted. It is further suggested that 15
there are many species of arene for which kinetics with respect to atmospheric oxidants are not available that are present in vehicle exhaust emissions (e.g. AQIRP, 1995) and which therefore are of potential importance in urban environments, and it is probable that failure to account for these minor species will result in a greater error associated with model output than the error associated with the use of modelled versus measured 20
rate coefficient data.
6 Conclusions
Strong relationships are observed in correlations between the Randi´c-type index of this study and log k298for the reaction of arenes with OH, O(
3
P), H and Cl radicals. Correla-tion is particularly strong with the OH radical, whose dataset is superior in both number 25
and range of compounds for which measurements are available. In the correlations of the remaining radical species considered (excluding NO3), behaviour is assumed to
ACPD
7, 2961–2989, 2007Predicting arene rate coefficients M. R. McGillen et al. Title Page Abstract Introduction Conclusions References Tables Figures ◭ ◮ ◭ ◮ Back Close
Full Screen / Esc
Printer-friendly Version Interactive Discussion
EGU
be analogous with the OH radical, and rate coefficients should therefore be predicted using the same method. Although, for these species, further rate coefficient measure-ments (preferably possessing as large a range in reactivity as possible) from Σx◦>0
are necessary in order to constrain the model parameters of Equation (II) accurately, facilitating accurate rate coefficient prediction for arenes belonging to Σx◦>0.
5
The present correlations with the NO3 radical appear to be complicated by
mecha-nistic dissimilarity between alkyl and alkenyl substituted arenes, resulting in several re-lationships which are not sufficiently strong to enable accurate prediction of rate coeffi-cients. Further measurements of both alkyl and alkenyl substituted arenes are required before this method can be used to predict NO3 rate coefficients accurately. However, 10
the trends observed in the NO3 data suggest that the Randi´c-type index used in this study is able to identify mechanistically distinct behaviour.
With the exception of the nitrate reaction, correlations of alkenyl-substituted arenes accord with a general trend incorporating all arene species. This suggests that the reactions of alkenyl-substituted arenes and alkyl substituted arenes possess very sim-15
ilar mechanisms, contrary to the prevailing opinion in the literature, which suggests that reaction occurs almost exclusively on the alkenyl substituent (Calvert et al., 2002), an argument which appears to be founded upon the magnitude of alkenyl substituted species relative to their alkyl homologues and the two existing product studies of the OH + styrene reaction (Bignozzi et al., 1981; Tuazon et al., 1993). Here, the failure of 20
NO3 to exhibit the same tendency as the other radicals provides a reference point by
which mechanistically distinct behaviour can be recognized in these correlations, the relationships of the other radicals afford no such discrimination.
Modelling studies identified the topological approach as suitable for inclusion in com-plex atmospheric models such as the MCM, which at present uses measured rate co-25
efficients for model input, and which may benefit from the range of species that can be predicted accurately through this approach.
In conclusion, this study finds the topological approach to be eminently suitable for the estimation of arene-radical gas-phase rate coefficients, because it surpasses the
ACPD
7, 2961–2989, 2007Predicting arene rate coefficients M. R. McGillen et al. Title Page Abstract Introduction Conclusions References Tables Figures ◭ ◮ ◭ ◮ Back Close
Full Screen / Esc
Printer-friendly Version Interactive Discussion
EGU
methodology of Zetzsch (1982) and Atkinson (1991) both in terms of its diversity and its accuracy, since this method is able to predict every rate coefficient within a factor of two of the measured value (with the exception of the anomalously slow rate coefficient of β-dimethylstyrene). Furthermore, despite its simplicity, the topological approach represents an accurate description of arene reactivity, and as such an approximation 5
of the important factors contributing towards this reactivity.
References
Atkinson, R.: Atmospheric lifetimes of dibenzo-para-dioxins and dibenzofurans, Sci. Total Env-iron., 104, 17–33, 1991.
Atkinson, R.: University of California, Riverside, California, CA. Personal communication, 2006.
10
Bignozzi, C. A., Maldotti, A., Chiorboli, C., Bartocci, C. , and Carassiti, V.: Kinetics and mech-anism of reactions between aromatic olefins and hydroxyl radicals, Int. J. Chem. Kinet., 13, 1235–1242, 1981.
Brown, H. C. and Okamoto, Y.: Directive effects in aromatic substitution: electrophilic sub-stituent constants, J. Am. Chem. Soc., 80, 4979–4987 1958.
15
Calvert, J. G., Atkinson, R., Becker, K. H., Kamens, R. M., Seinfeld, R. H., Wallington, T. J., and Yarwood, G.: The Mechanisms of Atmospheric Oxidation of Aromatic Hydrocarbons, Oxford University Press, New York, 2002.
Carletti, R. and Romano, D.: Assessing health risk from benzene pollution in an urban area, Environ. Monit. Assess., 80, 135–148, 2002.
20
Celik, A., Cavas, T., and Ergene-Gozukara, S.: Cytogenetic biomonitoring in petrol station attendants: micronucleus test in exfoliated buccal cells, Mutagenesis, 18, 417–421, 2003. Chiorboli, C., Bignozzi, C. A., Maldotti, A., Giardini, P. F., Rossi, A., and Carassiti, V.: rate
constants for the gas-phase reactions of OH radicals with beta-dimethylstyrene and acetone – mechanism of beta-dimethylstyrene NOx- air photo-oxidation, Int. J. Chem. Kinet., 15, 579–
25
586, 1983.
Derwent, R. G., Jenkin, M. E., and Saunders, S. M.: Photochemical ozone creation potentials for a large number of reactive hydrocarbons under European conditions, Atmos. Environ., 30, 181–199, 1996.
ACPD
7, 2961–2989, 2007Predicting arene rate coefficients M. R. McGillen et al. Title Page Abstract Introduction Conclusions References Tables Figures ◭ ◮ ◭ ◮ Back Close
Full Screen / Esc
Printer-friendly Version Interactive Discussion
EGU
Estrada, E.: The structural interpretation of the Randi´c index, Internet J. Mol. Des., 1, 360–366, 2002.
Gralewicz, S. and Wiaderna, D.: Behavioral effects following subacute inhalation exposure to m-xylene or trimethylbenzene in the rat - A comparative study, Neurotoxicology, 22, 79–89, 2001.
5
Jenkin, M. E., Saunders, S. M., and Pilling, M. J.: The tropospheric degradation of volatile organic compounds: A protocol for mechanism development, Atmos. Environ., 31, 81–104, 1997.
Jenkin, M. E., Saunders, S. M., Derwent, R. G., and Pilling, M. J.: Development of a reduced speciated VOC degradation mechanism for use in ozone models, Atmos. Environ., 36, 4725–
10
4734, 2002.
Leppard, W. R., Benson, J. D., Burns, V. R., Gorse, R. A., Hochhauser, A. M., Knapper, J. C., Koehl, L. A., Rapp, L. A., and Reuter, R. M.: How Heavy Hydrocarbons in the Fuel Affect Exhaust Mass Emissions: Correlation of Fuel, Engine-out, and Tailpipe Speciation, SAE paper 932725, The Auto/Oil Air Quality Improvement Research Program, Society of
15
Automotive Engineers, USA, 1993.
Leppard, W. R., Koehl, L. A., Benson, J. D., Burns, V. R., Hochhauser, A. M., Knapper, J. C., Painter, L. J., Rapp, L. A., Rippon, B. H., Reuter, R. M., and Rutherford, J. A.: Effects of Gasoline Properties (T50, T90, and sulfur) on Exhaust Hydrocarbon Emissions of Cur-rent and Future Vehicles: Speciation Analysis, SAE paper 952505, The Auto/Oil Air Quality
20
Improvement Research Program, Society of Automotive Engineers, USA, 1995.
McGillen, M. R., Percival, C. J., Raventos-Duran, T., Sanchez-Rayna, G., and Shallcross, D. E.: Can topological indices be used to predict gas-phase rate coefficients of importance to tropospheric chemistry? Free radical abstraction reactions of alkanes, Atmos. Environ., 40, 2488–2500, 2006a.
25
McGillen, M. R., Crosier, J. C., Percival, C. J., Sanchez-Rayna, G., Shallcross, and D. E.: Can topological indices be used to predict gas-phase rate coefficients of importance to tropo-spheric chemistry? Reactions of alkenes with OH, NO3 and O3, Chemosphere, 65, 2035– 2044, 2006b.
Mikkelsen, S.: Epidemiological update on solvent neurotoxicity, Environ. Res., 73, 101–112,
30
1997.
National Institute of Standards and Technology (NIST), 2006. Chemical Kinetics Database on the Web, Standard Refence Database 17, Version 7.0 (Web Version), release 1.3, April 2006
ACPD
7, 2961–2989, 2007Predicting arene rate coefficients M. R. McGillen et al. Title Page Abstract Introduction Conclusions References Tables Figures ◭ ◮ ◭ ◮ Back Close
Full Screen / Esc
Printer-friendly Version Interactive Discussion
EGU
(http://kinetics.nist.gov/).
Odum, J. R., Jungkamp, T. P. W., Griffin, R. J., Forstner, H. J. L., Flagan, R. C., and Seinfeld, J. H.: Aromatics, reformulated gasoline, and atmospheric organic aerosol formation, Environ. Sci. Technol., 31, 1890–1897, 1997.
Pellack-Walker, P. and Blumer, J. L.: DNA damage in L5178YS cells following exposure to
5
benzene metabolites, Mol. Pharmicol., 30, 42–47, 1986.
Randi´c, M.: Characterization of molecular branching, J. Am. Chem. Soc., 97, 6609–6615, 1975.
Tuazon, E. C., Arey, J., Atkinson, R., and Aschmann, S. M.: Gas-phase reactions of 2-vinylpyridine and styrene with OH and NO3 radicals and O3, Environ. Sci. Technol., 27,
10
1832–1841, 1993.
Wayne, R. P., Barnes, I., Biggs, P., Burrows, J. P., Canosa-Mas, C. E., Hjorth, J., Le Bras, G., Moortgat, G. K., Perner, D., Poulet, G., Restelli, G., and Sidebottom, H.: The nitrate radical: physics, chemistry, and the atmosphere, Air Pollution Research Report 31, Commission of the European Communities, Belgium, 1990.
15
Zetzsch, C.: Predicting the rate of OH-addition to aromatics using σ+-electrophilic substituent constants for mono- and polysubstituted benzene, Proc. XVth Informal Conference on Pho-tochemistry, Stanford, 29–32, 1982.
ACPD
7, 2961–2989, 2007Predicting arene rate coefficients M. R. McGillen et al. Title Page Abstract Introduction Conclusions References Tables Figures ◭ ◮ ◭ ◮ Back Close
Full Screen / Esc
Printer-friendly Version Interactive Discussion EGU 1 Arene x°x indene toluene 0 indane ethylbenzene 1 tetralin propylbenzene 2 1 1 2 1 2
Table 1. Examples of bicyclic and monocyclic arenes belonging to Σx◦ 0−2.
ACPD
7, 2961–2989, 2007Predicting arene rate coefficients M. R. McGillen et al. Title Page Abstract Introduction Conclusions References Tables Figures ◭ ◮ ◭ ◮ Back Close
Full Screen / Esc
Printer-friendly Version Interactive Discussion
EGU
Table 2. Measured arene + radical room temperature rate coefficients used in this study,
alongside Randi´c-type index and Σx◦
xsubgroup for each respective arene.
arene kOH kO(3P ) kNO3 kH kCl R Σx◦x benzene 1.19×10⁻¹² 3.16×10⁻¹⁴ 5.65×10⁻¹⁴ 1.50×10⁻¹¹ 3.000 0 toluene 5.70×10⁻¹² 7.63×10⁻¹⁴ 6.79×10⁻¹⁷ 1.35×10⁻¹³ 5.91×10⁻¹¹ 3.366 0 p-xylene 1.30×10⁻¹¹ 2.15×10⁻¹³ 4.53×10⁻¹⁶ 5.80×10⁻¹³ 1.50×10⁻¹⁰ 3.732 0 o-xylene 1.14×10⁻¹¹ 1.83×10⁻¹³ 3.77×10⁻¹⁶ 1.50×10⁻¹⁰ 3.741 0 m-xylene 2.09×10⁻¹¹ 3.98×10⁻¹³ 2.32×10⁻¹⁶ 1.40×10⁻¹⁰ 3.732 0 mesitylene 5.75×10⁻¹¹ 2.60×10⁻¹² 8.00×10⁻¹⁶ 4.098 0 hemimellitene 3.27×10⁻¹¹ 1.13×10⁻¹² 1.86×10⁻¹⁵ 4.116 0 ψ-cumene 3.25×10⁻¹¹ 1.02×10⁻¹² 1.81×10⁻¹⁵ 4.107 0 styrene 5.86×10⁻¹¹ 4.50×10⁻¹² 1.51×10⁻¹³ 3.49×10⁻¹² 3.60×10⁻¹⁰ 4.309 0 α-methylstyrene 5.30×10⁻¹¹ 4.323 0 β-dimethylstyrene 3.30×10⁻¹¹ 4.732 0 trans-propenylbenzene 5.99×10⁻¹¹ 4.399 0 2-propenylbenzene 4.32×10⁻¹² 4.444 0 indene 7.80×10⁻¹¹ 4.10×10⁻¹² 4.455 0 azulene 2.72×10⁻¹⁰ 3.90×10⁻¹⁰ 4.982 0 ethylbenzene 6.07×10⁻¹² 5.84×10⁻¹⁴ 2.49×10⁻¹³ 3.927 1 toluene, p-ethyl 1.36×10⁻¹¹ 8.58×10⁻¹⁶ 4.293 1 toluene, o-ethyl 1.32×10⁻¹¹ 4.299 1 toluene, m-ethyl 2.24×10⁻¹¹ 4.302 1 indane 1.91×10⁻¹¹ 7.35×10⁻¹⁵ 4.445 1 n-propylbenzene 5.71×10⁻¹² 4.427 2 cumene 6.61×10⁻¹² 6.77×10⁻¹⁴ 4.309 2 p-cymene 1.51×10⁻¹¹ 1.00×10⁻¹⁵ 4.675 2 tetralin 3.44×10⁻¹¹ 1.11×10⁻¹⁴ 4.951 2 benzene, tert-butyl 4.85×10⁻¹² 6.64×10⁻¹⁴ 4.616 3
ACPD
7, 2961–2989, 2007Predicting arene rate coefficients M. R. McGillen et al. Title Page Abstract Introduction Conclusions References Tables Figures ◭ ◮ ◭ ◮ Back Close
Full Screen / Esc
Printer-friendly Version Interactive Discussion
EGU
Table 3. Comparison between the predictive capabilities of the topological approach and the
Zetzsch method using the ratio relationship, r between rate coefficients of the respective esti-mation method and measured rate coefficients.
arene k
OHmeas. kOHmod. r kOHZetzsch r
benzene 1.19×10⁻¹² 1.71×10⁻¹² 1.44 2.30×10⁻¹² 1.93 toluene 5.70×10⁻¹² 4.61×10⁻¹² 1.24 5.90×10⁻¹² 1.04 p-xylene 1.30×10⁻¹¹ 1.24×10⁻¹¹ 1.05 7.10×10⁻¹² 1.83 o-xylene 1.14×10⁻¹¹ 1.27×10⁻¹¹ 1.12 7.10×10⁻¹² 1.61 m-xylene 2.09×10⁻¹¹ 1.24×10⁻¹¹ 1.68 1.50×10⁻¹¹ 1.39 mesitylene 5.75×10⁻¹¹ 3.34×10⁻¹¹ 1.72 3.82×10⁻¹¹ 1.51 hemimellitene 3.27×10⁻¹¹ 3.51×10⁻¹¹ 1.07 1.83×10⁻¹¹ 1.79 ψ-cumene 3.25×10⁻¹¹ 3.42×10⁻¹¹ 1.05 1.83×10⁻¹¹ 1.78 ethylbenzene 6.07×10⁻¹² 5.26×10⁻¹² 1.15 5.60×10⁻¹² 1.08 toluene p-ethyl 1.36×10⁻¹¹ 1.54×10⁻¹¹ 1.13 7.10×10⁻¹² 1.92 toluene o-ethyl 1.32×10⁻¹¹ 1.58×10⁻¹¹ 1.20 7.10×10⁻¹² 1.86 toluene m-ethyl 2.24×10⁻¹¹ 1.54×10⁻¹¹ 1.46 1.43×10⁻¹¹ 1.57 n-propylbenzene 5.71×10⁻¹² 7.24×10⁻¹² 1.27 7.50×10⁻¹²a 1.31 cumene 6.61×10⁻¹² 5.09×10⁻¹² 1.30 4.63×10⁻¹² 1.25 p-cymene 1.51×10⁻¹¹ 1.53×10⁻¹¹ 1.01 1.21×10⁻¹¹ 1.25 tetralin 3.44×10⁻¹¹ 3.50×10⁻¹¹ 1.01 1.14×10⁻¹¹b 3.02 benzene, tert-butyl 4.85×10⁻¹² 6.78×10⁻¹² 1.40 4.30×10⁻¹² 1.13 a
Mode of calculation unclear from published methodology. Value taken from literature20.
b
ACPD
7, 2961–2989, 2007Predicting arene rate coefficients M. R. McGillen et al. Title Page Abstract Introduction Conclusions References Tables Figures ◭ ◮ ◭ ◮ Back Close
Full Screen / Esc
Printer-friendly Version Interactive Discussion EGU
1
2
3
4
5
6
7
8
9
Fig. 1. Structural graph of indene.
ACPD
7, 2961–2989, 2007Predicting arene rate coefficients M. R. McGillen et al. Title Page Abstract Introduction Conclusions References Tables Figures ◭ ◮ ◭ ◮ Back Close
Full Screen / Esc
Printer-friendly Version Interactive Discussion EGU -12 -11.5 -11 -10.5 -10 -9.5 3 3.5 4 4.5 5
lo
g
k
2 9 8R
x°
0x°
1x°
2x°
3Fig. 2. A plot of Randi´c index against measured arene + OH log k298. Data is seen to subdivide
into approximately evenly spaced, parallel subgroups, dependent on Σx◦x.
ACPD
7, 2961–2989, 2007Predicting arene rate coefficients M. R. McGillen et al. Title Page Abstract Introduction Conclusions References Tables Figures ◭ ◮ ◭ ◮ Back Close
Full Screen / Esc
Printer-friendly Version Interactive Discussion EGU R2 = 0.96 -12 -11.5 -11 -10.5 -10 -9.5 -12 -11.5 -11 -10.5 -10 -9.5
log k
298(modelled)
lo
g
k
2 9 8(
m
ea
su
re
d
)
ACPD
7, 2961–2989, 2007Predicting arene rate coefficients M. R. McGillen et al. Title Page Abstract Introduction Conclusions References Tables Figures ◭ ◮ ◭ ◮ Back Close
Full Screen / Esc
Printer-friendly Version Interactive Discussion EGU R2 = 0.92 -14 -13.5 -13 -12.5 -12 -11.5 -14 -13.5 -13 -12.5 -12 -11.5
log k
298(modelled)
lo
g
k
2 9 8(
m
ea
su
re
d
)
Fig. 4. Log-log plot of arene + O(3P)k298 modelled using Eq. (II) against measured k298.
ACPD
7, 2961–2989, 2007Predicting arene rate coefficients M. R. McGillen et al. Title Page Abstract Introduction Conclusions References Tables Figures ◭ ◮ ◭ ◮ Back Close
Full Screen / Esc
Printer-friendly Version Interactive Discussion EGU -17 -16 -15 -14 -13 -12 -11 3 3.5 4 4.5
lo
g
k
2 9 8(
m
ea
su
re
d
)
R
x°0 alkenylbenzenes x°0 alkylbenzenesFig. 5. Log-log plot of Randi´c index against arene + NO3k298 against measured k298.
Stip-pled lines represent forecasts of the Σx◦0alkyl- and alkenylbenzene trendlines. The difference
in gradient observed between these trendlines, denoted by θ, is attributed to a difference in mechanism between the alkylbenzenes (where abstraction from alkyl substituents dominates) and alkenylbenzenes (where addition to alkenyl substituents dominates).
ACPD
7, 2961–2989, 2007Predicting arene rate coefficients M. R. McGillen et al. Title Page Abstract Introduction Conclusions References Tables Figures ◭ ◮ ◭ ◮ Back Close
Full Screen / Esc
Printer-friendly Version Interactive Discussion EGU 0 1 2 3 4 5 6 7 8 9 10 1.4 1.6 1.8 2.0 2.2 2.4 2.6 2.83.0 3.2 a r F re q u en cy 0 1 2 3 4 5 6 7 8 9 10 1.2 1.4 1.6 1.8 2.0 2.22.4 2.6 2.83.0 3.2 b r F re q u en cy
Fig. 6. (a) Histogram of the ratio relationship, r between rate coefficients estimated using the
topological approach and measured rate coefficients. (b) Histogram of the ratio relationship, r between rate coefficients estimated using the Zetzsch method and measured rate coefficients.
ACPD
7, 2961–2989, 2007Predicting arene rate coefficients M. R. McGillen et al. Title Page Abstract Introduction Conclusions References Tables Figures ◭ ◮ ◭ ◮ Back Close
Full Screen / Esc
Printer-friendly Version Interactive Discussion
EGU
Fig. 7. Ozone mixing ratio modelled with different arene + OH rate coefficients. ——- Rate coefficients taken from Calvert et al. (2002) and- - - - -rate coefficients predicted by this work.
ACPD
7, 2961–2989, 2007Predicting arene rate coefficients M. R. McGillen et al. Title Page Abstract Introduction Conclusions References Tables Figures ◭ ◮ ◭ ◮ Back Close
Full Screen / Esc
Printer-friendly Version Interactive Discussion
EGU
Fig. 8a. PAN mixing ratio modelled with different arene + OH rate coefficients. ——- Rate coefficients taken from Calvert et al. (2002)——-rate coefficients predicted by this work and
ACPD
7, 2961–2989, 2007Predicting arene rate coefficients M. R. McGillen et al. Title Page Abstract Introduction Conclusions References Tables Figures ◭ ◮ ◭ ◮ Back Close
Full Screen / Esc
Printer-friendly Version Interactive Discussion
EGU
Fig. 8b. HCHO mixing ratio modelled with different arene + OH rate coefficients. ——-Rate coefficients taken from Calvert et al. (2002)——-rate coefficients predicted by this work and