HAL Id: hal-02300122
https://hal.archives-ouvertes.fr/hal-02300122v2
Submitted on 15 May 2020HAL is a multi-disciplinary open access archive for the deposit and dissemination of sci-entific research documents, whether they are pub-lished or not. The documents may come from teaching and research institutions in France or abroad, or from public or private research centers.
L’archive ouverte pluridisciplinaire HAL, est destinée au dépôt et à la diffusion de documents scientifiques de niveau recherche, publiés ou non, émanant des établissements d’enseignement et de recherche français ou étrangers, des laboratoires publics ou privés.
Nanoparticles alloying in liquids:
Laser-ablation-generated Ag or Pd nanoparticles and
laser irradiation-induced AgPd nanoparticle alloying
Nikolaos Semaltianos, Rémi Chassagnon, Virginie Moutarlier, Virginie
Blondeau-Patissier, Mohamed Assoul, Guy Monteil
To cite this version:
Nikolaos Semaltianos, Rémi Chassagnon, Virginie Moutarlier, Virginie Blondeau-Patissier, Mohamed Assoul, et al.. Nanoparticles alloying in liquids: Laser-ablation-generated Ag or Pd nanoparticles and laser irradiation-induced AgPd nanoparticle alloying. Nanotechnology, Institute of Physics, 2017, 28 (15), pp.155703 (43). �10.1088/1361-6528/aa6282�. �hal-02300122v2�
NANOPARTICLES ALLOYING IN LIQUIDS: LASER ABLATION GENERATED Ag OR Pd NANOPARTICLES AND LASER IRRADIATION
INDUCED Ag-Pd NANOPARTICLES ALLOYING
N. G. Semaltianos*a, R. Chassagnonb, V. Moutarlierc, V. Blondeau-Patissierd, M. Assoule, G. Monteile
aAristotle University of Thessaloniki, Dept. of Physics, Thessaloniki, 54124, GREECE bUniversité Bourgogne Franche-Comté, Laboratoire Interdisciplinaire Carnot De
Bourgogne, ICB UMR CNRS 6303, Dijon, 21078, FRANCE
cUniversité Bourgogne Franche-Comté, UTINAM, UMR CNRS 6213, Besançon,
25030, FRANCE
dUniversité Bourgogne Franche-Comté, Femto-st, Dépt. Temps-Fréquence, UMR
CNRS 6174, Besançon, 25030, FRANCE
eUniversité Bourgogne Franche-Comté, Femto-st, Dépt. Mécanique Appliquée, UMR
CNRS 6174, Besançon, 25030, FRANCE
Abstract
Laser irradiation of a mixture of single element micro/nanomaterials may lead to their alloying and fabrication of multielement structures. In addition to the laser induced alloying of particulates in the form of micro/nanopowders in ambient atmosphere (which forms the basis of the field of additive manufacturing technology), another interesting problem is the laser induced alloying of a mixture of single element nanoparticles in liquids since this process may lead to the direct fabrication of alloyed nanoparticles colloidal solutions. In this work Ag and Pd bare, surface ligand-free nanoparticles in solution were prepared by laser ablation of the corresponding bulk target materials separately in water. The two solutions were mixed and the mixed solution was laser irradiated for different time durations in order to investigate the laser induced
nanoparticles alloying in liquid. Nanoparticles alloying and formation of AgPd alloyed nanoparticles takes place with the decrease of the intensity of the surface plasmon resonance peak of the Ag nanoparticles (at ~405 nm) with the irradiation time while the low wavelength interband absorption peaks of either Ag or Pd nanoparticles remain unaffected by the irradiation for a time duration even as long as 30 mins. The nanoalloys have lattice constants with values between those of the pure metals which indicates that they consist of Ag and Pd in approximately 1:1 ratio similar to the atomic composition of the starting mixed nanoparticles solution. Formation of nanoparticle networks consisting of bimetallic alloyed nanoparticles and nanoparticles which remain as single elements even after the end of the irradiation, joining together, are also formed. The binding energies of the 3d core electrons of both Ag and Pd nanoparticles shift to lower energies with the irradiation time also a typical characteristic of AgPd alloyed nanoparticles. The mechanisms of nanoparticles alloying and networks formation are discussed.
Keywords: nanoparticles; laser ablation; colloids; nanoalloying
PACS: 78.67.Bf - Nanocrystals and nanoparticles; 79.20.Eb - Laser ablation; 81.05.Bx - Metals, semimetals, and alloys.
1. Introduction.
Bimetallic nanoparticles, i.e. nanoparticles composed of two different metals are of wide scientific and research interest mainly because they exhibit properties which are a combination of the properties which nanoparticles of each metal exhibit separately and/or have better and unique properties not found in nanoparticles of each of the two metals [1]. These properties arise from both their crystal structure through the alteration of the lattice constant of the individual metals and their electronic structure because of vacancies in their valence orbitals. Throughout the years, bimetallic nanoparticles consisted of a number of different element combinations have been investigated.
An interesting system which finds wide applications in practice involves AgPd bimetallic nanoparticles. Ag and Pd are completely miscible and AgPd bimetallic nanoparticles are interesting for SERS, electrochemical biosensors [2], catalysts for the hydrogen production from formic acid decomposition and the fabrication of micro polymer electrolyte membrane fuel cells [3], electrodes in multilayer ceramic capacitors [4], which are widely tunable over the entire visible spectrum, plasmonic nanostructures which also remain SERS active [5], as selective hydrogenation catalysts [6], as smart drug delivery systems in photothermal therapy and chemotherapy [7] and other applications. AgPd alloy nanoparticles in solution are traditionally synthesized by chemical methods involving the simultaneous reduction of Ag and Pd salts in the presence of a reducing and stabilizing agent [8].
Laser ablation for a bulk single-metal target material in liquid has been used so far in the investigation of nanoparticles alloying in liquids and synthesis of bimetallic alloy nanoparticles. This methodology usually involves the following strategies [9]: (i) mixing nanoparticles colloidal solutions from each of the two metals which were initially prepared by laser ablating each target separately in liquid and subsequently laser irradiating the mixed solution. Examples include nanostructures which were prepared consisting of AuPt nanoparticles joined together (nanowebs)
[10], AuCo nanoparticles [11] or AuNi nanoparticles [12], (ii) ablating one target material in the colloidal solution of nanoparticles of the other target material which was previously prepared by ablating it separately in the liquid. Examples include bimetallic AgAu or AgCu nanoparticles [13], (iii) adding the chemical precursor of one metal to the nanoparticles colloidal solution of the other metal which was originally prepared by laser ablating the target material in the liquid. Examples include AgPd core-shell nanoparticles which were synthesized by adding PdCl2
precursor into the solution of Ag nanoparticles which were initially prepared by laser ablating the Ag bulk target in water [14]. The precursor was reduced via galvanic displacement onto the surface of the Ag nanoparticles because of their negative surface charge induced by the laser ablation synthesis, or (iv) laser ablating the bulk target material of one metal in the chemical precursor solution of the other metal. An example is PtCo alloy nanoparticles impeded in CoOx
matrix which were synthesized by laser ablating a Co target in potassium tetrachloroplatinate(II) (K2PtCl4) precursor solution [15]. Part of the Co seeding nanoparticles which were generated
from the bulk target laser ablation reacted with Pt-based ionic species in the solution from the chemical precursor, forming PtCo alloys while the seeding nanoparticles which are in excess were oxidized to CoOx finally forming PtCo/CoOx nanocomposites. For the preparation of
bimetallic alloy nanoparticles only (excluding investigation of nanoparticles alloying in liquids), laser ablation of a bulk target material which is either a bimetallic alloy or a sintered mixture of powders of the two elements, has also been used [16,17].
The purpose of this paper is to investigate laser induced Ag and Pd nanoparticles alloying in liquid. The morphology, crystal structure and composition of the produced nanomaterials are investigated and the physical mechanisms which govern the laser induced nanoalloying effect in liquid are elucidated. In addition to the interesting physicochemical properties which bimetallic alloy nanoparticles of these two elements exhibit, outlined above, other reasons for investigating this system are that Pd and Ag are completely miscible elements over the entire
composition range [18], they are in subsequent columns in the periodic table and have the same crystal structure (fcc) differing only in the value of the lattice constants and also Pd exhibits only an intraband transition in the UV range of the spectrum while Ag exhibits an intraband transition in the UV but also a Surface Plasmon Resonance (SPR) absorption in the visible range thus it would be interesting to investigate the effect of the alloying on the SPR absorption peak. In addition, the literature lacks data on the laser-induced alloying in liquids of nanoparticles of this particular combination of elements.
2. Experimental Details.
2.1 Nanoparticles synthesis and irradiation of the mixed nanoparticles solution.
Nanoparticles synthesis was performed using a picosecond pulsed laser source (10 ps, 1064 nm, 100 kHz) at a high pulse energy of 160 μJ (16 W) (fluence=12.7 J/cm2 by considering the beam diameter of ~40 μm) and Ag and Pd bulk targets (purity 99.9 %). Each target was first ablated for ~5 mins separately in 40 ml DI water in a steering liquid flow cell by focusing the beam onto the target surface through the ~7 mm layer of water, resulting to ~2 and ~18 mg of Ag and Pd nanoparticles respectively in the volume of the liquid (solutions concentration equal to 0.05 mg/ml for Ag and 0.45 mg/ml for Pd). Then, the Pd solution was diluted to the same atomic concentration with the Ag solution and equal amounts from each solution were mixed and irradiated in a cuvette (4 ml of mixed solution) by using the same laser parameters, under magnetic stirring. In this work the nanoparticles alloying effect in liquid which is induced by irradiating the mixed nanoparticles colloidal solution was investigated using a solution with equal atomic concentrations of the two metals namely with a 50:50 atomic percentage ratio and varying the irradiation time duration between 0 and 30 mins. An experimental configuration for the irradiation of the mixed nanoparticles colloidal solution was used, similar to the ones used for example in ref. [19], [10], [40], [42] or [43] using a
rectangular cuvette (flat walls) with the beam incident horizontally, irradiating the solution from the side of the cuvette and focused at the middle of the liquid volume.
2.2 Characterization techniques.
The UV-vis absorption spectrum of the mixed solution was measured after each irradiation. In order to investigate the effect of the irradiation in the nanoparticles of each metal separately, colloidal solutions from each metal were irradiated for the same time durations and the UV-vis absorption spectra were measured. The nanoparticles sizes/size distribution, morphology of the bimetallic structures and crystal lattice were imaged by TEM/HRTEM from solution droplets dried out on carbon coated copper grids immediately after irradiation. The effect of the formation of the bimetallic alloyed nanoparticles in the crystal structure of the materials was investigated by X-Ray Diffraction (XRD) using a diffractometer with a Cu Kα
source (λ=1.5406 Å) and in their band structure by X-Ray Photoelectron Spectroscopy (XPS) using a spectrometer with Al Kα primary radiation (1486.6 eV) at a pass energy of 40 eV for high resolution scans and 160 eV for survey scans, from solution droplets dried out onto clean glass substrates. Crystal structures were determined from the XRD patterns using the software of the instrument (DiffracPlus EVA).
3. Results and Discussion.
3.1. UV-vis spectrophotometry
The UV-vis absorption spectrum from pure Pd nanoparticles (Fig. 1(a)) is characterized by a broad band peaked at ~218 nm which is due to superposition of interband transitions rather than to any SPR transition [20]. The absorption spectrum from pure Ag nanoparticles (Fig. 1(b)) is characterized by a SPR absorption peak at ~405 nm and a broad interband transition band peaked at ~270 nm [21,20]. Upon laser irradiation of the mixed nanoparticles colloidal solution,
it is observed that the SPR absorption peak from Ag decreases in intensity and shifts slightly to smaller wavelengths while the interband absorption peaks from both metals remain almost unaffected by the irradiation (Fig. 1(c), the spectra were normalized to the absorption of the Ag-Pd unirradiated solution at 407 nm after substracting the absorption at 900 nm). This effect has been observed previously during the synthesis of bimetallic nanoparticles consisting of Pd and of a plasmonic metal such as Ag or Au and it was attributed to the blocking of the SPR absorption of the plasmonic metal by the Pd atoms which are added on its surface (adatoms) and to the gradual increase of the surface coverage of Ag nanoparticles by the Pd adatoms as the irradiation time increases. Examples include the case of Au nanoparticles decorated by Pd atoms by a chemically epitaxial seeded growth method in which the SPR absorption peak of Au nanoparticles (at 509 nm) was decreasing in intensity with the increase of the Pd:Au ratio [22] and the synthesis of AgPd bimetallic nanoparticles by the reduction by a galvanic replacement reaction of PdCl2 precursor on the surface of laser ablation generated Ag nanoparticles where the
intensity of the Ag SPR absorption peak was reduced with the amount of precursor in the solution [14]. At the present experiment, formation of bimetallic alloy nanoparticles takes place (as it will also be shown below from other measurements) and the decrease of the SPR of the Ag nanoparticles is due to the surface Pd atoms on the bimetallic AgPd nanoparticles (which it will be shown that they also contain inclusions of pure Ag or Ag-oxides) while the decrease of the intensity of the SPR peak with the irradiation time is due to gradual increase of the number of Ag nanoparticles which have formed alloy with Pd. Fig. 1 (b) shows the absorption spectra from the pure Ag nanoparticles solution, irradiated for different time durations up to 20 mins. Initially for irradiation times up to 5 mins the SPR peak becomes stronger in intensity and narrower due to the fragmentation by the laser beam of large nanoparticles and aggregates which results to the narrowing of the nanoparticles size distribution [19]. As the irradiation time becomes longer, the SPR peak decreases in intensity due to the starting of the decomposition of the silver
nanoparticles and conversion to silver ions but for times even as long as 20 mins the SPR peak is still observed which indicates that even such a long irradiation time does not lead to the complete decomposition of the nanoparticles. It is also seen that the interband transition peak of Pd nanoparticles of the pure solution remains unaffected by the irradiation for the same length of time of 20 mins (Fig.1(a)). These both observations confirm that the decrease with the irradiation time of the SPR peak from Ag nanoparticles in the mixed solution and its almost complete disappearance for the longest time duration used (of 4 mins) is not due to the decomposition of the nanoparticles of either element by the laser beam but rather to their alloying.
3.2. XRD
XRD patterns from pure Pd (Fig. 2(a)) or Ag (Fig. 2(b)) nanoparticles show all peaks corresponding to Pd or Ag metal, respectively [23]. In the pattern from the Ag nanoparticles another peak at 32.231° appears which corresponds to AgO [23] which is due to the interaction of the silver plasma plume ablation products (silver atoms or ions) with the oxygen species from the water decomposition (most probably water thermolysis). The XRD pattern from the as mixed (un-irradiated) sample (Fig. 2(c)) shows the peaks from Pd and Ag pure metal. Peaks from any silver oxide are not distinguished in the pattern most probably because of the low material quantity and lower count rate (maximum of ~3000) as compared to the pattern for the pure Ag sample (maximum of ~10000) (Fig. 2(b)). Indeed, from the intensity of the AgO peak in the pattern from the pure Ag nanoparticles sample it seems that the percentage concentration of the silver oxides in the original sample is quite small and this percentage becomes even smaller in the as mixed sample due to the lower quantity of the original Ag solution in the mixture. The XRD patterns from the irradiated samples are shown in Fig. 2 (d) (4 mins) and 2 (e) (20 mins). It is readily seen that peaks from pure Pd metal are not observed in the patterns but instead strong peaks appear at angles between the angles corresponding to peaks from pure Ag or pure Pd
nanoparticles and their relative intensities ratio is approximately the same as the intensities ratio of the peaks from the pure metals. These peaks correspond to AgPd bimetallic alloy nanoparticles with lattice constants between the constants of the pure metals (Table 1) [24,25]. According to Vegard's law [26], the lattice constant
x xPd
Ag d −
1 of the dilute alloy Ag1-xPdx is given by the relation: dAg1−xPdx =(1−x)dAg +xdPd, where dAgand dPdare the lattice constants of the
pure metals and x is the molar fraction of Pd in the alloy. From the measured values of the lattice constants (for the (111) reflection) for the pure metal and alloy nanoparticles (Fig. 2(a)-(e)) according to the above relation, the molar fraction of the two elements in the binary nanoalloys are determined as: Ag0.46Pd0.54 and Ag0.44Pd0.56 for the 4 and 20 mins (irradiated) samples,
respectively. Weak peaks appear from pure Ag nanoparticles corresponding to nanoparticles which remained as pure even after the end of the irradiation, i.e. they have not formed an alloy with Pd (Fig. 2(d) and (e)). These peaks become weaker in the 20 mins irradiated sample (Fig. 2(e)) which confirms that longer irradiation is more effective in converting single-element nanoparticles into alloyed ones. Peaks corresponding to silver oxides are also distinguished in the patterns, most probably due to the secondary oxidation of the Ag or AgO nanoparticles in the original solution, caused again by their interaction with the oxygen species from the water decomposition.
3.3. TEM/HRTEM
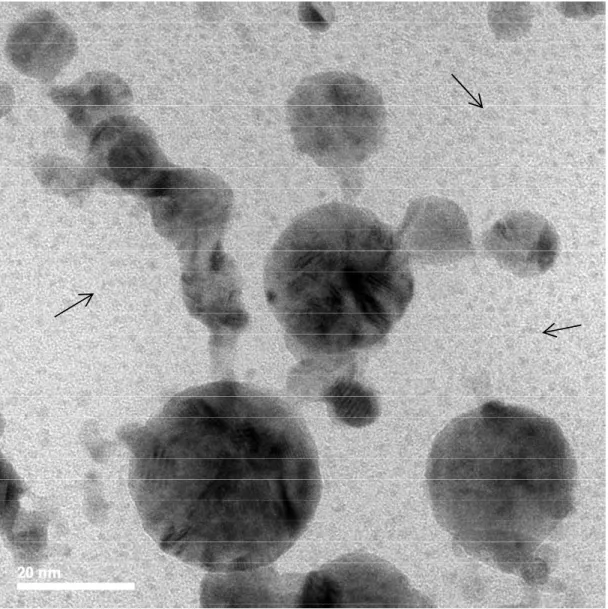
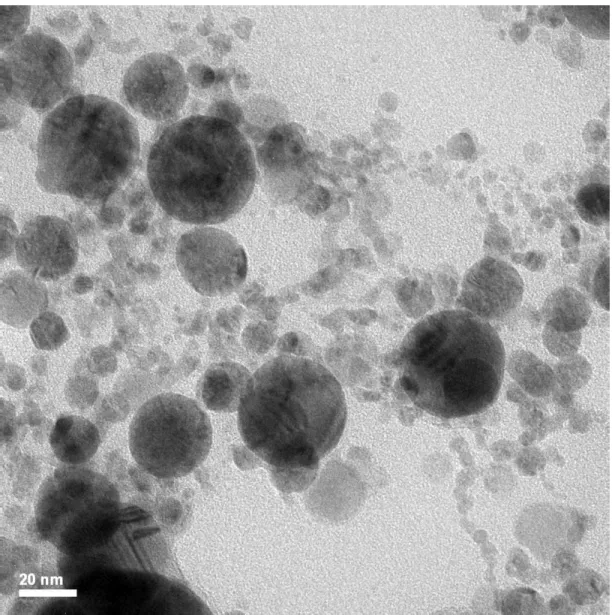
Typical TEM images of the original Pd and Ag nanoparticles are shown in Fig. 3 (a) and (b) and of the AgPd as mixed and irradiated for 2 mins in Fig. 3 (c) and (d). It is seen that the original nanoparticles are almost perfectly spherical. Size distribution histograms of the nanoparticles by counting approximately 400 nanoparticles in images of nanoparticles ensembles obtained on different areas on each grid, are shown in the insets of Fig. 3 (a) and (b) and in Fig. S2. The histograms are described quite well by log-normal functions with median diameters of
<d0>=3.8 and 3.5 nm and standard deviations of σ=0.61 and 0.45 for the Pd and Ag
nanoparticles, respectively and <d0>= 3.9, 7, 7 and 5 nm and standard deviations of σ=0.74,
0.53, 0.49 and 0.55 for the AgPd as mixed, 2, 4 and 30 mins irradiated, respectively.
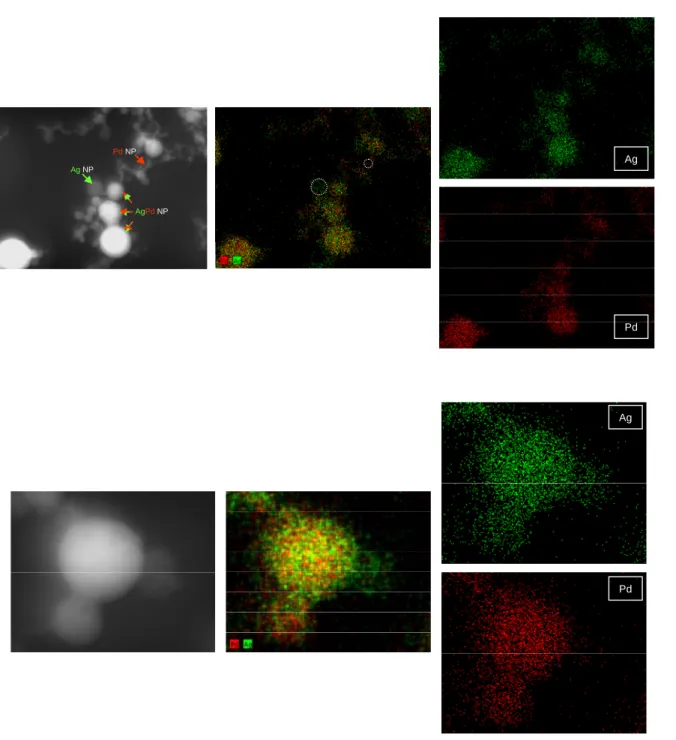
Formation of the bimetallic alloy nanoparticles upon irradiation of the mixed solution is confirmed by elemental mapping TEM images shown in Fig. 4 (and also in Figs. S3, S4 and S5). In the images of the as mixed un-irradiated nanoparticles (Fig. S3) it is seen that each nanoparticle consists of only one of the two elements, either Pd or Ag. In the irradiated solutions (Fig. 4, S4 and S5) the presence of both elements Ag and Pd is detected in the majority of the nanoparticles. There are also a few nanoparticles in the ensemble which are one of the two elements-rich or they consist of only of that element, for every irradiation time duration used. In the nanoparticles where the presence of both elements is detected, the elements appear to be distributed quite uniformly over the whole nanoparticle. While in the uniradiated sample the nanoparticles appear isolated to each other (Fig. 3 (c)), in the irradiated samples there is a large number of single element or bimetallic nanoparticles which appear joining together (Fig. 3(d), S6, S7, S8 and S9) (examples are marked with white arrows in the figures). On a few occasions more than two nanoparticles are joining together forming large globes which sometimes have irregular shape (Fig. S8 (b)).
HRTEM images are shown in Fig. 5 (and also in Fig. S10, S11 and S12). The images show a few typical combinations of joined together nanoparticles such as for instance AgPd nanoparticles joined with other AgPd and Ag-oxide nanoparticles (example are the four nanoparticles at the bottom left hand side of the image in Fig. 5), nanoparticles which consist of AgPd, Ag and Ag-oxides joined with Ag nanoparticles (example is the two large diameter nanoparticles at the bottom right hand side of the image in Fig. 5) or other material combinations. The majority of the interfaces between joined together nanoparticles (a percentage estimated to ~90% of the total number of interfaces) consist of crystalline material since lattice
fringes are also distinguished occasionally in the contact region between the nanoparticles. Typical examples are the interface between the joined together nanoparticles at the bottom left hand side of the image in Fig. 5 just above the scale bar where there are two AgPd nanoparticles joined together (marked as 2.27 Å (111) AgPd) or the interface between the joined together nanoparticles in the middle right hand side of the image in Fig. S12. In general it is concluded that the majority of the interfaces between the larger joined together nanoparticles (sizes greater than ~10 nm), which also remain spherical even after the end of the irradiation (appearing as a "neck" between the nanoparticles) (Fig. S6), consist of amorphous material while the majority of the interfaces between the smaller joined together nanoparticles, which also appear with an irregular shape after the end of the irradiation, consist of crystalline material (Fig, S11, S12).
3.4. XPS
XPS spectra from the nanoparticles on the glass substrates are shown in Fig. 6. All spectra are referenced to the C 1s line at 285 eV. The Ag 3d peaks in the as mixed sample appear at the same energies as in the Ag pure original sample (Fig. 6(a1)) (368.1 and 374.1 eV for the Ag 3d5/2
and Ag 3d3/2 orbitals, respectively). However in the irradiated samples these peaks shift to lower
binding energies and appear at: 367.6, 373.6 eV and 367.9, 374 eV for the 4 and 20 mins irradiated sample, respectively (Fig. 6(a2)). A shift of ~0.4 eV for the Ag 3d5/2 line is consistent
with measurements of core level binding energy shifts in dilute PdAg alloys reported previously [27]. Similarly the Pd 3d peaks in the as mixed sample appear at the same energies as in the Pd pure original sample (Fig. 6(b1)) (335.2 and 340.6 eV for the Pd 3d5/2 and Pd 3d3/2 orbitals,
respectively) while in the irradiated samples these peaks shift to lower binding energies and appear at: 334.7, 340 eV and 335.1, 340.5 eV for the 4 and 20 mins irradiated sample, respectively (Fig. 6(b2)) [28]. The smaller energy shift which is observed for the longer time (20 mins) irradiated sample as compared to the 4 mins one, might be because of the smaller size of
the nanoparticles of this sample (histograms in Fig. S2) due to the dependence of the binding energy on the nanoparticle's size. It has been observed that the 3d core level peaks shift to higher binding energies in nanoparticles compared to the bulk material with an amount which increases with the decrease of the nanoparticles size [29,30]. Thus the shift to lower binding energies of the peaks of the longer time irradiated sample due to alloying effect might be compensated by a shift to higher energies because of the smaller size of the nanoparticles for this sample resulting to a total shift by an amount smaller than for the shorter time irradiated sample. It might also be that a smaller number of AgPd nanoalloys lie within the escaping depth of photoelectrons which is ~1.9 and ~2.2 nm for Pd and Ag, respectively (defined as three times the electron inelastic mean free path which for 330.3 eV electrons in Pd is 6.16 Å and for 365 eV electrons in Ag is 7.15 Å). Ag is unusual in exhibiting a decreased binding energy in its low valence state relative to the pure metal [31,32] and the shifts of the Ag 3d and Pd 3d peaks to lower binding energies in the irradiated samples is due to the interaction of the two metals in the AgPd alloy in which an electron transfer occurs from Ag to the more electronegative Pd atoms. This phenomenon was explained by Abrikosov et al. in terms of an intra-atomic charge re-distribution due to valence electron hybridization [33]. It is typical of the formation of a AgPd alloy and it confirms here once again the formation of AgPd bimetallic alloys nanoparticles [24,34-36]. Note that the band at 345 eV is characteristic of the absence of hydrogen in the lattice of Pd and it indicates the formation of pure Pd nanoparticles upon ablation of the bulk target material in DI water rather than PdHx, in consistency with what has been observed previously [37].
3.4. Physical considerations of nanoparticles alloying and/or welding.
The experiment which has been performed at the present work of the laser irradiation of a mixed nanoparticles solution in order to induce alloying of the nanoparticles, based on the experimental parameters and configurations used, belongs to the subject of laser fragmentation
of nanoparticles in liquids and thus the physical mechanisms which govern the process should follow the same physical insights extracted from nanoparticles laser fragmentation experiments. According to the literature, laser induced nanoparticles fragmentation in liquids can take place via two most probable mechanisms, mainly dependent on the pulse width and laser fluence [38]: photothermal vaporization (heating-melting-vaporization) and Coulomb explosion (nanoparticle disintegration due to the build-up of electrostatic charge). In the present case of a picosecond laser irradiation at high fluence and due to the dependence of the absorbed energy and its evolved dynamics on the nanoparticle size it is more likely that both mechanisms are responsible for nanoparticles' fragmentation [39]. Coulomb explosion but excluding photothermal vaporization has also been suggested as the mechanism for fragmentation of Au nanoparticles with sizes and size distribution similar to the nanoparticles as at the present work under picosecond laser irradiation [40]. Furthermore a calculation which is based on a simple model for the energy which is absorbed by the nanoparticles from the laser irradiation (described in detail in the Supplementary Material) shows that under the present conditions of laser irradiation of the solutions, althought the energy which is absorbed by the Pd nanoparticles is enough to cause their vaporization, the energy which is absorbed by the Ag nanoparticles is not enough to cause their vaporization but only their melting. However since this model predicts a linear dependence of the absorbed energy by the nanoparticles on fluence, it is expected that the application of a high enough fluence will cause the vaporization of also the Ag nanoparticles. This in turn could indicate that the Coulomb explosion is most probable for the Ag nanoparticles than the Pd ones [39]. Therefore, formation of AgPd nanoalloys may take place via the mixing of Pd vapours originating from the vaporization of Pd nanoparticles with Ag melted nanoparticles (with temperature above the point for alloy formation). In the case of a few larger Ag nanoparticles the interaction of Pd vapours with the melted nanoparticle might be inhomogenous and happens only in certain regions of the nanoparticle mainly close to its surface and this can explain the fact that
inclusions of AgPd nanoalloys are observed in Ag/Ag-oxide nanoparticles and especially in the larger ones (and also closer to their surface) but the smaller nanoparticles are almost pure AgPd nanoalloys (Fig. 5). It may also be possible that a few Ag melted nanoparticles which are trapped in the vaporized Pd nanoparticles absorb so high energy by the vapours that eventually vaporize as well and form alloy with Pd via nucleation in the vapour phase. At the same time as the diffusion of Pd vapour takes place into them, the melted Ag nanoparticles, or even the newly formed AgPd ones, may touch each other leading to their welding and ‘nanosoldering’. This might explain the formation of joined-together nanoparticles forming also almost linear shape aggregates, which are observed in the TEM images (figures 3(d), S6, S7, and S8).
Nanoparticle aggregates consisting of melted nanoparticles could also be formed by the touching together of smaller nanoparticles ("nanodroplets") which are formed by the fission due to Coulomb explosion of the larger nanoparticles [41,42]. These nanodroplets are in the melted state since inherent to the Coulomb explosion process is an increase of the temperature of the nanoparticle to the melting point of the metal due to the transfer to the lattice (via electron-phonon coupling) of the energy of the hot electrons during relaxation simultaneously to the thermionic emission from the nanoparticle of the most energetic electrons which are at the "tail" of the Fermi distribution [38,43,44]. Coulomb explosion may take place either for the original single element nanoparticles or for the already formed bimetallic alloy nanoparticles because of their secondary irradiation by the laser beam after their formation leading to the formation of smaller nanoalloys (Fig. 5). It may also be possible that the presence of any second harmonic generation (SHG) effect from the nanoparticles (mainly non-perfectly spherical nanoparticles, nanoparticles aggregates or nanoparticles with high density of surface or structural defects) causes vaporization of also the Ag nanoparticles instead of just their melting (since the absorption cross section of the nanoparticles at λ=532 nm is by a few orders of magnitude higher than it is at the applied laser beam wavelength of λ=1064 nm) leading to nanoalloying via the
mixing of the vapours of the two metals and nucleation in the vapour phase and this might be another possible mechanism for the formation of a few small almost perfectly spherical nanoalloys (Fig. S11). However at present, due to the lack of enough experimental data the exact percentage contribution of each mechanism to the nanoalloying effect is not possible to be determined. The effect of the irradiation on each nanoparticl varies resulting in all mechanisms taking place at the same time in the process of the continuous irradiation and for all types of nanoparticles, single element or alloyed ones participating in the process with the final result that after a long enough irradiation time almost all Ag and Pd single element nanoparticles have been converted to AgPd nanoalloys as shown by the UV-vis spectrophotometry and XRD data.
4. Conclusions.
Laser irradiation of mixed single element nanoparticles colloidal solutions leads to the synthesis of bimetallic alloy nanoparticles which have the same properties with similar nanoparticles which are synthesized by other methodologies such as for instance laser ablation of bimetallic targets in liquids [9]. In addition, this might be a preferred method for the synthesis of bimetallic nanoparticles for which the bimetallic bulk target is expensive or difficult to be manufactured. However, since the method is based on the irradiation of a mixed single elements nanoparticles solution, nanoparticles which remain as single elements even after the end of the irradiation are also found in the solution contrary to the ablation of a bimetallic target where almost all nanoparticles which are produced are bimetallic. The original single-element nanoparticles were produced by laser ablation of the corresponding bulk target in water and thus the nanoparticles have bare, ligand-free surfaces which is advantageous for the investigation of laser-induced bimetallic nanoalloy formation in liquids and the method can also be used for the fabrication of higher order structures such as nanowires (by joined together nanoparticles) which may find application in different fields in nanotechnology or nanosciences. In this work
laser-induced alloying of nanoparticles of an important plasmonic metal such as Ag with nanoparticles of a non-plasmonic metal such as Pd, was demonstrated and investigated. Alloy formation clearly manifests itself with the decrease of the intensity of the SPR absorption peak of Ag with the irradiation time, a lattice constant of the irradiated nanoparticles which has a value in between those of the pure metals and a red shift of the binding energy of the Ag and Pd 3d electrons.
Aknowledgements
The QNano Project of the European Community FP7 Capacities Programme (Grant No. INFRA-2010-262163) supported part of the TEM imaging of this research.
References
[1] N. Toshima and T. Yonezawa, New J. Chem., 22, 1179 (1998).
[2] H. Wang, Y. Zhang, H. Li, B. Du, H. Ma, D. Wu and Q. Wei, Biosens. and Bioelectron., 49, 14 (2013).
[3] K. Tedsree, T. Li, S. Jones, C. W. A. Chan, K. M. K. Yu, P. A. J. Bagot, E. A. Marquis, G. D. W. Smith and S. C. E. Tsang, Nat. Nanotechn., 6, 302 (2011).
[4] F. De La Vega, E. Matzner, E. Khasin, A. Naor and A. Greenshpan, Act. Pass. Elec. Comp., 25, 181, (2002).
[5] J. Chen, B. Wiley, J. McLellan, Y. Xiong, Z. -Y. Li and Y. Xia, Nano Letters, 5, 2058 (2005).
[6] N. A. Khan, S. Shaikhutdinov and H. -J. Freund, Catal. Lett., 108, 159 (2006). [7] W. Fang, J. Yang, J. Gond and N. Zheng, Adv. Funct. Mater., 22, 842 (2012). [8] C. -C. Yang, C. -C. Wan, Y. -Y. Wang, J. Coll. Interf. Scie., 279, 433 (2004).
[9] A. Neumeister, J. Jakobi, C. Rehbock, J. Moysig and S. Barcikowski, Phys. Chem. Chem. Phys., 16, 23671 (2014).
[10] F. Mafuné, J. -y. Kohno, Y. Takeda and T. Kondow, JACS, 125, 1686 (2003). [11] P. Boyer D. Ménard and M. Meunier, J. Phys. Chem. C, 114, 13497 (2010). [12] G. C. Messina et. al., J. Phys. Chem. C, 120 (23), 12810 (2016).
[13] M. P. Navas and R. K. Soni, Plasmonics, 10, 681 (2015).
[14] N. Mottaghi, M. Ranjbar, H. Farrokhpour, M. Khoshouei, A. Khoshouei, P. Kameli, H. Salamati, M. Tabrizchi and M. J. -Nosrati, Appl. Surf. Sci., 292, 892 (2014).
[15] S. Hu, G. Goenaga C. Melton, T. A. Zawodzinski and D. Mukherjee, Appl. Catal. B: Environm., 182, 286 (2016).
[16] J. Jakobi, S. Petersen, A. Menéndez-Manjon, P. Wagener and S. Barcikowski, Langmuir, 26, 6892 (2010).
[17] J. Zhang, D. Nii Oko, S. Garbarino, R. Imbeault, M. Chaker, A. C. Tavares, D. Guay and D. Ma, J. Phys. Chem. C, 116, 13413 (2012).
[18] ASM Handbook, volume 3, Alloy Phase Diagrams; ASM International, Materials Park, OH 44073-0002, (2016).
[19] S. Besner and M. Meunier, J. Phys. Chem. C, 114, 10403 (2010).
[20] J. A. Creighton and D. G. Eadon, J. Chem. Soc. Faraday Trans., 87, 3881 (1991). [21] J. Neddersen, G. Chumanov T. M. Cotton, Appl. Spectrosc., 47, 1959 (1993). [22] L. D. Zhu, T. S. Zhao, J. B. Xu and Z. X. Liang, J. Pow Sourc., 187, 80 (2009).
[23] JCPDS No. 089-4897 (Pd); JPCDS No. 4-783 (Ag); JCPDS No. 89-3081 (AgO); JCPDS No. 40-1054 (Ag3O4); JCPDS No. 40-909 (Ag2O3).
[24] S. K. Sengar, B. R. Mehta and Govind, J. Appl. Phys., 112, 014307 (2012).
[25] M. Bonarowska, J. Pielaszek, W. Juszczyk and Z. Karpiński, J. Catal., 195, 304 (2000). [26] L. Vegard, Z. für Physik, 5, 17 (1921).
[27] P. Steiner, S. Hüfner, N. Mårtensson and B. Johansson, Solid State Comm., 37, 73 (1981). [28] P. Pervan and M. Milun, Surf. Scie., 264, 135 (1992).
[29] I. Aruna, B. R. Mehta, L. K. Malhotra and S. M. Shivaprasad, J. Appl. Phys., 104, 064308 (2008).
[30] Z. Pászti, G. Petö, Z. E. Horváth, A. Karacs and L. Guczi, Solid State Comm., 107, 329 (1998).
[31] Z. Qu, G. Ke, Y. Wang, M. Liu, T. Jiang and J. Gao, Appl. Surf. Scie., 277, 293 (2013). [32] A.-Q. Wang, J. -H. Liu, S. D. Lin, T. -S. Lin and C. -Y. Mou, J. Catal., 233, 186 (2005). [33] I. A. Abrikosov, W. Olovsson and B. Johansson, Phys. Rev. Lett., 87, 176403 (2001). [34] J. Huang, S. Vongehr, S. Tang, H. Lu and X. Meng, J. Phys. Chem. C, 114, 15005 (2010). [35] S. K. Sengar, B. R. Mehta and Govind, J. Appl. Phys., 115, 124301 (2014).
[37] N. G. Semaltianos, P. Petkov, S. Scholz and L. Guetaz, J. Coll. Interf. Scie., 402, 307 (2013).
[38] S. Hashimoto, D. Werner and T. Uwada, J. Photochem. Photobiol. C: Photochem. Reviews, 13, 28 (2012).
[39] D. Werner and S. Hashimoto, J. Phys. Chem. C, 115, 5063 (2011).
[40] F. Giammanco, E. Giorgetti, P. Marsili and A. Giusti, J. Phys. Chem. C, 114, 3354 (2010). [41] P. V. Kamat, M. Flumiani and G. V. Hartland, J. Phys. Chem. B, 102, 3123 (1998).
[42] K. Yamada, Y. Tokumoto, T. Nagata and F. Mafuné, J. Phys. Chem. B, 110, 11751 (2006). [43] F. Mafuné, J. -y. Kohno, Y. Takeda and T. Kondow, J. Phys. Chem. B, 107, 12589 (2003). [44] D. Werner, A. Furube, T. Okamoto and S. Hashimoto, J. Phys. Chem. C, 115, 8503 (2011).
Table 1. Lattice constants of the original Ag and Pd and of the alloyed Ag-Pd nanoparticles determined from the XRD patterns (Fig. 2).
sample d (Å) (111) (200) (220) (311) (222) Ag 2.359 2.042 1.444 1.232 1.179 Pd 2.241 1.941 1.374 1.172 1.122 Ag-Pd (4 mins) 2.296 1.987 1.404 1.197 1.147 Ag-Pd (20 mins) 2.293 1.980 1.403 1.198 1.147
FIGURE CAPTIONS
FIG. 1. UV-vis absorption spectra measured from the nanoparticles colloidal solutions for different irradiation times. Pd (a) and Ag (b) original nanoparticles solutions and Ag/Pd (c) mixed nanoparticles solution.
FIG. 2. XRD patterns of the nanoparticles.
FIG. 3. TEM images and corresponding size distribution histograms (inset) of the original Pd (a) and Ag (b) nanoparticles and of the as mixed (c) and 2 mins irradiated (d) samples.
FIG. 4. Elemental mapping images of the irradiated nanoparticles (2 mins). FIG. 5. HRTEM image of irradiated nanoparticles (4 mins).
(a)
(b)
(c)
2.0 1.5 1.0 0.5 0.0 ab sorban ce (arb . units) 900 800 700 600 500 400 300 200 wavelength (nm) Pd 0 min 1 min 3 min 5 min 10 min 15 min 20 min 2.0 1.5 1.0 0.5 0.0 ab sorban ce (arb . units) 900 800 700 600 500 400 300 200 wavelength (nm) Ag 0 min 1 min 3 min 5 min 10 min 15 min 20 min 1.0 0.8 0.6 0.4 0.2 0.0 absorbance (ar b. uni ts) 900 800 700 600 500 400 300 200 wavelength (nm) Ag/Pd 0 min 1 min 2 min 2.20 min 2.40 min 3 min 4 min10x103 8 6 4 2 0 in tens ity (ar b. uni ts) 90 80 70 60 50 40 30 20 2θ (°) Ag # Ag ⊗ AgO # # # # # ⊗ 90 80 70 60 50 40 30 20 2θ (°) 35x103 30 25 20 15 10 5 0 in te
nsity (arb. uni
ts) Pd × Pd × × × × × 90 80 70 60 50 40 30 20 2θ (°) 3500 3000 2500 2000 1500 1000 500 in ten sity (a rb. un its) ∗ AgPd, 4 mins # Ag Pd ⊕ Ag3O4 ∅ Ag2O3 ∅ ⊕⊕ ∗ ∗ ∗ ∗ # # # # 2500 2000 1500 1000 in ten sity (a rb. un its) ∗ AgPd, 20 mins # Ag Pd ⊗ AgO ⊕ Ag3O4 ∅ Ag2O3 ∗ ∗ ∗ ∗ ⊕ ⊗ ∅ # #
(a)
(b)
(c)
(d)
90 80 70 60 50 40 30 20 2θ (°) 3000 2500 2000 1500 1000 500 in ten sity (a rb . uni ts ) Ag-Pd, as mixed # Ag × Pd # # # # × × × ×(a)
100 80 60 40 20 0 nu mber of parti cles 80 40 0 diameter (nm) Pd <d>=3.8 nm σ=0.61(b)
80 60 40 20 0 nu mbe r of parti cle s 80 40 0 diameter (nm) Ag <d>=3.5 nm σ=0.45(c)
(d)
Pd Ag Ag NP Pd NP Ag NP Ag NP AgPdNP AgPdNP
2.38A (11-2)Ag3O4 2.40A (11-2)Ag3O4 2.35 Å (111) Ag 2.32 Å (111) Ag 2.29 Å (111) AgPd 2.30 Å (111) AgPd 2.29 Å (111) AgPd 2.26 Å (121) Ag3O4 2.32 Å (111) Ag 2.35 Å (111) Ag 2.29 Å (111) AgPd 2.10 Å (041) Ag3O4 2.27 Å (111) AgPd 1.98 Å (200) AgPd 1.75 Å (202) Ag2O3 2.27 Å (111) AgPd 2.036 Å (440) Ag2O3 2.38 Å (11-2) Ag3O4 2.27 Å (111) AgPd 2.3 Å (111) AgPd 2.36 Å (111) Ag 2.29 Å (111) AgPd
12x103 10 inte nsi ty (cps) [AgPd, 4/20 mins] 380 375 370 365 360
binding energy (eV)
7000 6500 AgPd, as mixed AgPd, 4 mins AgPd, 20 mins 40x103 35 intens ity (c ps ) [A g] 7500 7000 Ag AgPd, as mixed Ag 3d5/2 Ag 3d3/2 in te ns ity ( cp s) [A gP d, a s mi xe d]
(a1)
(a2)
10x103 9 intens ity (c ps ) [A gP d, 4/ 20 m ins ] 350 345 340 335 330binding energy (eV)
7000 6500 6000 AgPd, as mixed AgPd, 4 mins AgPd, 20 mins 7500 7000 11x103 10 intens ity (c ps ) [P d] Pd AgPd, as mixed Pd 3d5/2 Pd 3d3/2 in te ns ity ( cp s) [A gP d, a s mi xe d ]
(b1)
(b2)
Supplementary Material
Nanoparticles alloying in liquids: Laser-ablation-generated Ag or Pd nanoparticles and laser irradiation-induced AgPd nanoparticle alloying
N. G. Semaltianos1, R. Chassagnon2, V. Moutarlier3, V. Blondeau-Patissier4, M. Assoul5 and G. Monteil5
1
Aristotle University of Thessaloniki, Dept. of Physics, Thessaloniki, 54124, GREECE
2
Université Bourgogne Franche-Comté, Laboratoire Interdisciplinaire Carnot de Bourgogne, ICB UMR CNRS 6303, Dijon, F-21078, FRANCE
3
Université Bourgogne Franche-Comté, UTINAM, UMR CNRS 6213, Besançon, F-25030, FRANCE
4
Université Bourgogne Franche-Comté, Femto-st, Dépt. Temps-Fréquence, UMR CNRS 6174, Besançon, F-25030, FRANCE
5Université Bourgogne Franche-Comté, Femto-st, Dépt. Mécanique Appliquée, UMR
Energy absorbed by the nanoparticles
Considering a semiquantitative model [1,2], the energy (per unit volume) which must be absorbed by a nanoparticle to melt it, is given by the relation:
Qm =ρ
[
c(
Tm −T0)
+ΔHm]
[Eq. 1] while the energy which must be absorbed by the nanoparticle to vaporize it, is given by the relation:(
)
[
m m]
[
b m v]
m[
b m v]
v cT T H c T T H Q c T T H
Q =ρ − 0 +Δ +ρl l( − )+Δ = +ρl l( − )+Δ [Eq. 2] In the above equations ρ, c and ρl, c are the density and specific heat of the solid and liquid l
material, respectively. T , m T , b ΔHm and ΔHvare the melting temperature, boiling temperature, heat of fusion and heat of vaporization of the material, respectively and
16 . 293
0 =
T K.
Considering the set of parameters, for Ag: ρAg =10.49 g/cm3, cAg =0.233 J/g.K,
32 . 9 = Ag l ρ g/cm3, 310cAg =0. l J/g.K, =1235 Ag m T K, Ag =2435 b T K, Δ Ag =111 m H J/g and 2356 = Δ Ag v H J/g, and for Pd: ρPd =12.02 g/cm3, 240 . 0 = Pd c J/g.K, ρlPd =10.38 g/cm3, 282 . 0 = Pd cl J/g.K, TmPd =1828 K, TbPd =3236 K, ΔHmPd =159.6 J/g and ΔHvPd =3364 J/g the melting and vaporization energies are determined as: QmAg =3466.2×106 J/m3,
6 10 4 . 28891 × = Ag v Q J/m3 and Pd =6347.8×106 m Q J/m3, Pd =45386×106 v Q J/m3. Considering also the minimum temperature of Ag for the formation of a 50:50 wt % alloy with Pd, of
1573
)
(Pd ≅
Ag m
T K according to the phase diagram of the AgPd alloy [3], the corresponding energy is determined as: QmAg(Pd) ≅4292.9×106J/m3. The heat loss to the water via radiation, convection or conduction was neglected due to the small emissivity of the nanoparticle metals and the short pulse width.
) ( ) ( ) ( d V d FC d Q abs abs = [Eq. 3]
where F[J/cm2] is the laser fluence, 3
6 )
(d d
V =π is the volume of the nanoparticle with
diameter d and Cabs(d) is the absorption cross section of the nanoparticle (in m2). The
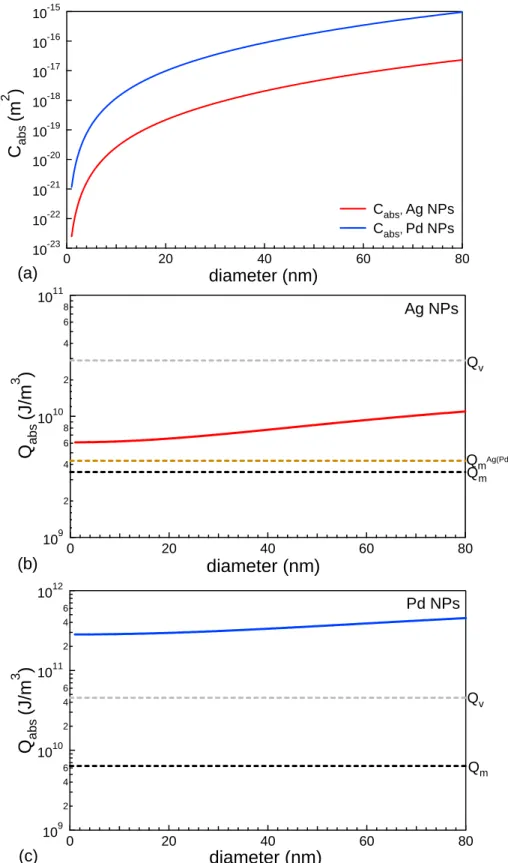
absorption cross section versus nanoparticles size was calculated based on the Mie theory for light absorption and scattering by metal clusters, assuming spherical nanoparticles [4,5] (Fig. S1(a)). The presence of AgO was ignored since its concentration is very low, determined equal to 3.9 wt% from Rietveld fitting of the XRD pattern of Ag nanoparticles. The energy absorbed by the nanoparticles is calculated and the results are plotted in Fig. S1(b) and (c)
(F =12.7J/cm2).
By considering the characteristic relaxation time for the formation of a quasi-stationary temperature profile inside the nanoparticle: τr ≈d2 4α, where αis the thermal diffusivity of the metal, for Ag: αAg =165.6×10⁻⁶ m2/s and for Pd: αPd =24.5×10⁻⁶ m2/s, then for example for nanoparticles with d=10 nm it is: τAg ≈0.21 ps and τPd ≈1.46 ps. These times
are much shorter than the pulse width (τp =10ps) and the time interval between two subsequent pulses (equal to 107 ps considering the pulse repetition rate of 100 kHz).
By considering the non-linear absorption coefficient of aggregated Ag nanoparticles colloidal solutions (no non-linear absorption was detected from non-aggregated solutions) measured under conditions of laser irradiation similar to the ones as at the present work (1064 nm, 35 ps, 4×10¹¹ W/cm2) but with a higher concentration, as: βAg ≈ 3.8×10⁻¹¹ cm/W [6] we can get an indication of the energy which is absorbed here by the nanoparticles via non-linear processes as: Ag NL = p ≈
abs I
Q ( ) β 2τ 6.1×10⁸
109 2 4 6 8 1010 2 4 6 8 1011
Q
ab s(J/m
3)
80 60 40 20 0diameter (nm)
Qv Qm Ag NPs QmAg(Pd) (b) (a) 10-23 10-22 10-21 10-20 10-19 10-18 10-17 10-16 10-15 C abs (m 2 ) 80 60 40 20 0 diameter (nm) Cabs, Ag NPs Cabs, Pd NPs 109 2 4 6 1010 2 4 6 1011 2 4 6 1012Q
ab s(J/m
3)
80 60 40 20 0diameter (nm)
Pd NPs Qv Qm (c)Fig. S1. Calculated absorption cross section (a) and energy which is absorbed by the nanoparticles (b) and (c).
Ag Pd
80
60
40
20
0
num
ber of particles
100
80
60
40
20
0
diameter (nm)
AgPd 2 mins <d>=7 nm σ=0.53120
80
40
0
num
ber of particles
100
80
60
40
20
0
diameter (nm)
AgPd 4 mins <d>=7 nm σ=0.49160
120
80
40
0
num
ber of particles
100
80
60
40
20
0
diameter (nm)
AgPd 30 mins <d>=5 nm σ=0.55 (a) (b) (c) (d)120
80
40
0
number of particles
100
80
60
40
20
0
diameter (nm)
Ag-Pd as mixed <d>=3.9 nm σ=0.74Fig. S3. Elemental mapping images of the unirradiated nanoparticles.
Ag
Fig. S4. Elemental mapping images of the irradiated nanoparticles (4 mins) Ag
Ag Pd Ag Pd AgNP PdNP AgPdNP
Fig. S7. TEM image showing regions on the grid where atom clusters are observed, marked by black arrows (2 mins irradiated).
(b) (a)
2.30 Å (111) AgPd 2.27 Å (111) AgPd 2.01 Å (440) Ag2O3 2.30 Å (111) AgPd 2.044 Å (200) Ag 1.98 Å (200) AgPd 1.98 Å (200) AgPd 1.97 Å (620) Ag2O3
Fig. S10. HRTEM image of irradiated nanoparticles (4 mins) showing almost pure AgPd nanoparticles joined together and also with a Ag or Ag-oxide nanoparticles.
2.30 Å (111) AgPd 2.06 Å (511) Ag2O3 2.36 Å (111) Ag 2.26 Å (121) Ag3O4 2.33 Å (022) Ag3O4 2.18 Å (331) Ag2O3 2.37 Å (111) Ag
Fig. S11. HRTEM image of irradiated nanoparticles (4 mins) showing a small AgPd bimetallic alloy nanoparticle joined together with an irregular shape globe consisting of Ag/Ag-oxides.
Fig. S12. HRTEM image of irradiated nanoparticles (4 mins) showing lattice fringes at the interfaces between the nanoparticles.
References
[1] S. Besner, A. V. Kabashin, F. M. Winnik and M. Meunier, J. Phys. Chem. C, 113, 9526 (2009).
[2] J. Yang, T. Ling, W. -T. Wu, H. Liu, M. - R. Gao, C. Ling, L. Li and X. -W. Du, Nature Comm., doi: 10.1038/ncomms2637.
[3] ASM Handbook, volume 3, Alloy Phase Diagrams; ASM International, Materials Park, OH 44073-0002, (2016).
[4] G. Mie, Ann. Phys., 25, 377 (1908).
[5] S. Hashimoto, D. Werner and T. Uwada, J. Photochem. Photobiol. C: Photochem. Reviews, 13, 28 (2012).
[6] R. A. Ganeev, A. I. Ryasnyansky, Sh. R. Kamalov, M. K. Kodirov and T. Usmanov, J. Phys. D: Appl. Phys., 34, 1602 (2001).