HAL Id: hal-00318389
https://hal.archives-ouvertes.fr/hal-00318389
Submitted on 2 Oct 2007
HAL is a multi-disciplinary open access
archive for the deposit and dissemination of
sci-entific research documents, whether they are
pub-lished or not. The documents may come from
teaching and research institutions in France or
abroad, or from public or private research centers.
L’archive ouverte pluridisciplinaire HAL, est
destinée au dépôt et à la diffusion de documents
scientifiques de niveau recherche, publiés ou non,
émanant des établissements d’enseignement et de
recherche français ou étrangers, des laboratoires
publics ou privés.
versus solar and interplanetary parameters
R. P. Kane
To cite this version:
R. P. Kane. Hysteresis loops of Cosmic Ray intensity decreases versus solar and interplanetary
param-eters. Annales Geophysicae, European Geosciences Union, 2007, 25 (9), pp.2087-2097. �hal-00318389�
Ann. Geophys., 25, 2087–2097, 2007 www.ann-geophys.net/25/2087/2007/ © European Geosciences Union 2007
Annales
Geophysicae
Hysteresis loops of Cosmic Ray intensity decreases versus solar and
interplanetary parameters
R. P. Kane
Instituto Nacional de Pesquisas Espaciais – INPE, Caixa Postal 515, 12245-970, S˜ao Jos´e dos Campos, SP, Brazil Received: 29 March 2007 – Revised: 11 September 2007 – Accepted: 14 September 2007 – Published: 2 October 2007
Abstract. The purpose of this study was to examine the
cor-relation between CR (Cosmic Ray) intensity and solar, inter-planetary and terrestrial parameters. The hysteresis loops of (CR) versus those of several solar parameters showed narrow loops in even cycles 20, 22 and broad loops in odd cycles 19, 21, as also in the recent odd cycle 23. Hysteresis plots for CR versus interplanetary number density N and speed V were erratic and uncertain (broad and narrow, all mixed up). Plots of CR versus Interplanetary magnetic field (IMF)
Bseemed to be narrow for even as well as odd cycles. Hys-teresis loops between CR and other interplanetary parameters were not clear-cut. The same was true for terrestrial parame-ters. During sunspot maximum years 2000–2003 of cycle 23, there is a double peak structure in all parameters. Whereas CR have a peak spacing of ∼30 months, sunspots and Tilt angle have a spacing of only ∼20 months. The solar open magnetic flux and the Voyager 1 magnetic field have a spac-ing of ∼25 months. The solar polar magnetic field reverses later than the first peak of all parameters and hence, could not be a direct cause (as if effect started before the cause and lasted for several months more after the cause disappeared). It seems that CR modulation is mainly guided by magnetic configurations deep in the heliosphere, which may not have a simple relationship with parameters near Earth or near Sun.
Keywords. Interplanetary physics (Cosmic rays; He-liopause and solar wind termination; Interplanetary magnetic fields)
1 Introduction
Cosmic ray (CR) intensity shows variations on several time scales. Forbush decreases occur in a matter of days. Then, there are 27-day variations. On a longer time scale, there
Correspondence to: R. P. Kane
is a year-to-year variation almost anti-parallel to the 11-year sunspot cycle, but with differences in the even and odd cy-cles (22-year modulation). The CR modulation starts with a delay with respect to sunspots and the delay is larger in odd cycles (19, 21) as compared to the delay in even cy-cles (20, 22). The mechanism for CR modulation consists of time-dependent heliospheric drifts and outward propagat-ing diffusive barriers, which are formed by mergpropagat-ing of coro-nal mass ejections (CMEs), shocks and high-speed flows at 10–15 AU from the Sun (Merged Interaction Regions, MIRs; Burlaga et al., 1985). Since only some MIRs are effective in modulating CRs throughout the heliosphere (Burlaga et al., 1993), Global MIR (GMIR) were conceived which are re-gions extending 360◦around the Sun mostly in the ecliptic
plane and responsible for the step-like changes in CR count-ing rates. The convection-diffusion mechanism is indepen-dent of the sign of the solar magnetic field and operates sim-ilarly in every 11-year sunspot cycle (Dorman, 1959; Parker, 1963, and others). On the other hand, the drift mechanism gives opposite effects with the changing sign of the solar magnetic field in alternate cycles (Jokipii and Davila, 1981; Jokipii and Thomas, 1981; Lee and Fisk, 1981; Potgieter and Moraal, 1985, and many other further papers). At the sunspot maximum of odd cycles, the solar north-polar magnetic field reverses, from outward directed (A>0) to inward directed (A<0) during an interval of a few months. A few months later, the solar south-polar magnetic field also reverses, from inward directed (A<0) to outward directed (A>0) during an interval of a few months. In even cycles, the opposite occurs. In A>0 epochs, the inflows of CR into the inner heliosphere are faster from over the poles than from along the helio-spheric current. When A<0, the opposite occurs (Wibberenz et al., 2002). Cane et al. (1999) have reported a very good anti-correlation between CR changes and interplanetary total magnetic field B for two consecutive cycles 21 and 22, and a very close relationship between CR and Tilt angles (latitudi-nal extent of the heliospheric current sheet HCS, Hoeksema,
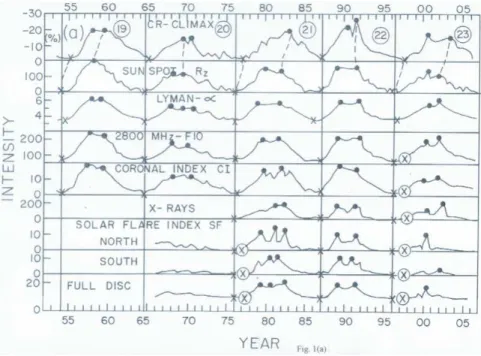
Fig. 1a. Plots of 3-monthly values of solar parameters.for cycles 19–23 (1954–2006). Ordinate (intensity) scale is arbitrary, adjusted to
economize the available space. Top plot: CR (Cl´ımax neutron monitor) counting rates as percentage deviations from a 100% level, plotted upside down. Prominent maxima are marked with big dots and minima with crosses. Further plots are for several solar parameters, namely, sunspot number Rz (vertical lines mark sunspot m´ınima of the various cycles), Lyman-α, 2800 MHz (10.7 cm) solar radio emission F10, coronal green line emission index (CI), X-ray background intensity, Solar Flare Index SF for the Northern (N) and Southern (S) Hemispheres of the Sun and for their sum N+S.
1995; http://wso.stanford.edu/Tilts.html) of the wavy current sheet in the heliosphere, which has been claimed to be very successful as a proxy for solar activity in cosmic ray mod-ulation models with particle drifts included. (Ferreira and Potgieter, 2002). It may be noted that the HCS tilt angle is considered to be a good proxy of solar activity in even cy-cles during low to moderate modulation conditions (tilt an-gles below 35–40◦), while for higher solar activity and for
odd cycles, the tilt angle dependence is not so clear. Also, there are two methods to define the HCS tilt angle, the radial model and the average Lav. Here we have used Lav.
The delays (different in odd and even cycles) are displayed in hysteresis plots of CR versus sunspots, where the hys-teresis loops are broad in odd cycles and narrow in even cy-cles (Dorman, 2001; Dorman et al., 2001a, b, and references therein). Presently, cycle 23 is coming to its end, and it would be of interest to check whether the hysteresis loop was broad in this odd cycle 23.
In the present communication, the hysteresis plots are shown for CR versus sunspots as also versus some other so-lar parameters, and further for CR versus interplanetary and terrestrial parameters.
2 Plots
Solar data have been obtained from the NOAA website http: //www.ngdc.noaa.gov/stp/SOLAR/solintro.html and other data from the website http://cdaw.gsfc.nasa.gov/geomag cdaw/Data.html. Figures 1a, b, c show the plots of 3-monthly values of several parameters for cycles 19–23 (1953–2006). (The ordinate intensity units are arbitrary, set to use the space economically). In Fig. 1a, the top plot is for CR (Cl´ımax neu-tron monitor) counting rates as percentage deviations from a 100% level, plotted upside down so that CR maximum de-pressions match with sunspot maxima. Prominent maxima are marked with big dots and minima with crosses. If there is a prominent maximum and another maximum of almost the same magnitude, both (or even three) are shown with big dots (this is, of course, highly subjective, and opinions may differ). The next plot is for sunspot number (vertical lines mark sunspot m´ınima of the various cycles). As can be seen, in odd cycles 19, 21, 23, the CR maxima and minima oc-cur with a substantial delay with respect to the sunspot max-ima and minmax-ima (shown by the inclined dashed lines join-ing the CR plot to the Rz plot). Further plots are for solar Lyman-α (121.6 nm, a chromospheric emission, Woods et al., 2000, updated), 2800 MHz (10.7 cm) solar radio emis-sion F10 (origin mostly in lower corona), the coronal green line (530.3 nm) emission index CI (Rybansky et al., 2005) and X-ray background intensity (mostly in the corona). In
R. P. Kane: Cosmic Ray intensity decreases versus solar, interplanetary and terrestrial parameters 2089
Fig. 1b. Top plot: CR (Cl´ımax neutron monitor, repeated). Further plots are for open magnetic field fluxes, for low and high solar latitudes.
Fig. 1c. Top plot: CR (Cl´ımax neutron monitor, repeated). Further plots are for interplanetary parameters, namely, number density N ,
solar wind speed V and total magnetic field B, Tilt angles (crosses), CMEs and ICMEs, HSPS (high-speed plasma streams), and terrestrial parameters, namely, occurrence frequency of Storm Sudden Commencement events, occurrence frequency of the geomagnetic disturbance index Dstevents of negative magnitudes exceeding 50 nT, and the average 3-monthly magnitudes of Dst.
cycle 19, one can see two CR peaks, only one sunspot peak, two Lyman-α peaks, two 2800 MHz radio emission peaks and two peaks in the coronal index. In cycle 20, one can see two peaks in CR and sunspots, possibly three peaks in Lyman-α, and two peaks each in 2800 MHz and coronal
index. In cycle 21, there is only one strong peak in CR, but two peaks in the solar radiations. In cycle 22 and 23, there are two maxima in all these parameters. In general, solar parameters show variations almost similar to those of sunspots (matching within a few months), including the two
prominent maxima near sunspot maximum. Further plots are for the Solar Flare Index SF (Atac and Ozguc, 1998, up-dated) for the Northern (N) and Southern (S) Hemispheres of the Sun and for their sum N+S. These plots are somewhat different from the plots of sunspots, notably the structure at sunspot maximum.
The solar photosphere has substantial magnetic field struc-tures. These are mostly closed, but sometimes, there are open magnetic regions (coronal holes) on the Sun, which trans-mit magnetic fields to the interplanetary space (Wang et al., 2000; Wang and Sheeley, 2002). Figure 1b shows the plots for CR intensity (repeated) and for the open magnetic fields. The top plot for CR (Cl´ımax neutron monitor) counting rates is the same as in Fig. 1a. Further plots are for the open mag-netic fields. Three plots are shown, for low solar latitudes North N (+) and South S (–) (0 to +45◦, 0 to −45◦and their
sum +45◦to −45◦). These have variations almost similar to
sunspot activity (discussed in detail in Kane, 2006a), with slight differences for the maxima. Next three plots are for high solar latitudes North N (+) and South S (−) (+90◦ to
+45◦, −90◦ to −45◦ and their sum (N+S high latitude 45◦
to 90◦). Here, the variations are quite different, almost
anti-parallel to sunspot activity; the maxima are during sunspot minimum (vertical lines). Thus, the solar open magnetic flux leaving the solar atmosphere has very different characteris-tics at low and high solar latitudes.
Figure 1c shows plots for CR intensity (repeated) and in-terplanetary parameters, namely, number density N (mostly protons), solar wind speed V and total magnetic field B (daily values of Bx, By, Bzused for calculating daily B, used
further for obtaining average 3-monthly B), for cycles 20– 23 (no data for cycle 19). Here, the number density N shows variations unrelated to sunspot activity; maxima appear irreg-ularly, at different phases of sunspot activity. The solar wind speed V shows maxima mostly during the declining phases of sunspot activity. The total magnetic field B is very low throughout cycle 20, but for cycles 21–23, B shows maxima similar to the sunspot numbers. The crosses show a plot of the Tilt angles for cycles 21, 22, 23 and the plot is very simi-lar to the plots of sunspots.
Some data about CME, obtained from various sources, are also plotted. Cane et al. (1996) compiled a list of ICMEs (Interplanetary CMEs near the Earth) which caused CR de-creases exceeding 4%, during 1966–1996 (cycles 20–22). Thus, the plot (CANE ICME) is only for a part of the to-tal ICMEs near Earth. The variation is roughly parallel to sunspots, but statistics seems poor. For cycle 23 (1996 on-wards), I. G. Richardson (private communication, 2006) pro-vided us a total ICME list (from satellite data). The variation is roughly parallel to sunspots. Maris and Maris (2003) pro-vided a list of HSPS (high-speed plasma streams) for 1966– 1996 (cycles 20–22). The maxima seem to occur in the declining phase of sunspot activity, probably because high-speed corotating streams occur more during the declining phases. For cycle 23, CME frequency (crosses in the third
plot from bottom in the last column) was available from the SOHO LASCO CME catalogue (http://cdaw.gsfc.nasa. gov/CME list/). These show variations roughly parallel to sunspots.
Some terrestrial parameters can be used as indicators of interplanetary disturbances. Three parameters are plotted in Fig. 1c, bottom part, for cycles 19–23. These are, the Oc-currence frequency of Storm Sudden Commencement (SSC) events, the Occurrence frequency of the geomagnetic distur-bance index Dst events of negative magnitudes exceeding
50 nT, and the average 3-monthly magnitudes of Dst. All
these show variations roughly parallel to sunspots.
Since in odd cycles, there is considerable delay in the com-mencement of CR modulation, it would be interesting to see which parameters have minima coinciding with sunspots and which show delays similar to those of CR. For the odd cy-cle 19 where CR lagged considerably behind sunspots Rz (the tilted dashed line joining the two in Fig. 1a),
Lyman-α, 2800 MHz, coronal index show m´ınima matching with sunspots. For the even cycle 20, CR lags were almost nil and the parameters Lyman-α, 2800 MHz, coronal index as well as the terrestrial parameters had minima coinciding with sunspots (and with CR also). For the odd cycle 21, CR had a considerable lag with respect to sunspots (the tilted dashed line joining the two), while Lyman-α, 2800 MHz, coronal index, and X-rays had minima coinciding with sunspot mini-mum (no lags, all at the vertical line). On the other hand, the solar flare index (Fig. 1a) and the solar open magnetic flux at low solar latitude (Fig. 1b) show lags (increases starting fur-ther away from the vertical line) so that the minima coincide with CR (marked as encircled crosses). The SSC counts and
Dst (Fig. 1c) also show similar lags, but the IMF B does not
show the lag. This is surprising as the lags are considered as indicative of effective regions taking time to reach deep into the heliosphere. How then parameters near the Sun (open magnetic flux) or even near the Earth (1 AU, Dst etc.) show
a lag? For the even cycle 22, CR showed no lags. All other parameters also had no lags (minima coincided with sunspot minima). For the odd cycle 23, CR lagged considerably be-hind sunspots. However, many other parameters also show lags (circled crosses, away from the vertical line of sunspot minimum). Thus, the interpretation of lags as delays due to effective regions taking time to reach deep in the heliosphere needs reconsideration and further scrutiny.
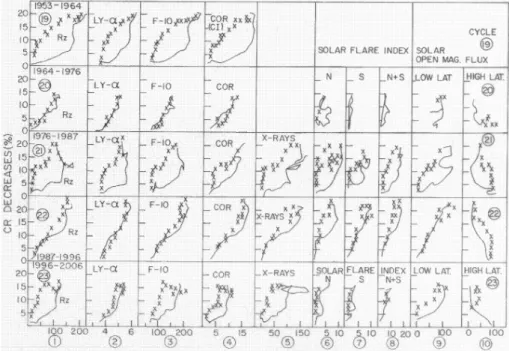
Figure 2 shows the hysteresis plots for CR versus sunspot number Rz (at the photosphere) in the first column, for the five successive cycles 19 (1953–1964), 20 (1964–1976), 21 (1976–1987), 22 (1987–1996) and 23 (1996–2006). The full lines are for the rising phase of the solar cycle and the crosses for the declining phase. As can be seen, the hysteresis loops are broad in the odd cycles 19, 21 and 23 and narrow in the even cycles 20 and 22. Thus, for sunspots, cycle 23 has conformed to the general pattern of broad odd cycles. The second column is for solar Lyman-α. Here, the patterns are similar to those for sunspots, except that for cycle 23,
R. P. Kane: Cosmic Ray intensity decreases versus solar, interplanetary and terrestrial parameters 2091
Fig. 2. Hysteresis plots of Cosmic Ray (CR) intensity (ordinate in percent, 3-monthly values) versus several solar parameters (abscissa),
columns 1–10. The abscissa scale is arbitrary, adjusted to suite the available space. The full lines are for the rising part of the solar cycle and the crosses for the declining part.
the pattern is not very broad (reason not known). The third column refers to the 2800 MHz (10.7 cm) solar radio emis-sion F10. The patterns are very similar to those of sunspots. The fourth column refers to the coronal green line emission and shows patterns almost similar to those of sunspots and F10. Thus, for solar parameters originating in a wide range of solar altitudes, the hysteresis patterns are mostly similar, though small differences exist. The fifth column refers to X-ray background intensity (for cycles 21, 22 and 23 only), and the patterns conform roughly to broad hysteresis loops in the odd cycles 21, 23 and narrow loops in the even cycle 22. The sixth and seventh columns are for the Solar Flare Index SF for the Northern (N) and Southern (S) Hemispheres of the Sun. For cycle 20, the data for SF (N) show a broad loop and data for (S) show a narrow loop (the sum N+S in the eighth column shows a narrow loop), but the data quality is suspect. For cycle 21, the loops are broad as expected for an odd cycle. For cycle 22, the loop for N is broad (even cycle, not expected); but the loops for S and N+S are narrow (ex-pected). However, for cycle 23, all N, S, and N+S loops are narrow (odd cycle, not expected). Thus, the hysteresis pat-terns of the solar flare index (coronal phenomenon) did not always conform to expected patterns, probably because solar flares are transient phenomena with irregular occurrences.
The ninth column shows hysteresis loops for solar open magnetic field flux for low solar latitudes (+45◦ to −45◦),
which are known to have a 11-year variation parallel to sunspot activity (discussed in Kane, 2006a). Data for cy-cle 20 are incomplete (data available only for the declining
phase), but for cycle 21 and 23, the loops are broad and for cycle 22, the loop is narrow, as expected. Thus, the low lat-itude solar magnetic open flux has hysteresis effects similar to those of other solar parameters. The tenth column refers to solar open magnetic flux at high solar latitudes (45◦to 90◦,
N and S). These fluxes are known to show a 11-year variation anti-parallel to sunspot activity (Kane, 2006a). The loop for cycle 20 is incomplete, that for cycle 21 is broad (expected), that for cycle 22 is not very narrow, and that for cycle 23 is not broad (unexpected). Thus, magnetic flux leaving the so-lar atmosphere at low latitudes conforms to the general pat-tern, but the flux leaving the high solar latitudes (including polar regions) may have different characteristics.
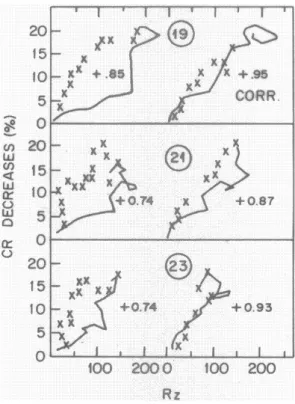
The broad hysteresis loops in the odd cycles 19, 21, 23 and narrow loops in cycles 20, 22 could be due to fixed de-lays (different for every cycle) or due to different evolutions of CR and sunspots at every sunspot phase, or both. To eval-uate the average delays, a cross-correlation analysis was car-ried out between CR and sunspots (with delays in units of 3, 6,. . . 30 months) separately for all cycles 19–23. Figure 3 shows the results. The best correlations are obtained at av-erage delays of 9 months, 3 months, 9 months, 3 months and 15 months for the five cycles 19–23 (since values used are 3-monthly, results are only as multiples of 3). If the CR values are shifted earlier (or sunspot values are shifted later) by these numbers, the hysteresis loops change as shown in Fig. 4 for the odd cycles 19, 21 and 23 only, where delays were large. The full lines are for the rising phase of the solar cycle and the crosses for the declining phase. The left half
Fig. 3. Cross-correlation between CR and Rz for cycles 19–23.
Ab-scissa shows phase difference in 3-month units.
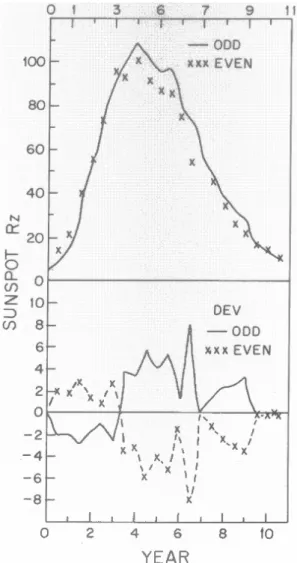
shows the original loops and the right half shows the loops for shifted data. The broad loops become narrow as expected, but some broadening remains. To check whether the solar parameters themselves have a different evolution in odd and even cycles, the long data series of sunspots (∼250 years, cy-cles 1–23) were superposed for about 11 consecutive years, for successive odd (1, 3,. . . .23) and even (2, 4. . . .22) cy-cles separately, with the first, starting year being the year of sunspot minimum. The results are shown in Fig. 5. The upper part shows the average sunspot cycle for odd cycles 1, 3,. . . .23 (full line) and even cycles 2, 4,. . . .22) (crosses) There is slight difference between the two. The lower part shows the deviations from a mean of all cycles (cycles 1–23, mean not shown here) for odd cycles (full line) and even cy-cles (crosses). It seems that for odd cycy-cles, there is a slight excess of sunspot number in the ascending phase (years 0– 7), while for even cycles, there is a deficit; but the effect is
Fig. 4. Hysteresis loops for CR (ordinate in percent) versus Rz, left
half, direct data (original loop), right half CR values advanced for the estimated delays. The full lines are for the rising part of the solar cycle and the crosses for the declining part.
small, nothing like the behaviour of CR, which is strikingly different in odd and even cycles. In principle, the hystere-sis loops of CR versus Rz may be affected by two features, firstly, a delay between the starts and secondly, a difference in the evolution of Rz in odd and even cycles. The magnitude is ∼8 sunspot number, a difference of ∼16 sunspot numbers (∼16%) between odd and even cycles. The CR hysteresis of cycle 21 (Fig. 4, left half) shows CR differences of ∼10%. Thus, the two may be related partially.
For the interplanetary space, Fig. 6 shows the hysteresis plots of CR versus interplanetary parameters, N , V , B. The full lines are for the rising phase of the solar cycle and the crosses for the declining phase. For N in the first column, the loops are erratic, with no clear relationships with odd or even cycles. The same is true for V in the second column. For B, Cane et al. (1999) have reported a very good anti-correlation between CR changes and B for two consecutive cycles 21 and 22, and a very close relationship between CR and Tilt angles of the wavy current sheet in the heliosphere (heliospheric current sheet HCS, data from J. T. Hoeksema, http://wso.stanford.edu/Tilts.html), which has been claimed to be very successful as a proxy for solar activity in cosmic ray modulation models with particle drifts included (Ferreira and Potgieter, 2002). Cane et al. (1999) have shown hys-teresis plots of CR versus the Tilt angle. These show broad
R. P. Kane: Cosmic Ray intensity decreases versus solar, interplanetary and terrestrial parameters 2093
Fig. 5. Upper half, Average sunspot cycles for odd cycles 1, 3. . . .23
(full lines) and even cycles 2, 4. . . .22 (crosses). Lower half, devia-tions of odd and even cycles from the general average of cycles 1, 2, 3. . . .23.
loops in both cycles 21 and 22, but a very good relationship is claimed. In Fig. 6, the third column shows the hysteresis plots for CR versus IMF (interplanetary magnetic field) total component B. The loops are partly broad and partly narrow in all the cycles 20–23, indicating a somewhat loose relation-ship between CR and B. The fourth column shows the hys-teresis loops for CR versus Tilt angle. The loops are broad in odd cycles 21 and 23 and narrow in the even cycle 22, simi-lar to the loops of CR versus sunspots in Fig. 2, first column. Thus, the Tilt angles have a variation very much parallel to sunspots. The correlations are: Rz to Tilt angle +0.85, Rz to CR +0.79, CR to Tilt angle +0.70. The B component has correlations of +0.60 with Tilt angle and Rz, and +0.70 with CR. Thus, relationship with B is not fully satisfactory.
Figure 7 shows the hysteresis loops for CR versus ICMEs in the first column. The full lines are for the rising phase of
Fig. 6. Hysteresis plots of Cosmic Ray (CR) intensity (ordinate in
percent, 3-monthly values) versus interplanetary parameters N , V ,
Band Tilt angle (abscissa, scale arbitrary, adjusted to suite available space).
Fig. 7. Hysteresis plots of Cosmic Ray (CR) intensity (ordinate
in percent, 3-monthly values) versus CMEs, ICMEs, HSPS, SSC count and Dst occurrence frequencies and magnitudes. The full
lines are for the rising part of the solar cycle and the crosses for the declining part.
the solar cycle and the crosses for the declining phase. Loops are broad in odd cycles 21 and 23, but not very narrow in
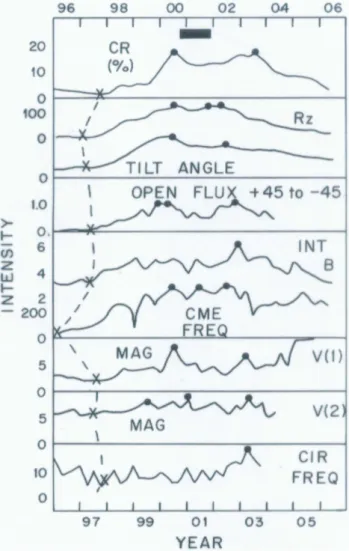
Fig. 8. Plots of 3-monthly values for cycle 23 (1996–2006, ordinate
in percent for CR, intensity units arbitrary for others). Maxima are marked with big full dots. Minima during 1996–1997 are marked with crosses. The full rectangle at the top shows the reversal of solar polar magnetic field.
even cycles 20 and 22, partly because the data for ICMEs are scanty (poor statistics). The second column refers to CR ver-sus HSPS (high-speed plasma streams). The plots are erratic with not very broad loops in any cycle. Thus, relationship is obscure. The third column refers to SSC occurrence fre-quency. Here, there is some indication that loops in even cycles 20, 22 are narrower as compared to loops in the odd cycles 19, 21, 23. Thus, SSC patterns are more like sunspots. The fourth and fifth columns refer to Dst frequencies and
magnitudes and do not show any consistent patterns for odd or even cycles. In short, all these terrestrial effects do not have any consistent patterns distinctly different for odd and even cycles.
Figure 8 shows the plots for cycle 23 for some parameters. 1. The top plot is for CR deviations (upside down) and shows two prominent peaks (actually prominent
depres-sions, large modulation), one in the middle of 2000 and another in the middle of 2003. The gap between these two peaks is of ∼30 months. The full rectangle at the top shows the reversals of solar polar magnetic fields, in about November 2000 at the north pole and about Octo-ber 2001 at the south pole (an interval of about one year, Harvey and Resley, 2002). The CR peak occurs earlier than the commencement of magnetic field reversal by several months. So, the reversal could not be a cause of CR changes (effect must follow the cause, not precede it).
2. The next plot for sunspots Rz shows one prominent peak in the middle of 2000 (almost matching with CR) and two subsidiary maxima in the end of 2001, almost a year and a half earlier than the second maximum of CR. The Rz gap (Gnevyshev gap) is only of ∼20 months, much lesser than the CR gap of ∼30 months. These dis-crepancies are discussed in detail in Kane (2006b), and some striking features of cycle 23 are discussed in Kane (2006c). The CR modulation started a few (15) months later than solar minimum (see the dashed inclined line joining CR and Rz in Fig. 1a), indicating a delay of so-lar effects to reach the mid-heliosphere, though sunspots themselves (and other indices like radio noise, Lyman α etc.) do not transmit anything to interplanetary space and hence are, in principle, irrelevant for CR modula-tion, which occurs in deep heliosphere.
3. The next plot is for Tilt angles and is almost similar to
Rz, except that the second maximum is not very
promi-nent. Physically, tilt angle is in the interplanetary space and hence, certainly relevant for CR modulation, but the spacing here is only ∼20 months (just like that for Rz), and much smaller than the CR spacing (30 months). In-cidentally, the first peak of the Tilt angle is almost co-incident with (only slightly earlier than) the first peak of CR. So, the lag of several months seen at the starting of CR modulation vis-a-vis sunspot minimum (start of cycle 23) is not seen so much for the first CR peak and Tilt angle peak. So to say, the lag is lost from sunspot minimum to sunspot maximum.
4. The next plot for magnetic open flux (low solar lati-tudes) has three peaks, two in the beginning of 2000, a few months earlier than the peaks in Rz and CR and a third one in 2002 end, later than the second Rz max-imum but earlier than the CR second maxmax-imum by al-most one year. The spacing for the open flux is ∼25 months, smaller than the 30 months for CR, but stretch-ing the imagination a bit, one could claim that the open flux could be considered as responsible for a delayed effect for CR modulation.
5. The next plot for IMF B shows only one prominent peak at the end of 2002, a few months earlier than the second
R. P. Kane: Cosmic Ray intensity decreases versus solar, interplanetary and terrestrial parameters 2095 CR peak, and there is no similarity between variations
of B and CR. The next plot of CME frequency shows three peaks, one in the middle of 2000 (same as CR, Rz and open flux), a second in the middle of 2001, and a third in the middle of 2002, roughly similar to Rz and Tilt angle in spacing etc. The CMEs are an important part of interplanetary space and would affect CR modu-lation, but the spacing of only 15–20 months is smaller than the CR spacing of 30 months.
6. The next plots are for the magnetic fields at Voyager 1 (67–82 AU) and Voyager 2 (52–61 AU) (Burlaga et al., 2001). Voyager 1 had a first peak near the middle of 2000, about the same as for CR, and a second peak in early to middle of 2003, few months earlier than the CR second maximum. Thus, the magnetic field at Voyager 1 (almost similar to solar open magnetic flux) could be a candidate for CR modulation in a rough way. The Voy-ager 2 plot has three ill-defined peaks, only the third one coinciding with the second peak of Voyager 1. It may be noted that Voyager 1 was above the ecliptic plane while Voyager 2 was below.
7. The last plot for CIRs (corotating interaction regions, Alves et al., 2006) shows one prominent peak in the middle of 2003, almost matching with the CR second peak. Thus, it seems that magnetic fields deep in the heliosphere, responsible for CR long-term modulation, may have contributions from dissipated CMEs as well as from corotating regions.
3 Conclusions
Using data for CR (Cosmic rays) as recorded by the Cli-max neutron monitor since 1953, the 3-monthly means were compared with those of several solar parameters, namely, sunspots, Lyman-α, 2800 MHz solar radio emission, coro-nal green line index, X-rays, Solar flare index, solar open magnetic flux (low solar latitudes), interplanetary parame-ters, namely, number density N, solar wind speed V and total magnetic field B and the Tilt angle, CME and ICME counts, and some terrestrial parameters. The following was noted:
1. The hysteresis plots of CR versus solar parameters showed narrow loops in even cycles 20, 22 and broad loops in odd cycles 19, 21, 23. There was a lag be-tween commencement of CR modulation and sunspot minimum, of about 3 months in even cycles and 9–15 months in the odd cycles. If CR data are adjusted for these lags, the hysteresis loops become narrower but not completely. A comparison of the average 11-year sunspot variations separately for odd and even cycles showed that in odd cycles, Rz evolved more rapidly as compared to even cycles. This might have contributed partially to the odd-even difference of CR hysteresis plots.
2. Hysteresis plots for CR versus interplanetary N and V were erratic and uncertain (no clear distinction between patterns for odd or even cycles). Plots of CR versus IMF
Bwere narrow for even as well as odd cycles, indicating a good relationship between CR and B, but some dis-crepancies remained, indicating that this B near Earth may not be fully representative of conditions deep in the heliosphere where CR modulation mainly occurs. 3. The hysteresis loops of CR versus Tilt angles were
sim-ilar to those of CR versus Rz, narrow in even cycles and broad in odd cycles. Rz has no relevance for interplan-etary space and hence for CR modulation. But the Tilt angle is very much relevant.
4. Hysteresis loops between CR and ICMEs or HSPS (high-speed plasma streams) were not clear-cut and no clear distinction was seen between the loops for odd and even cycles. The same was true for terrestrial parame-ters.
5. A detailed examination for cycle 23 showed the follow-ing:
– CR modulation started with a delay of a few months
with respect to sunspot minima. This was expected, as cycle 23 is an odd cycle.
– CR had maximum depression (a peak, if vertical
scale is upside down) during the high sunspot years 2000–2003. This general anti-correlation between CR and sunspot number is also expected.
– During the years of sunspot maximum (2000–
2003), Rz was structured and had three peaks with a spacing of ∼20 months between the first and the third peak, but CR had two peaks (actually depres-sions) with a much larger spacing of ∼30 months. The first peaks of Rz and CR were almost simul-taneous, but the lag of several months between the starting of CR modulation and sunspot minimum was not seen for the peaks. Hence, the second peak of CR occurred several months later than the last peak of Rz. Thus, the gaps between the peaks did not match.
– The Tilt angle had the same type of variation as Rz.
Since Rz and other similar radiations do not affect the heliosphere, these are irrelevant for CR mod-ulation. But Tilt angle in interplanetary space is very much relevant for CR modulation. The simi-larity between the variations of Rz and the Tilt angle implies a discrepancy (very different spacings) be-tween the variations of Tilt angle (20 months) and CR variations (30 months).
– The open magnetic flux (a few solar radii above the
photosphere) had a two-peak structure and the CR two-peak structure can be considered as a delayed
effect of the open magnetic flux but for the fact that the spacings were different (flux, ∼25 months; CR,
∼30 months).
– The total interplanetary magnetic field B has only
one peak and the B variations were dissimilar to CR variations. Hence, B measurements near the Earth are no good proxies for conditions in the deep he-liosphere, where most of the CR modulation takes place
– Magnetic fields at Voyager 1 had a two-peak
struc-ture similar to open magnetic flux, with a spacing of ∼25 months, a few months lesser than the 30 months of CR.
– The co-rotating interplanetary regions (CIR), more
frequent in the declining phase of the solar cycle, had one strong peak only a few months before the second CR peak. Thus, the magnetic fields of such regions might be contributing to the CR modulation occurring well after the sunspots started decreasing in 2003.
– Among all these parameters, the magnetic open flux
and the magnetic field at Voyager 1 seem to be clos-est to the deep heliospheric magnetic conditions af-fecting CR modulation.
Cane et al. (1999) showed that the variations of the inter-planetary magnetic field strength (B) over a 22-year period are tracked by the inverted profile of the cosmic ray den-sity measured by neutron monitors and suggested that global changes in the Sun’s magnetic field were more important for long-term CR modulation than magnetic field enhancements resulting from the merging of high-speed flows and coronal mass ejections in the outer heliosphere. We feel that CR modulation is certainly due to magnetic field structures in deep heliosphere, but the structures may not be related ex-clusively to solar open magnetic fields and may be related at least partly to the dissipation of CME shocks (Global MIR, GMIR) and CIR (co-rotating interplanetary regions) also, which seem to occur more often in the declining phase of a sunspot cycle.
Acknowledgements. Thanks are due to W. M. Wang, I. G. Richard-son and E. Echer for supplying some data privately. Thanks are due to the referees for valuable suggestions. This work was partially supported by FNDCT, Brazil, under contract FINEP-537/CT.
Topcial Editor R. Forsyth thanks two anonymous referees for their help in evaluating this paper.
References
Alves, M. V., Echer, E., and Gonzalez, W. D.: Geoeffectiveness of corotating interaction regions as measured by Dst index, J.
Geophys. Res. 111, A07S05, doi:10.1029/2005JA011379, 2006. Atac, T. and Ozguc, A.: Flare index of solar cycle 22, Solar Phys.,
180, 397–407, 1998.
Burlaga, L. F., McDonald, F. B., Goldstein, M. N., and Lazarus, A. J.: Cosmic ray modulation and turbulent interaction regions near 11 AU, J. Geophys. Res., 90, 12 027–12 039, 1985.
Burlaga, L. F., McDonald, F. B., and Ness, N. F.: Cosmic ray modu-lation and the distant heliospheric magnetic field: Voyager 1 and 2 observations from 1986 to 1989, near 11 AU, J. Geophys. Res., 98, 1–11, 1993.
Burlaga, L. F., Ness, N. F., and McDonald, F. B.: Voyagers 1 and 2 observe a GMIR and associated cosmic ray decreases at 61 and 82 AU, Proc. Int. Conf. Cosmic Rays, 27(9), 3641–3643, 2001. Cane, H. V., Richardson, I. G., and von Rosenvinge, T. T.:
Cos-mic ray decreases: 1964–1994, J. Geophys. Res., 101, 21 561– 21 572, 1996.
Cane, H. V., Wibberenz, G., Richardson, I. G., and von Rosenvinge, T. T.: Cosmic ray modulation and the solar magnetic field, Geo-phys. Res. Lett., 26, 565–568, 1999.
Dorman, L. I.: To the theory of cosmic ray modulation by solar wind, Proc. 6th Int. Cosmic Ray Conf., Moscow, 4, 328–334, 1959.
Dorman, L. I.: Cosmic ray long-term variation: even-odd cycle ef-fect, role of drifts, and the onset of cycle 23, Adv. Space Res., 27(3), 601–606, 2001.
Dorman, L. I., Dorman, I. V., Iucci, N., Parisi, M., and Villoresi, G.: Hysteresis between solar activity and cosmic rays during cycle 22: The role of drifts, and the modulation region, Adv. Space Res., 27(3), 589–594, 2001a.
Dorman, L. I., Iucci, N., and Villoresi, G.: Time lag between cos-mic rays and solar activity in solar minimum 1994-1996 and the residual modulation, Adv. Space Res., 27(3), 589–594, 2001b. Ferreira, S. and Potgieter, M.: On the ‘tilt angles’ of the
helio-spheric current sheet used in modulation models over a 22-year cosmic ray cycle, 34th COSPAR Scientific Assembly, The Sec-ond World Space Congress, held 10–19 October 2002 in Hous-ton, TX, USA., meeting abstract, 2002.
Harvey, K. L. and Recely, F.: Polar coronal holes during cycles 22 and 23, Solar Phys., 211, 31–52, 2002.
Hoeksema, J. T.: The Large-Scale Structure of the Heliospheric Current Sheet During the ULYSSES Epoch, Space Sci. Rev., 72, 137–148, 1995.
Jokipii, J. R. and Davila, J. M.: Effects of particle drift on the trans-port of cosmic rays, IV-more realistic diffusion coefficients, As-trophys. J., 248, Part 1, 1156–1161, 1981.
Jokipii, J. R. and Thomas, B.: Effects of drift on the transport of cos-mic rays, IV-modulation by a wavy interplanetary current sheet, Astrophys. J., 243, Part 1, 1115–1122, 1981.
Kane, R. P.: Long-term variations of solar, interplanetary, geomag-netic indices and comic ray intensities-A brief tutorial, Ind. J. Radio Space Phys., 35, 312–323, 2006a.
Kane, R. P.: A detailed comparison of cosmic ray gaps with solar Gnevyshev gaps, Solar Phys., 236, 207–226, 2006b.
Kane, R. P.: Modulation of cosmic rays in cycle 23: Some striking features, J. Atmos. Solar-Terres. Phys., 68, 1291–1310, 2006c. Lee, M. A. and Fisk, L. A.: The role of particle drifts in solar
mod-ulation, Astrophys. J, 248, Part 1, 836–844, 1981.
Maris, O. and Maris, G.: High-speed plasma streams in solar wind, Romanian Rep Physics, 55, 259–269, 2003.
Parker, E. N.: Dynamic Processes in the Interplanetary Medium, Intersci. Publ., 1963.
R. P. Kane: Cosmic Ray intensity decreases versus solar, interplanetary and terrestrial parameters 2097
of galactic cosmic rays, Astrophys. J., 294, 425–440, 1985. Rybansky, M., Rusin, V., Minarovjech, M., and Klocok, L.:
Reex-amination of the coronal index of solar activity, J. Geophys. Res., 110, A08/06, doi:10.1029/2005JA011146, 2005.
Wang, Y.-M. and Sheeley, N. R.: Sunspot activity and the long-term variation of the Sun’s open magnetic flux, J. Geophys. Res. 107(A10), 1302, doi:10.1029/2001JA000500, SSH 10, 1– 15, 2002.
Wang, Y. M., Lean, I., and Sheeley Jr., N. R.: The long-term vari-ation of the Sun’s open magnetic flux, Geophys. Res. Lett., 27, 505–508, 2000.
Wibberenz, G., Richardson, I. G., and Cane, H. V.: A simple con-cept for modeling cosmic ray modulation in the inner heliosphere during solar cycles 20–23, J. Geophys. Res., 107(A11), 1353, doi:10.1029/2002JA009461, SSH 5, 1–15, 2002.
Woods, T. N., Tobiska, W. K., Rottman, G. J., and Worden, J. R.: Improved solar Lyman alpha irradiance modeling from 1947 through 1999 based on UARS observations, J. Geophys. Res., 105(A12), 27 195–27 215, 2000.