HAL Id: insu-03209971
https://hal-insu.archives-ouvertes.fr/insu-03209971
Submitted on 27 Apr 2021
HAL is a multi-disciplinary open access
archive for the deposit and dissemination of
sci-entific research documents, whether they are
pub-lished or not. The documents may come from
teaching and research institutions in France or
abroad, or from public or private research centers.
L’archive ouverte pluridisciplinaire HAL, est
destinée au dépôt et à la diffusion de documents
scientifiques de niveau recherche, publiés ou non,
émanant des établissements d’enseignement et de
recherche français ou étrangers, des laboratoires
publics ou privés.
Statistical study of ELF/VLF emissions recorded by a
low-altitude satellite during seismic events
Michel Parrot
To cite this version:
Michel Parrot. Statistical study of ELF/VLF emissions recorded by a low-altitude satellite during
seis-mic events. Journal of Geophysical Research, American Geophysical Union, 1994, 99 (A12), pp.23339.
�10.1029/94JA02072�. �insu-03209971�
Statistical study of ELFNLF emissions recorded by a
low-altitude satellite during seismic events
Michel Parrot
Laboratoire do Physique et Chimie do l'Environnement, Centre National do la Recherche Scientifique Orleans, France
Abstract. This paper presents
a statistical
study of low-altitude
satellite data linked to seismic
events. Data of the satellite AUREOL 3 are considered
during 24-hour windows around
the time
of 325 earthquakes
with M• ) 5. Amplitudes at the output of different frequency
filters in the
ELF/VLF range, connected
to electric or magnetic
components,
were stored in a file. This file is
organized
as functions
of three parameters:
At, the difference
between
the time of the earthquake
and the time of the satellite
data; ALong, the difference
between
the longitude
of the earthquake
and the longitude
of the satellite;
and AInv.Lat, the difference
between
the invariant
latitude
of the
earthquake
and the invariant latitude of the satellite.
When all data are averaged
over time, the
amplitude
is maximum
in the interval ALong ( 10 ø regardless
of AInv.Lat. This indicates
that, due
to propagation,
waves related
to seismic
processes
can be observed
all along the magnetic
meridian
passing over the epicenter of an earthquake.
However, as the AUREOL 3 data were not
continuously
recorded,
thus providing a limited number of events,
it was impossible
to carry out
a complete statistical
study.
1. Introduction
Electromagnetic emissions in the ELF/VLF range that are related to seismic or volcanic activity are well known. Since the reports by Ookhberg et al. [1982] and Warwick et al. [1982], many papers have presented ground observations of wave emissions during seismic events. The more recent work is by Fraser-Smith et al. [1990], Fujinawa and Takahashi [1990], Dea et al. [1993], and Keens and Roeder [1993]. Many other references can be found in the review paper by Parrot et al. [ 1993]. Two types of emissions can be considered. First, precursor emissions occur a few hours before earthquakes, in a large- frequency range from one hundredth hertz up to several megahertz. Second, emissions observed after the shock generally are attributed to the propagation of acoustic-gravity waves. However, all hypotheses concerning the generation mechanism of precursor emissions are also valid after the shock, when the Earth's crust returns to an equilibrium state. These hypotheses are described by Parrot et al. [1993] and are mainly related to: wave production by compression of rocks [Cress et al., 1987], diffusion of water in the epicentral area [Dragahoy et al., 1991], and redistribution of electric charges [Locknet et al., 1983; Eriemote and Hashimoto, 1990].
The seismo-electromagnetic emissions can propagate up to the ionosphere [Gokhberg et al., 1983, 1984; Molchanov, 1991], and
observations made with low-altitude satellites have shown
increases of ELF/VLF waves above seismic regions [Larkina et al., 1983, 1989; Parrot and Mogilevsky, 1989; Chmyrev et al., 1989; Mikhaylova et al.. 1991; Molchanov et al., 1993]. Studying the dispersion of whisfiers, Hayakawa et al. [1993] have shown that seismic activity can affect the propagation of magnetospheric
waves.
Most reports present observations of a single event, and no
direct relationship between earthquake and wave growth can be
Copyright 1994 by the American Geophysical Union. Paper number 94JA02072.
0148-0227/94/94JA-02072505.00
seen, although several hypotheses about the generation mechanism exist. Only a statistical study can show the general behavior of wave emissions. Such study is possible with ground observations made close to the epicenters, but it takes a long time to register many events. In contrast to ground experiments, satellite
experiments cover most seismic zones of the Earth, and statistical
studies become meaningful because of the much larger number of recorded events. Such statistical work was carried out by Henderson et al. [1993], using data from the low-altitude satellite DE 2, but this work indicates no evident correlation between seismic activity and wave emissions. Molchanov et al. [1993], however, have observed electromagnetic emissions associated with many earthquakes when they studied the Intercosmos 24 satellite data. The aim of the present paper is to present another statistical study with data from the low-altitude satellite AUREOL 3. The working method is slightly different as it is not based on values
exceeding thresholds, as in the paper by Henderson et al. [1993],
but on average values calculated when all events are considered. There is no comparison between earthquake orbits and control orbits, but there is comparison between average amplitudes of waves recorded close to earthquakes and those recorded far from earthquakes. This study also considered the difference between earthquake and satellite longitudes to check ff there is a longitudinal effect. Larkina et al. [1983, 1989] found that emissions related to earthquakes could be observed at more than 100 ø in longitude from epicenters.
The experiment and data processing are described in section 2. Section 3 presents the results, and conclusions are given in section
4.
2. The Data
The ARCAD 3 wave experiment was placed into a quasi-polar orbit onboard the triaxial-stabihzed AUREOL 3 satelhte (apogee
2012 km, perigee 408 km, inchnation 82ø5 ', period 109.5 min),
launched on September 21, 1981. ARCAD 3 measured three
magnetic and two electric components of the waves in the ELF
and VLF range, from 10 Hz up to 15 kHz. The Ez component was
approximately parallel to the Earth's magnetic field at high
23,340 PARROT: ELF/VLF EMISSIONS RECORDED DURING SEISMIC EVENTS
latitude, the œ, component being nearly perpendicular. The x direction was nearly parallel to the satellite trajectory. All
characteristics of the experiment are given by Bertbelief et al.
[1982]. Two telotnetry systems were available on AUREOL 3: the real-time French telemetry (TMF), only used when the satellite was near a telemetry station, and the onboard tape-recorded Soviet telemetry (TMS).
Because of the problem of correlating satellite orbit, earthquake
time, and satellite data, only the onboard recorded telemetry has
been used. This telemetry contains filterbank data with a
frequency range between 10 Hz and 15 kHz. At a given time the
filters are connected to two channels among the two electric and
the three magnetic components. Data from October 1981 until
December 1983 were used without any selection concerning
geomagnetic activity. Along the orbit, the recording period was
not continuous and varied from one day to another (there are days
without
any data),
depending
on experiment
programming.
Only
two different TMS modes were considered: ZAI• and ZAP4,
whose filter sampling frequencies were, respectively, 400 points
and $0 points every 128 s. The calibration sequences were
removed from the data. A data file was created with all samples
recorded :i: 24 hours around the time of an •quake. Data
between -45 ø and +45 ø of invariant latitude were selected to avoid
zones of intense natural noise. Data processing of low-altitude
satellites have shown that, in this region, the natural noise at
frequencies lower than 800 Hz is generally not intense [Parrot,
1990]. The earthquakes
were chosen from the Preliminary
determination of epicenters [1981 - 1983], with magnitudes larger
than $.0 and with epicenters located between -45 ø and +45 ø of
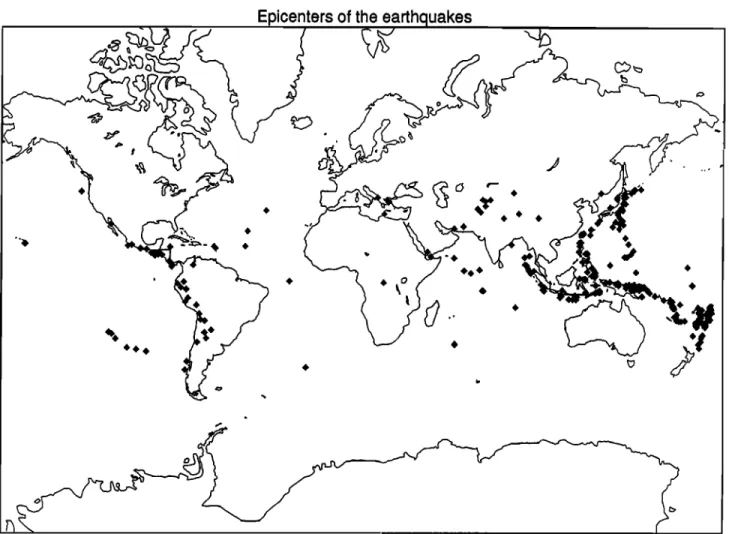
invariant latitude. For the two years of the mission, the total number of earthquakes with corresponding satellite data is 325. The positions of all epicenters are shown on Figure 1. As can be seen, some of the earthquakes occurred below the sea, which is certainly not a good condition to observe electromagnetic waves [Oike and Ogawa, 1986], but in the Pacific ocean the many small
islands can act as antennae and propagate acoustic-gravity waves.
The data set is mainly organized as functions of three
parameters: At, the difference between the time of the earthquake
and the time of the satellite data; ALong, the absolute difference
between the longitude of the earthquake and the longitude of the satoRito; and AInv.Lat, the absolute difference between the invariant latitude of the earthquake (taken at 150 km above the epicenter) and the invariant latitude of the sateRite. The other parameters are the five electromagnetic components because they were not recorded simultaneously, and the filter frequencies of 140, 450, 800, 4500, and 15,000 Hz. Concerning this data set, two points must be underlined: the same data may refer to different earthquakes if they occurred in the same :i: 24 hour window, but it is equally possible that several data records, recorded at different places around the Earth, might refer to a single earthquake. Several case studies corresponding to this data set can be found in the works by Parrot and Mogilevsky [1989] and Parrot et al. [1993].
3. The Results
For each electromagnetic component and each filter frequency, two types of plots are presented. First, the average value of the
field is shown as functions of AInv.Lat and of ALong with bins of
Epicenters
of the earthquakes
10 ø or 20 ø. The data have been averaged over the entire :l: 24 hours around the time of earthquakes. Considering that the waves could easily propagate from one hemisphere to the other, the data
in opposite hemispheres are mixed for a given ALong value. A
maximum around the point (0ø,0 ø) is expected if there is a seismo-electromagnetic effect. Second, in order to detect precursor effects, the average value of the field is shown as functions of At with bins of 4 hours and of ALong with bins of 20 ø. In this last case the data have been averaged over all invariant latitudes. For
45
, I I , , !
each plot the lower panel shows a table with the number of earthquakes (lower number), and the number of data samples (upper number) that were taken into account in all cells.
Plate I shows the average amplitude of the signal recorded by
magnetic component Bx4 s at 140 Hz as a function of AInv.Lat and
ALong. All data contained in the set are plotted on this figure: the data with ALong between 0 ø and 20 ø are relevant to satellite
observations close to epicenters, but data with ALong between
160 ø and 180 ø are related to satellite observations when
36 27 18 B - Filter ß 140Hz. X45 , I . , , I , , . I ! , , I . ß I 3.28e-05 2.84e-05 2.40e-05 1.96e-05 0 20 40 60 80 100 120 140 A Long 160 180 1.53e-05
,,,
,
,,,
,,,
,,.,
,
,,,
,,..
,,,
_ 3382 26 1 4781 3439 1172 41 3493 221 2611 _ _ 23 26 24 28 22 26 24 25 16 _ _ 7110 5454 7661 5801 3857 9314 8819 4744 5669 _ _ 44 43 47 39 43 50 52 45 38 __ __11223 7743 10203 6286 7498 10298 14578 10910 8852 __ __ 72 81 75 59 68 74 77 67 66 __ __19571 14114 14375 8593 9161 13276 17113 16246 13911__ __ 79 94 78 75 71 81 98 79 80 __ __17740 22304 17518 9758 8701 16685 18282 17174 9928 __ __ 58 74 62 59 53 61 73 64 57 __ I ! I I I I I I I I i I I I I I I I I I I I I I I I I 45 36 • 27 • •8 9 0 0 20 40 60 80 100 120 140 160 180 A LongPlate 1. In the upper panel, average amphtude of the waves at 140 Hz recorded by the magnetic component Bx45
as a function of the relative position between epicenters and satellite: AInv. Lat and ALong. This amplitude is color-
coded according to the scale on the fight. In the lower panel, each cell indicates at the top the number of samples and at the bottom the number of earthquakes, which were taken into account for the upper panel.
23,342 PARROT: ELF/VLF EMISSIONS RECORDED DURING SEISMIC EVENTS earthquake epicenters were located at exactly the opposite place.
An increase of the wave intensity is observed for ALong between
0 ø and 20 ø. This increase is not only present for small Alnv.Lat,
but also for larger values. It indicates that, when an earthquake occurs, there is a significant increase of waves in all of the magnetic shell passing through the longitude of the epicenter. As the data were averaged over the + 24 hours around the time of earthquakes, we do not know if this emission is a precursor effect or not. Looking to the color scale on the right, it must be noted that there is only a factor of 2 between the intensity level of emissions correlated with earthquakes and the background noise
level.
Data in Plate 2 show part of the data shown on Plate 1, now
only considering telemetry in the ZAP3 modeß The plot is with
bins of 10 ø in ALong, and is now limited to ALong < 90 ø. The
lower panel shows that the number of events is slightly different.
The increase
is also observed
when
satelliie
longitude
is close
to
that of the epicenters. No longitudinal effect can be observed in
Plates 1 and 2.
The variation as a function of frequency is shown in Plate 3,
where the average amplitude of the signal recorded by magnetic
component Bx45 is plotted. It is the same as Plate 2 (same number
of samples and same number of earthquakes), but for three
different frequencies: 450 Hz in the lower panel, 800 Hz in the
45
Bx45
-- Filter' 140Hz.
( ZAP5
).
.,. , .t , ,. ., . ,. t , . , 36 5.56e-05 27 18 9 10 20 30 40 50 60 70 80 90 A Long 4.58e-05 5.60e-05 2.62e-05 1.64e-05 45 36 ß 27 <• 18 o o __ 12 779 741 449 1 1 8 859 1 451 __ 14 10 15 17 12 18 11 16 12 __ 2238 1907 1236 889 2960 2077 592 2961 774 __ 28 21 24 27 25 26 17 23 26 __ 3603 3535 1826 2065 5122 1876 2529 1425 2155 __ 34 30 33 42 31 34 20 31 34 __ 6293 8124 5080 3662 6984 2639 3208 2043 2986 __ 31 31 33 43 34 30 34 28 32 __ 5867 8675 10663 6861 5883 7030 4329 2638 3107 __ 19 22 27 30 18 25 24 27 20 I I I I I I I I I I • • • • • I • • I I I I I I I i I 10 20 30 40 50 60 70 80 90 A Long45 56 ß 27
Filter- 4500Hz.
( ZAP5
).
, i , I I , 1.31e-05 •. 1.05e-05 , 7.98e-06 E • 5.41e-06 2.84e-06 0 0 10 20 50 40 50 60 70 8045ti
I ,
56 ß 27 18. .! ß I • ..• , I ,
I•x45
-- Filter- 800Hz.
, I , , I( ZAP5
, t).
I 90 9.08e-05 '•' 7.20e-05 5.52e-05 5.45e-05 1.57e-05 45 0 10 20 50 40 50 60 70I•x45
-- Filter' 450Hz. ( ZAP3
).
,., ,.., , • , , , ,
80 90
2.55e-04
Plate 3. Same as the upper panel
of Plate 2, but for different frequencies: 450 Hz in the lower panel, 800 Hz in the middle panel, and 4500 Hz in the upper panel
.27 i
18 • ?. 9 • 0 0 10 20 50 40 50 60 70 80 A Long 90 ;'-1.85e-O4 N ,, •- 1.51 e-04 E '( 7.87e-05 2.64e-0523,344 45 36 27
- Filter' 450Hz.
( ZAP3
).
, I , , , I , , , I , , , I , ß I . , , .I ß .. 5.37e-05 4.28e-05 3.18e-05 2.09e-05 9.95e-06 I ' i 10 20 3o 36- ß 27- <• 18- 0 - 1 o 20 I I 40 50 60 70 80 90E
z - Filter' 140Hz.
( ZAP5
).
I , I I : I , I I I I I 40 50 60 70 80 90 A Long 1.53e-05 1.24e-05 9.60e-06 6.74e-06 3.87e-06Plate 4. Same as in Plate 2, but for the E z component; the data corresponding to the 450- and 140- Hz filters are respectively in the upper and middle panels. The lower panel presents the numbers of samples and events,
as in Plate 1. 45 36 .,.; 27 0 0 7 831 2111 965 3372 2569 12 3531 2483 __ _ __ 13 16 19 17 18 20 15 23 17 __ __ 2560 2273 1924 1596 4719 3898 3506 3882 4285 __ __ 23 26 28 25 33 29 24 29 26 __ __ 5198 5495 2624 4080 9314 5907 4337 7330 3497 __ __ 37 40 45 51 49 41 36 47 39 __ __ 8791 13072 4905 5242 7391 7449 4918 11671 5413 __ __ 41 43 53 49 48 40 44 50 51 __ __ 9910 17714 10301 9108 10914 6695 6240 9124 8702 __ __ 31 40 38 42 38 37 38 41 39 __
III III iii iii iii III IIi II1 iii
10 20 30 40 50 60 70 80 90
middle panel, and 4500 Hz in the upper panel. We see that the
increase in wave intensity close to the epicenter longitude is still
strong for the 450-Hz and 800-Hz filters, but that this effect
completely disappears at the higher frequency.
One data set for electric components is showll on Plate 4. It concerns the E z component at 450 Hz (upper panel), and 140 Hz
(middle panel). The lower panel shows the number of samples and
events as in Plates 1 and 2. As with the magnetic components, an
increase is observed when •i,ong < 10 ø, but other peaks are also
seen at different places. This is due to the specificity of electric
measurements. In this low-latitude •egion, Kelley and Mozer [1972] and Holtet et al. [1977] have shown with low-altitude satellite measurements that electrostatic turbulence is very commonly observed around the magnetic equator. This phenomenon mainly occurs during the night. In Plate 4 (and in the others), no distinction is made between the emissions recorded during day or night.
An important point is to known if our statistic can be corrupted
by other natural noises like whistlers due to thunderstorm activity
near the equator. Numerous whistlers may be occasionally
24 20 B - Filter ' 140Hz. z ! I I I , I , I 16 4.296-05 12 O ...,, -4 -8 -12 3.65e-05
3.01
e-05
2.37e-05 -16 -20 -24 0 20 40 60 80 100 120 140 A Long 160 180 1.736-05 24 20 16 12 -4 -8 -12 -16 -20 -24 0 6512 2975 5803 7058 2375 7159 5916 6424 4563 .... lb ... 1¾ ... 1• ... i• ... (i ... • ... i• ... •i ... • ....7825 5105 7327 5147 1057 5905 7628 12450 6098 .... • ... 'id ... •¾ ... f• ... {6 ... {• ... i• ... • ... • .... 8967 6331 4659 1418 5671 4847 9811 7565 8355 .... lb ... 1i ... 1• ... ) ... • ... ii ... i6 ... ii ... •6 .... 9519 4649 1255 2757 922 2500 13450 7561 5665 .... lb ... •¾ ... • ... • ... • ... • ... i• ... i• ... • .... 1222 3985 2949 2389 3371 6383 4133 1835 3280 ... • ... • ... • ... i• ... {• ... {• ... i• ... ¾ ... • .... 4616 4401 1428 3145 4188 6785 7163 5966 2803
.... • ... • ... ,'1
... f6 ... • ... ;i ... ;• ... i• ... • ....
,..
'..
....
...
...
...
...
... ?ff ...
14 15 15 12 12 14 17 16 13 3025 407g 6265 3326 5730 5505 44o9 1146 5270 .... lb ... •¾ ... •7 ... fi ... • ... ;• ... i; ... 9 12 5929 1472 6592 3645 2227 5380 7081 4584 4175 .... i• ... ff ... •¾ ... • ... • ... • ... i• ... • ... i• ....6911 4317 6279 2129 5567 2012 6821 5060 915 .... • ... •¾ ... •¾ ... • ... • ... • ... • ... i• ... Y .... 7031 2696 5110 1728 4791 2806 5015 6051 4856 .... • ... •¾ ... fl ... • ... • ... • ... • ... i• ... i• .... 6200 4819 4972 5679 10546 4960 5685 2475 5271 ... • ... • ... •¾ ... • ... ;• ... • ... • ... ¾ ... • .... 20 40 60 80 100 120 140 1 60 180 A Long
Plate $. The upper
panel
shows
the average
wave
amplitude
at 140 Hz recorded
by the magnetic
component
Bz as
a function
of At and •Long. This amplitude
is color-coded
according
to the scale
on the right. The lower panel
23,346 PARROT: ELF/VLF EMISSIONS RECORDED DURING SEISMIC EVENTS observed at low latitudes [Scarabucci, 1970], but their importance
is relative. Our data are obtained with filters that measure the
mean power of the signal with a logarithmically compressed output and a time delay of 0.3 s [Berthelier etal., 1982]. Therefore the amplitude of pulses like whistlers are strongly attenuated. In fact, a representation of the data of the low-altitude satoRito AUREOL 3 at frequencies around 800 Hz and in geographical coordinates [Parrot, 1990] does not indicate a relation with regions of high thunderstorm activity (this is not the case at higher frequencies). The ELF background noise level is not very intense at low latitudes and this can be also observed with other low-altitude sateRites [Kelley and Mozer, 1972; Kelley etal., 1975; Holtet etal., 1977]. A comparison between particular power spectra obtained from orbits of AUREOL 3 near opicenters and the average power spectrum recorded by AUREOL 3 at low magnetic latitudes is shown in the work by Serebryakova etal. [1992]. Another point concerns the attenuation of waves propagating from the ground up to the ionosphere near the equator. However, until now, we cannot say that the observed wave enhancement is directly related to electromagnetic waves produced by earthquakes at the ground level. Many other hypotheses can be considered [Parrot etal., 1993].
To determine if the omissions observed close to the opicenter longitudes occurred before or after the earthquakes, the complete data set corresponding to magnetic component B z at frequency 140 Hz is shown in Plate 5. The average amplitude is now plotted
as a function of At and ALong in the upper panel. The lower panel
indicates the number of samples and the number of events. We
can see a peak for ALong < 20 ø, and for At between 0 and -4
hours, which seems to indicate that it is a precursor omission. However, the lower panel shows that the average value in this cell is related to only 14 events, which is not very significant. In general, the number of events in each cell is small, and thus the statistics with At are not meaningful because of too few events. This is not the case for the (ALong, AInv.lat) plots. If we retum to the lower panel of Plato 1, the situation is different because the polar orbit of the satoRito favors the number of events in each cell: as the satellite stays at nearly the same longitude when the orbit is between -45 ø and +45 ø in latitude, the same event can be
seen at different invariant latitudes.
4. Conclusions
Data from the low-orbiting sateRite AUREOL 3 were used to search for a correlation between seismic activity and increases in wave emissions. Although a correlation between two phenomena does not necessarily relate to a causative link, it is shown that wave intensity is enhanced at frequencies lower than 800 Hz close to epicenters. There is an extension of the increase in latitude, but not in longitude, which agrees with the observations already reported by Parrot and Lefeuvre [1985], and Serebryakova etal.
[1992].
The discrepancy with the paper of Henderson etal. [1993] could be explained by differences in the statistical methods as well as by the electromagnetic components that were used. Henderson etal. [1993] only considered electric measurements, but we have shown that such signals are disturbed by natural
electrostatic noise.
However, our data sets only contain a limited number of events because the telemetry of the satellite was not continuously recording around the Earth. The data sets are thus biased and do not allow a complete statistical study. For this reason, it is impossible to determine if the wave growth seen close to
opicenters is due to a precursor omission, or to the effect of
acoustic-gravity waves after the shock. Moreover, a larger number
of events would also permit to take into account other important
parameters, such as the geomagnetic activity, the day/night effect,
and the depth, magnitude, and location of the earthquakes. Acknowledgments. The AUREOL 3 program was undertaken jointly by the Centre National d'Etudes Spatiales (CNES) in France, the Space
Research Institute (IKI) and INTERCOSMOS in Russia. The author thanks
J. J. Berthelier, principal investigator of the VLF experiment, for use of the data. This work was financially supported by CNES during the definition of the project DEMETER (Detection of Ele•o-Magnetic Emissions Transmitted from Earthquake Regions). The many participants in this project are thanked for the helpful discussions the author had with them. The editor thanks A. B. Dragsnov and A. C. Fraser-Smith for their assistance in evaluating this paper.
References
Bertholier, J.J., et al., Measurements of the VLF electric and magnetic components of waves and DC electric field on board the AUREOL 3 spacecraft: The TBF-ONCH experiment, Ann. Geephys., 38, 643-667, 1982.
Chmyrev, V.M., N.V. Isaev, S.V. Bilichenko, and G. Stanev, Observation by space-borne detectors of electric fields and
hydromagnetic waves in the ionosphere over an earthquake
centre, Phys. Earth Planet. Inter., $7, 110, 1989.
Cress, G.O., B.T. Brady, and G.A. Rowell, Sources of electromagnetic radiation from fracture of rock samples in the laboratory, Geephys. Res. Lett., 14, 331, 1987.
Dea, J.Y., P.M. Hansen, and W.M. Boomer, Long-term ELF background noise measurements, the existence of window
regions, and apphcations to earthquake precursor emission
studies, Phys. Earth Planet. Inter., 77, 109, 1993.
Draganov, A.B., U.S. Inan, and Yu.N. Taranenko, ULF magnetic
signatures at the earth surface due to ground water flow: A
possible precursor to earthquakes, Geephys. Res. Lett., 18,
1127, 1991.
Enomoto, Y., and H. Hashimoto, Emission of charged particles from indentation fracture of rocks, Nature, 346, 641, 1990. Fraser-Smith, A.C., A. Bemardi, P.R. McGill, M.M. Bowen, M.E.
Ladd, R.A. Helliwell, and e.G. Vfllard Jr, Low-frequency magnetic field measurements near the epicenter of the M•7.1 Loma Prieta earthquake, Geephys. Res. Lett., 17, 1465, 1990. Fujinawa, Y., and K. Takahashi, Emission of electromagnetic
radiation preceding the Itc seismic swarm of 1989, Nature, 347, 376, 1990.
Gokhberg, M.B., V.A. Morgunov, T. Yoshino, and I. Tomizawa, Experimental measurement of electromagnetic emissions
possibly related to earthquakes in Japan, J. Geephys. Res., 87,
7824, 1982.
Gokhberg, M.B., V.A. Pflipenko, and O.A. Pokhotelov, Seismic precursors in the ionosphere, Izv. Russ. Acad. Sci. Phys. Solid Earth, Engl. Transl., 19, 762, 1983.
Gokhberg, M.B., N.I. Gershenzon, I.L. Gufel'd, A.V. Kustov, V.A. Liperovskiy, and S.S. Khusameddimov, Possible effects of the action of electric fields of seismic origin on the ionosphere, Geomagn. Aeron., Engl. Transl., 24, 183, 1984. Hayakawa, M., T. Yoshino, and V.A. Morgounov, On the possible
influence of seismic activity on the propagation of magnetospheric whistlers at low latitudes, Phys. Earth Planet. Inter., 77, 97, 1993.
Henderson, T.R., V.S. Sonwalkar, R.A. Helliwell, U.S. Inan, and A.C. Fraser-Smith, A search for ELF/VLF omissions induced by earthquakes as observed in the ionosphere by the DE 2 satellite, J. Geephys. Res., 98, 9503, 1993.
Holtet, J.A., N.C. Maynard, and J.P. Heppner, Variational electric field at low latitudes and their relation to spread-F and plasma
Kelley, M.C., and F.S. Mozer, A satellite survey of vector electric fields in the ionosphere at frequencies of 10 to 500 Hertz, 3, Low-frequency equatorial emissions and their relationship to ionospheric turbulence, J. Geephys. Res., 77, 4183, 1972. Kelley, M.C., B.T. Tsurutani, and F.S. Mozer, Properties of ELF
electromagnetic waves in and above the Earth's ionosphere deduced from plasma wave experiments on the OVl-17 and OGO 6 satellites, J. Geephys. Res., 80, 4603, 1975.
Keens, H.C., and J.L. Roeder, ELF measurements at the Emerson fault following the Landers, Cahfornia earthquake, Aerospace Rep. ATR-93(8351)-l, The Aerospace Corp., E1 Segundo, Cahf., 1993.
Larkina, V.I., A.V. Nahvayko, N.I. Gershenzon, M.B. Gokhberg, V.A. Liperovskiy, and S.L. Shalimov, Observations of VLF emissions related with seismic activity, on the Intercosmos 19 satellite, Geomagn. Aeron., Engl. Trar•l., 23, 684, 1983. Larkina, V.I., V.V. Migulin, O.A. Molchanov, I.P. Kharkov, A.S.
Inchin, and V.B. Schvetcova, Some statistical results on very low frequency radiowave emissions in the upper ionosphere over earthquake zones, Phys. Earth Planet. Inter., 57, 100,
1989.
Locknet, D.A., M.J.S. Johnston, and J.D. Byeflee, A mechanism to explain the generation of earthquake lights, Nature, 302, 28,
1983.
Mikhaylova, G.A., A.M. Golyavin, and Yu.M. Mikhaylov, Dynamic spectra of VLF-radiation in the outer ionosphere associated with the Iranian earthquake of June 21, 1990 (Intercosmos 24 satellite), Geornagn. Aeron., Engl. Transl., 31, 647, 1991•
Molchanov, O.A., Transmission of electromagnetic fields from seismic sources to the upper ionosphere, Geornagn. Aeron., Engl. Transl., 31, 80, 1991.
Molchanov, O.A., O.A. Mazhaeva, A.N. Goliavin, and M. Hayakawa, Observation by the Intercosmos-24 satelhte of ELF-VLF electromagnetic emissions associated with earthquakes, Ann. Geephys., 11,431, 1993.
Oike, K., and T. Ogawa, Electromagnetic radiations from shallow
earthquakes observed in the LF range, J. Geomagn. Geoelectr., 38, 1031, 1986.
Parrot, M., World map of ELF/VLF emissions as observed by a low-orbiting satellite, Ann. Geephys., 8, 135, 1990.
Parrot, M., and F. Lefeuvre, Correlation between GEOS VLF emissions and earthquakes, Ann. Geephys., 3, 737, 1985. Parrot, M., and M.M. Mogilevsky, VLF emissions associated with
earthquakes and observed in the ionosphere and the magnetosphere, Phys. Earth Planet. Inter., 57, 86, 1989. Parrot, M., J. Achache, J.J. Bertheher, E. Blanc, A. Deschamps,
F. Lefeuvre, M. Menvielle, J.L. Plantet, P. Tarits, and J.P. Villain, High-frequency seismo-electromagnetic effects, Phys. Earth Planet. Inter., 77, 65, 1993.
Scarabucci, R.R., Satelhte observations of equatorial phenomena and defocusing of VLF electromagnetic waves, J. Geephys. Res., 75, 69, 1970.
Serebryakova, O.N., S.V. Bilichenko, V.M. Chmyrev, M. Parrot, J.L. Rauch, F. Lefeuvre, and O.A. Pokhotelov, Electromagnetic
ELF radiation from earthquake regions as observed by low-
altitude satellites, Geephys. Res. Lett., 19, 91, 1992.
U.S. Department of the Interior / Geological Survey, Preliminary determination of epicenters, Monthly hsting, Natl. Earthquake Inf. Serv., Denver, 1981-1983.
Warwick, J.W., C. Stoker, and T.R. Meyer, Radio emission associated with rock fracture: Possible application to the great Chilean earthquake of May 22, 1960, J. Geephys. Res., 87, 2851, 1982.
M. Parrot, Laboratoire de Physique et Chimie de
l'Environnement, CNRS, 3A, Avenue de la Recherche Scientifique, 45071 Orleans cedex 02, France. (e-mail: mparrot@ cnrs-orleans.fr)
(Received November 22, 1993; revised July 7, 1994; accepted August 11, 1994.)