HAL Id: hal-00298040
https://hal.archives-ouvertes.fr/hal-00298040
Submitted on 5 Dec 2005
HAL is a multi-disciplinary open access
archive for the deposit and dissemination of
sci-entific research documents, whether they are
pub-lished or not. The documents may come from
teaching and research institutions in France or
abroad, or from public or private research centers.
L’archive ouverte pluridisciplinaire HAL, est
destinée au dépôt et à la diffusion de documents
scientifiques de niveau recherche, publiés ou non,
émanant des établissements d’enseignement et de
recherche français ou étrangers, des laboratoires
publics ou privés.
A timescale analysis of the Northern Hemisphere
temperature response to volcanic and solar forcing
S. L. Weber
To cite this version:
S. L. Weber. A timescale analysis of the Northern Hemisphere temperature response to volcanic
and solar forcing. Climate of the Past, European Geosciences Union (EGU), 2005, 1 (1), pp.9-17.
�hal-00298040�
www.climate-of-the-past.net/cp/1/9/ SRef-ID: 1814-9332/cp/2005-1-9 European Geosciences Union
Climate
of the Past
A timescale analysis of the Northern Hemisphere temperature
response to volcanic and solar forcing
S. L. Weber
Department of Climate Variability Research, Royal Netherlands Meteorological Institute (KNMI), P.O. Box 201, 3730 AE De Bilt, The Netherlands
Received: 4 August 2005 – Published in Climate of the Past Discussions: 8 September 2005 Revised: 11 November 2005 – Accepted: 15 November 2005 – Published: 5 December 2005
Abstract. The Northern Hemisphere temperature response
to volcanic and solar forcing in the time interval 1000– 1850 AD is studied using first a set of simulations with an intermediate-complexity climate model, driven by recon-structed forcings. Results are then compared with those ob-tained from the seven high-resolution reconstructed temper-ature records for the last millenium that are at present avail-able. Focus of the analysis is on the timescale dependence of the response. Results between the model and the proxy-based reconstructions are remarkably consistent. The re-sponse to solar forcing is found to equilibrate at interdecadal timescales, reaching an equilibrium value for the regression of 0.2–0.3◦C per W/m2. The time interval between volcanic eruptions is typically shorter than the dissipation timescale of the climate system, so that the response to volcanic forcing never equilibrates. As a result, the regression on the vol-canic forcing is always lower than the equilibrium value and goes to zero for the longest temporal scales. The trends over the pre-anthropogenic period are found to be relatively large in all reconstructed temperature records, given the trends in the reconstructed forcing and the equilibrium value for the regression. This is at variance with a recent claim that re-constructed temperature records underestimate climatic vari-ations at multi-centennial timescales.
1 Introduction
External forcings, like volcanic eruptions or solar irradiance variations, have been shown to play an important role in gen-erating Northern Hemisphere (NH) temperature variations during the past six centuries (Mann et al., 1998) and the past millenium (Crowley, 2000). The response to volcanic forc-ing is reliably detected in temperature reconstructions for the
Correspondence to: S. L. Weber
past millenium, but the response to solar forcing is claimed to be weakly present in some periods only (Hegerl et al., 2003). The success of signal detection depends largely on the am-plitude of the forcing, which is much larger for the volcanic forcing than for the solar forcing. It seems likely that the relative importance of each forcing factor is different for dif-ferent timescales. Volcanic eruptions result in a strong, but short-lived reduction of the large-scale radiative forcing, so that this forcing is probably most relevant for annual-decadal timescales. The solar irradiance spectrum, on the other hand, has increasing power at longer timescales. Numerous studies have found evidence of solar forcing at long temporal scales (e.g. Crowley and Kim, 1996). Therefore, this forcing might be important primarily for temperature variations at multi-decadal and longer timescales.
The present paper examines how the large-scale temper-ature response depends on the timescale. This is first done by using a set of model simulations with the ECBilt cli-mate model, driven by reconstructed forcing factors (Crow-ley, 2000). The simulated NH temperature response is anal-ysed as a function of timescale by computing the regression and correlation with the forcing for a range of low-pass fil-ter periods. The model results are then compared with re-sults from seven high-resolution temperature reconstructions that go back at least to 1000 AD. Four of these are based on (partly overlapping) multi-proxy datasets (Jo98 – Jones et al., 1998; Ma99 – Mann et al., 1999; Cr00 – Crowley and Lowery; 2000; Ma03 – Mann and Jones, 2003), while two are based on tree-ring data only (Br00 – Briffa, 2000; Es02 – Esper et al., 2002). One reconstruction combines an-nual tree-ring data with low-resolution records to obtain the longer temporal scales (Mo05 – Moberg et al., 2005). All reconstructions are available at the World Data Center for Paleoclimatology (http://www.ngdc.noaa.gov/paleo).
Focus of the present analysis will be on the timescale de-pendence of the solar and volcanic forced signals in both the model runs and the proxy-based reconstructions. A similar
10 S. L. Weber: NH temperature response to solar and volcanic forcing timescale analysis of the solar-forced response was done by
Waple et al. (2002) for the period 1650–1850 AD. They con-clude that the climatic sensitivity is greatest at timescales longer than 40 yr, while it is reduced at decadal timescales. This holds both for their empirical estimate derived from the Mann et al. (1998) record and model-based estimates. The present study extends this analysis to longer temporal scales by considering the period 1000–1850 AD. It also uses a larger number of reconstructed temperature records and includes the response to volcanic forcing. The proxy data underlying the reconstructed forcings are independent of the datasets used for the temperature reconstructions. The ques-tion of whether the forced signal in the temperature records is plausible can therefore be considered as an assessment of the quality of the temperature reconstructions. Here it is as-sumed firstly, that the reconstructed forcings themselves are of reliable quality, and secondly, that the response character-istics of the climate system can be estimated from the ECBilt simulations.
The outline of this paper is as follows. Section 2 briefly describes the model experiments and defines the regression coefficient used in the analysis. The climatic response to so-lar and volcanic forcing is discussed in Sect. 3. Sections 4 and 5 give the timescale analysis for the simulated tempera-tures and reconstructed temperatempera-tures, respectively. Section 6 contains a summary and discussion.
2 Climate model experiments and analysis method
ECBilt is an intermediate-complexity climate model con-taining a dynamic atmosphere, a global ocean model and a thermodynamic sea-ice model. The atmospheric compo-nent (T21, L3) incorporates simplified representations of the diabatic-heating processes and the hydrological cycle. There is a land surface parameterisation, based on a bucket model for soil moisture and a thermodynamic snow model. Cloud cover is prescribed from seasonal climatology. The atmo-spheric component is synchronously coupled to a flat-bottom ocean component with comparable horizontal resolution and 12 vertical levels. More details on the model are given by Weber et al. (2004).
Four 1000-yr experiments were carried out: two use both volcanic and solar forcing, but start from a different initial state. Two other experiments are driven by either volcanic or solar forcing alone. The radiative forcing due to recon-structed variations in the solar irradiance intensity and vol-canic eruptions is taken from Crowley (2000). Here the ef-fect of volcanic eruptions is parameterised by a reduction of the solar irradiance. The solar forcing is based on ice-core measurements of10Be (Bard et al., 2000), spliced into the reconstruction by Lean et al. (1995) for the more recent time interval. There is a 0.20% decrease in total solar ir-radiance (TSI) for the deepest part of the Maunder Mini-mum (at ca. 1690 AD) with respect to the modern value of
1366 W/m2. This is a conservative estimate of TSI changes compared to other reconstructions (Bard et al., 2000). The analysis period is taken to be 1000–1850 AD. This minimizes anthropogenic effects in the reconstructed temperatures. The model analysis is carried out over the same period, in order to have identical forcing records and record lengths in the analysis.
Reconstructed temperature records rely mainly on proxy data that reflect warm-season temperatures, although some records are calibrated against annual-mean temperatures. They mostly emphasize temperatures in the extra-tropics. For this reason simulated June-July-August (JJA) data are used in the analysis, taken over latitudes north of 20◦N. Six of the reconstructed temperature records are formally cali-brated against the instrumental record. For simplicity the results for Es02, which is not calibrated, are denoted in◦C
as well. This represents a scaling factor of 1, resulting in a similar variance of Es02 as, for example, the Cr00 or Ma03 reconstructions.
In the following we will consider the linear regression of simulated and reconstructed temperatures on each forcing factor, where the regression R is defined as:
R = < T (t + τ )F (t ) >
< F (t )F (t ) > (1)
Here the brackets <.> denote the time average, T is the tem-perature anomaly and F is the (solar or volcanic) radiative forcing, defined as the prescribed anomalies in TSI divided by four to account for the Earth’s geometry. The regression is taken at the lag τ where the correlation ρ is found to be maximimum, with
ρ = < T (t + τ )F (t ) >
< F (t )F (t ) >1/2< T (t )T (t ) >1/2 (2) An alternative to Eq. (1) would be to use the climatic sensi-tivity S, which is generally defined in terms of the absorbed short-wave radiation. The relation between the climatic sen-sitivity and the regression (1) is R=(1−α)∗S, where α is the global albedo. Obviously, past albedo’s are not known. Any estimate of past albedo’s would be different from the time-varying (dynamically computed) albedo’s in the model simu-lations, where they depend on snow and sea-ice cover. There-fore it seems most straightforward to carry out the model-data intercomparison using the regression (1), where the tem-perature response is measured in terms of the prescribed ex-ternal forcing only.
3 Climatic signals due to solar and volcanic forcing
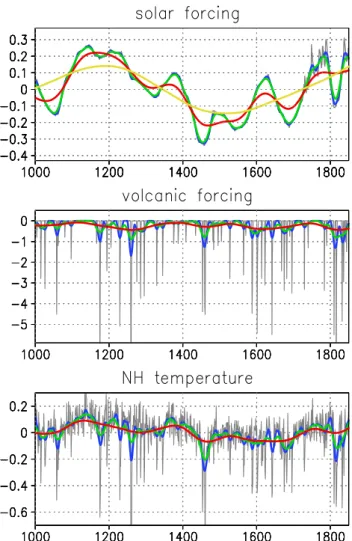
The solar and volcanic forcing factors are shown in Fig. 1. Both have annual resolution. The solar forcing mainly con-sists of a low-frequency signal. The present reconstruction does not contain variability on annual-decadal timescales, as is evident from Fig. 1 where low-pass filtered data (for fil-ter periods of 20, 40, 150 and 400 yrs) are shown as well.
Fig. 1. The radiative forcing due to variations in solar intensity
(upper panel) and volcanic eruptions (middle panel; both in W/m2), and the simulated anomalies in NH temperature (in◦C) from one of the volcanic-solar forced ECBilt runs for the pre-anthropogenic period (time in years AD). Also shown are the smoothed records, using low-pass filter periods of 20 yr (blue), 40 yr (green), 150 yr (red) and 400 yr (yellow; solar forcing only). The vertical axis is cut in the middle and lower panels (suppressing volcanic events up to
−11.8 W/m2and −1.2◦C) in order to highlight the low-frequency components in the time series.
The 20-yr and 40-yr low-pass filtered records almost coin-cide with the unfiltered record. The longer filter periods are chosen such that low-pass filtering of the solar forcing record results in visually different signals, reflecting interdecadal (40 yr), centennial (150 yr) and longer timescales (400 yr).
The volcanic forcing consists of a sequence of strong pulses, which occur at irregular time intervals. In the anal-ysis period 56 eruptions occurred with an amplitude larger than −0.5 W/m2. The largest eruption had an amplitude of
−11.8 W/m2(in 1259 AD), while the next-largest eruptions fall in the range −5 to −7 W/m2(6 cases). The amplitude of the volcanic forcing rapidly decreases for longer timescales,
Fig. 2. The mean radiative forcing due to volcanic eruptions
(up-per left panel; in W/m2) and the mean response in NH temperature (in◦C) from one of the volcanic-solar forced ECBilt runs and in the seven reconstructed records. Shown is the response in the unfil-tered data (green lines) and in the 10-yr low-pass filunfil-tered data (black lines). Note the vertical scale difference between the simulated and reconstructed responses.
with clearly different signals at decadal (20-yr low-pass fil-tered), interdecadal and centennial timescales. The trend component (400-yr low-pass filtered) is very small.
Figure 1 also shows the simulated NH temperature from one of the volcanic-solar forced ECBilt runs. A visual in-spection of the record already suggests that the temperatures primarily reflect the volcanic forcing at short timescales, showing a pronounced decline in the year of an eruption. Variations at multi-decadal and longer timescales indicate the imprint of the solar forcing. Multi-centennial tempera-ture variations are simulated in the volcanic-solar and solar forced runs, but are very weak in the run with volcanic forc-ing only.
The mean response to volcanic eruptions in the model sim-ulations and the seven reconstructions was computed by tak-ing the composite over all 56 eruptions. Figure 2 shows the mean temperature anomaly in the 2 years prior to an erup-tion and the 15 years following it. When another eruperup-tion occurs within this time interval, the year of this second erup-tion (and the years following it) are excluded from the com-posite. This results in an increasingly smaller sample size for longer time delays, so that the tail of the response is less reliably determined than the peak immediately following an
12 S. L. Weber: NH temperature response to solar and volcanic forcing
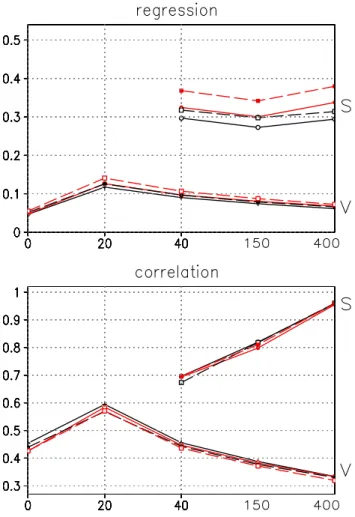
Fig. 3. (a) The regression (in◦C per W/m2) for different low-pass filter periods (in yr) of the NH temperature on the volcanic and so-lar forcing, indicated by V and S, in the ECBilt experiments driven by solar-volcanic forcing (blue and green lines), solar forcing alone (black line) and volcanic forcing alone (red line), and (b) same for the correlation. The temperature data are smoothed with a 10-yr low-pass filter prior to the analysis (dotted lines give results for the unsmoothed data) for later comparison with the proxy-based esti-mates.
eruption. Shown are anomalies with respect to the mean tem-perature in the years without any impact of the volcanic forc-ing, here defined as more than 15 years after an eruption. As there is some arbitrariness in this definition, a few records (Ma99, Mo05) show a bias in the mean response. The simu-lated peak response to volcanic eruptions is −0.32◦C, while reconstructed temperatures show a much weaker peak re-sponse of 0.05–0.1◦C. The latter is consistent with findings of Hegerl et al. (2003) based on a smaller number of recon-structed records.
Smoothing the model data with a 10-yr low-pass filter re-sults in a mean response that is lower by a factor of two. The temperature reconstructions, however, show a very sim-ilar mean response for the smoothed data. This sugggests that the proxy data do not register the strong response to
vol-canic eruptions at annual timescales, although most records do show pronounced variability at annual timescales. (Only the Cr00 and Ma03 reconstructions do not resolve annual timescales, as they contain a number of proxy records with decadal resolution.) Temperatures relax back to normal val-ues within 5–10 years after an eruption in the model. The Es02 and Ma03 records exhibit a weak response that seems to persist longer. All other reconstructed records clearly in-dicate a similar relaxation timescale as found in the model.
4 The temperature response as a function of timescale: the model experiments
The regression on the solar and volcanic forcing, Rsol and
Rvolc, is shown in Fig. 3 for different low-pass filter periods. As the reconstructed solar forcing does not contain annual-decadal timescales, results for Rsolare only shown for inter-decadal and longer timescales. In all model runs the regres-sion on the solar forcing does not depend on the filter period in this timescale range, while it is somewhat higher in the runs which include volcanic forcing than in the run with solar forcing alone. In the volcanic-solar forced runs the mean NH temperature is lower, while temperature variations are larger than in the run with solar forcing only. Because of this larger variability, Rsolappears to be larger. This spurious effect dis-appears when the regression is computed from the reduced records, that is, the temperature record minus the response to each volcanic eruption (the mean response shown in Fig. 2 scaled by the amplitude of that eruption).
The solar forcing can be thought of as a superposition of periodic components. The linear response to such is forc-ing is again periodic and the temperature regression can be shown to increase for increasing forcing periods, reaching an equilibrium level for periods considerably longer than the dissipation timescale of the system (White et al., 1998). At shorter timescales the response is damped due to the ther-mal inertia of the ocean. The dissipation timescale is set by the depth of the oceanic mixed layer and the efficiency of long-wave radiation to space. It is estimated to be a few years (White et al., 1998). In the present experiments Rsol
seems to have equilibrated at interdecadal timescales, con-sistent with earlier findings (Waple et al., 2002) and results from a 10 000 yr solar-forced experiment with the ECBilt cli-mate model (Weber et al., 2004).
The volcanic-solar forced and volcanic forced runs give consistent results for Rvolc. The simulated Rvolc=0.12◦C per W/m2for filter periods of 0–20 yr, while it continuously de-creases for longer periods. The response to volcanic forcing is seen to remain below the equilibrium value for all filter periods. After a volcanic eruption temperatures are found to relax back to normal values within 5–10 yr, while the time between two eruptions is more than 10 yr in 73% of the cases. Therefore, it is reasonable to assume that the response to each eruption is independent of that to the previous or the
next eruption. As a result, the response never equilibrates but instead goes to zero for centennial timescales. For later comparison with the reconstructed temperatures, Rvolcis also computed for the 10-yr smoothed temperature records. This reduces the value for the “unfiltered” data considerably.
Correlations show that the volcanic forcing indeed ex-plains most variance at annual-decadal timescales, while the solar forcing dominates at interdecadal and longer timescales (Fig. 3). All correlations are significant at the 10% level in a one-sided t-test. The lag at which the optimum correlation occurs increases for the longer filter periods, with values of 0–5 yr (volcanic forcing) and 5–10 yr (solar forcing). The cross-correlation between the two forcing factors is lower than 0.1 for all timescales. Therefore, the noise levels are higher and correlations between the temperature and each forcing factor are lower in the volcanic-solar forced runs than in the runs with one forcing only.
The dependence of the regression and correlation on sea-sonality in the present simulations is illustrated in Fig. 4. There is a weak dependence on the season, with somewhat higher regressions for annual-mean data than for summer data. This is due to the positive sea-ice and snow albedo feedbacks, which are more important for annual-mean/winter data than for summer data. This effect becomes more pro-nounced, when the spatial sampling is restricted to more northern latitudes. It is also somewhat stronger when only land points are taken into account, see Fig. 4. Correlations hardly depend on seasonality or spatial sampling, because temperature variations are larger for annual-mean (land) tem-peratures than summer (land and ocean) temtem-peratures. The functional dependence of the regression and the correlation on the filter period does not depend on the geographical cov-erage or seasonality.
The equilibrium temperature regression on the solar forc-ing in the solar-forced experiment with ECBilt can be com-pared with figures given for comparable experiments with more comprehensive GCMs. No figures exist in the litera-ture for the regression on the volcanic forcing. The present value Rsol=0.2◦C per W/m2 is found to be relatively low (Weber et al., 2004). For example, temperature variations at multi-decadal timescales in a solar-forced experiment with the ECHAM3/LSG model indicate a regression of 0.4◦C per W/m2 (climatic sensitivity of 0.63◦C per W/m2, with an albedo of 36%; Cubasch et al., 1997). This model is known to have a relatively high climatic sensitivity. The low sen-sitivity of ECBilt is associated with the lack of cloud and moisture radiative feedbacks, which are assumed to affect all timescales in a similar manner. The correlation coefficient (signal-to-noise ratio) in ECBilt is found to be similar to that in GCMs (Weber et al., 2004), as ECBilt also underestimates internal climatic variability due to its coarse atmospheric res-olution.
Fig. 4. Same as Fig. 3, but now for JJA (solid black lines) and
annual-mean (dashed black lines) temperatures over latitudes north of 20◦N. Red lines indicate JJA (solid) and annual-mean (dashed) temperatures over land gridpoints north of 20◦N only.
5 The temperature response as a function of timescale: proxy-based reconstructions
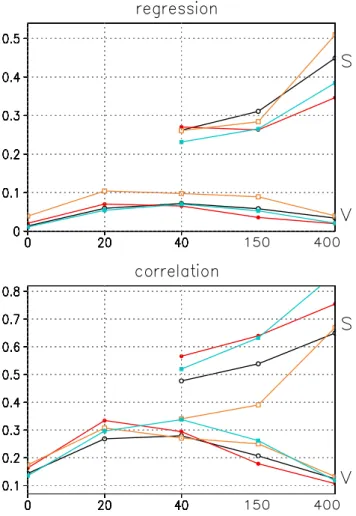
The regression on the solar forcing is found to be consis-tent among five of the reconstructed temperature records. For these records Rsolseems to have equilibrated for interdecadal timescales, with very similar values for low-pass filter peri-ods of 40 and 150 yr. However, a higher value is found for the 400 yr low-pass filtered data. The results for four of these records, which have similar amplitudes, are shown in Fig. 5. The Mo05 record has a similar timescale dependence, but its regression is higher by a factor of two. Two other records show small negative Rsol for all filter periods. No attempt was done to correct the regression on the solar forcing for the effect of volcanic forcing on the reconstructed tempera-tures, as there is some ambiguity in determining the reduced record without a clear response to volcanic eruptions at an-nual timescales. The model results indicate that the timescale dependence of Rsolis not affected by this, although its am-plitude may be somewhat overestimated.
14 S. L. Weber: NH temperature response to solar and volcanic forcing
Table 1. The regression R of the reconstructed NH temperatures on the solar forcing for the 40–120 yr band-pass filtered data, the 400-yr
low-pass filtered data and the ratio between these two. The regression on the volcanic forcing for the 400-yr low-pass filtered data and the linear trend in the reconstructed temperature records over the pre-anthropogenic period.
Cr00 Ma99 Jo98 Br00 Es02 Ma03 Mo05
R40−120 yrsol (◦C per W/m2) 0.21 0.33 0.34 0.27 0.17 0.22 0.57
R400+yrsol (◦C per W/m2) 0.45 0.35 0.51 0.05 −0.03 0.38 1.29 ratio 2.15 1.06 1.49 0.20 −0.18 1.71 2.28
R400+yrvolc (◦C per W/m2) 0.03 0.02 0.04 0.03 0.02 0.02 0.08 linear trend (◦C per 1000 yr) −0.30 −0.20 −0.33 −0.17 −0.07 −0.19 −0.71
Fig. 5. Same as Fig. 3, but now for the reconstructed temperature
records of Jo98 (orange line), Ma99 (red line), Ma03 (greenblue line) and Cr00 (black line). Note that the vertical scale range is the same as in Fig. 3
The present empirical equilibration timescale is consis-tent with an earlier estimate based on one reconstructed tem-perature record and the solar forcing for the time interval 1650–1850 AD (Waple et al., 2002). It is also compatible
with the timescale indicated by the ECBilt model. The rela-tively high values of Rsolfor the 400 yr low-pass filtered data are therefore surprising. In order to examine the response to the solar forcing in more detail, the regression is consid-ered separately over several timescale bands. In the timescale range 40–120 yr the regression is consistent among all seven records. Values are given in Table 1. They range between 0.17 and 0.34◦C per W/m2, with an outlier of 0.57◦C per
W/m2for the Mo05 record. Similar values are found when smaller timescale bands are chosen within the interdecadal-centennial range, which can be assumed to be reasonably well resolved in a 850-yr record. Therefore, we tentatively conclude that these values represent the equilibrium regres-sion of the reconstructed temperatures on the solar forcing.
Considering the longest temporal scales, it is found that regressions diverge substantially. This range is certainly not well resolved because of the limited record length. The two tree-ring based records exhibit regressions (and correlations) that are close to zero in this range. The other records have anomalous high regressions (and large positive correlations) at these timescales. The ratio between Rsol400+yrand Rsol40−120 yr is given in Table 1 as well. It varies between 1.1 and 2.3. A similar timescale dependence as shown in Fig. 5 is found when computing Rsol from the linearly detrended tempera-ture and solar forcing records. This indicates that this behav-ior is not solely due to the trend component, but that varia-tions on all timescales longer than 400 yr contribute to it.
The regression on the volcanic forcing is consistent among all seven records, both in its timescale dependence and its amplitude. The maximum Rvolc occurs mostly for the 20-yr pass filtered data (in some records for the 40-20-yr low-pass filtered data). After that, Rvolc decreases continuously for increasing filter periods. As in the model, temperatures relax back to normal values within 5–10 yr after an eruption so that the system never equilibrates. Very low regressions are found for the unfiltered data. Clearly the reconstructed temperatures do not capture the strong response to volcanic eruptions at annual timescales, which is also evident from the composite response to all individual eruptions shown in
Fig. 2. Taking this into account, the timescale dependence of
Rvolcis very similar in the data and in the model simulations. It is clear from Fig. 5 and Table 1 that the amplitudes of
Rvolc and Rsolvary among the seven different records. This may be related to differences in geographical coverage and seasonality of the underlying proxy dataset or differences in calibration methods (Esper et al., 2005). However, the timescale dependence is very similar for all records in the case of Rvolc. Tentatively, we conclude that this is also true for Rsol, considering the interdecadal-centennial timescale range and the trend component separately. As in the model runs, Rvolcis lower than Rsolfor all timescales.
It is of interest to compare the linear trend in the re-constructed temperature records directly with those in the forcing factors. The linear trends (over the 1000–1850 AD period) in the solar and volcanic forcing are −0.15 and
−0.19 10−3W/m2, respectively. Assuming that R sol has equilibrated at the interdecadal-centennial range, this implies a temperature decline of 0.03–0.09◦C (per 1000 yr). Assum-ing furthermore that Rvolcis 0.1 at most at multi-centennial timescales, the volcanic forcing adds a negative trend of 0.02◦C to this. The implied combined trend is in all cases lower than the linear trends given in Table 1 for the recon-structed temperature records.
The correlations for the reconstructed records are shown as well in Fig. 5. Basically there is a similar timescale de-pendence as in the model, although overall values are lower. This is not surprising, as the reconstructed forcings are used to drive the model runs. Consequently, they optimally fit the simulated temperatures. In the case of the proxy data, both the forcings and the temperatures are only an estimate of the true historical records (Jones and Mann, 2004). The timescale separation between the influence of volcanic and solar forcing is more rigorous in the model than in the data. This is partly due to the lack of a strong volcanic signal at annual timescales in the proxy data. The lag at which the op-timum correlation occurs increases for increasing filter peri-ods. Lags are somewhat longer in the data than in the model, ranging over 0–20 yr (volcanic forcing) and 10–20 yr (solar forcing).
It is difficult to establish the statistical significance of the correlations, because the number of independent samples is not clear a priori. Most reconstructions have a substantial number of proxy records in common, while a few are mainly (but not exclusively) based on independent data. Therefore, the number of independent NH temperature reconstructions lies between one and seven. In contrast, the four model simu-lations are independent of each other, so that even small cor-relations are significant due to the relatively large number of samples. Considering each temperature reconstruction sepa-rately, a one-sided t-test gives the following results. Correla-tions with the solar forcing are significant at the 10% level for the low-pass filtered data for those reconstructions that have a positively correlated trend component. In case of the band-pass filtered data correlations are lower, making them mostly
just below the 10% significance level. The correlations with the volcanic forcing are significant for the unfiltered and 20-yr low-pass filtered data. They cease to be significant for the 40-yr or 150-yr low-pass filtered data, depending on the record. Clearly the lowest correlations found in the data do not pass this simple significance test. However, the seven temperature reconstructions show a reasonable agreement among each other with respect to the timescale dependence of correlations. In addition, the similarity between model-based and data-derived results is a strong indication of their validity.
6 Discussion and conclusions
The present analysis shows a close agreement between the timescale dependence of the response of simulated and re-constructed temperature records to the external forcing fac-tors. The regression on the volcanic forcing is maximum at decadal timescales, while it goes to zero at the longest temporal scales. The response to the volcanic forcing never equilibrates, as the time interval between two eruptions is typically larger than the dissipation timescale of the sys-tem. This implies that Rvolc is much lower than Rsolfor all timescales. The regression on the solar forcing equilibrates at interdecadal timescales in the model simulations, with an equilibrium value of ca. 0.30◦C per W/m2. This seems to be the case in the reconstructions also, although there are some ambiguities in the timescale dependence of the regression.
The best agreement in Rsol is seen between those recon-structions that have some overlap between the underlying datasets (Cr00, Ma99, Jo98 and Ma03). In these records
Rsol does not depend on the timescale in the interdecadal-centennial range, but has a relatively large value at multi-centennial timescales. A similar timescale dependence, but a larger overall amplitude of Rsol, is found in Mo05. The timescale separation between the high-frequency and the low-frequency components of this record lies at 80 yr (Moberg et al., 2005), a timescale which is well below that at which Rsolis found to rise in the present analysis. Finally, the two tree-ring based reconstructions (Br00 and Es02) show little correlation with the solar forcing at multi-centennial timescales. Restricting the analysis to the interdecadal-centennial range by band-pass filtering the solar forcing and temperature records gives consistent results for all seven re-constructions. In this range the regression has indeed equili-brated. The estimated equilibrium regression is 0.2–0.35◦C
per W/m2for the six records that are calibrated by regression methods. It is about twice as large (0.57◦C per W/m2) for the Mo05 record that is calibrated by variance scaling.
The equilibrium regressions found in the model and in the data imply a climatic sensitivity of 0.3–0.8◦C per W/m2, as-suming a global albedo of 30%. This is relatively low com-pared to IPCC estimates of 0.5–1.1◦C per W/m2 (Cubasch et al., 2001). In the model the climatic sensitivity does not
16 S. L. Weber: NH temperature response to solar and volcanic forcing depend much on the type of forcing. Assuming that a CO2
doubling results in an estimated forcing of 3.7 W/m2(Myhre et al., 1998), the presently found sensitivity of 0.43◦C per
W/m2 (regression of 0.3◦C per W/m2) implies an equilib-rium temperature change of 1.6◦C. This is close to the value of 1.7◦C found in the ECBilt model for a CO2doubling. EC-Bilt probably underestimates the true climatic sensitivity, due to the lack of positive feedbacks on the radiative forcing like the moisture feedback. The present analysis indicates that a number of reconstructed temperature records also have a cli-matic senstivity which is too low. Although overall values are thus low, trends over the pre-anthropogenic period are relatively large in all reconstructed temperature records.
The trends in the temperature reconstructions implied by the combined volcanic and solar forcing can be estimated as follows. In most records Rvolc<0.05 and Rsol<0.35◦C per W/m2at the longest temporal scales. The implied com-bined trend is −0.05 to −0.1◦C (per millenium) over the
pre-anthropogenic period, which is much lower than the trends of −0.1 to −0.3◦C actually found in the reconstructions (Ta-ble 1). Also, the trend of −0.7◦C in Mo05 is larger than that implied by the combined forcing. This indicates that the trends in the data cannot be explained from the volcanic and solar forcing, as claimed by Crowley (2000), while the trends in the model are fully consistent with the forcing. There are two alternative hypotheses for this discrepancy between the model and the data. Either other forcing factors play a role, which have not been taken into account in the model simu-lations, or the model lacks important feedbacks at the multi-centennial timescale.
Alternative forcing factors that have been put forward in the literature are deforestation prior to 1850 AD (Bauer et al., 2003) and orbital forcing (Mann et al., 1999). The latter forcing arises mainly due to a shift of the longitude of peri-helion relative to the moving Vernal Equinox (Berger, 1978), corresponding to a shift of ca. 17 days over the past mille-nium. It depends on latitude, affecting monthly temperatures rather than the annual-mean. The temperature regression was found to be Rorb=0.05◦C per W/m2at a lag of ca. 1 month in the ECBilt model (Weber and Oerlemans, 2003). This is con-sistent with a linear response that is far from equilibrium, as is appropriate for this slow modification of the seasonal cycle (forcing period of 1 yr). This value of Rorbimplies a quasi-linear trend in the mean temperature over latitudes north of 20◦N of 0.2◦C (May) to zero (July) to −0.25◦C (September), while values are larger for more northern latitudes. As NH temperature reconstructions are biased toward the warm sea-son and high northern latitudes, it is possible that orbital forc-ing plays a role. The amplitude of the orbital-forced trend is however difficult to establish, as it would depend on the mix-ture of seasonality and latitudinal location of the records in the underlying proxy network.
A number of feedbacks may modify the climatic re-sponse to the solar and volcanic forcing at multi-centennial timescales. The most likely candidates are changes in surface
albedo and in the ThermoHaline Circulation (THC) in the At-lantic ocean. The THC strength was found to be negatively correlated with the solar forcing in the ECBilt model (We-ber et al., 2004), implying a negative feedback on the high-latitude temperature response due to changes in the ocean heat transport. The effect is, however, weak. Albedo changes constitute a positive feedback. Snow and sea-ice changes are represented in the model, but may be too weak due to the sim-plicity of the sea-ice and land components. Albedo changes that are associated with the growth and decay of glaciers and small ice caps or shifts in vegetation zones are not repre-sented at all. Experiments with more comprehensive climate models should clarify whether these feedbacks play a role.
Recent work has shown that temperature reconstruc-tions, that are calibrated at annual-decadal timescales, tend to underestimate variability at multi-decadal and longer timescales (Von Storch et al., 2005). The present results indi-cate, however, that one should distinguish between different frequency bands. All reconstructed temperature records have a trend component that is relatively high compared to variations at multi-decadal timescales and the trend in the reconstructed forcing factors. A better assessment of the true shape of the temperature spectrum is needed to resolve this issue, possibly using low-resolution data to assess the longest timescales (Moberg et al., 2005). The present paper has analysed the forced component of climatic variability, assuming a linear response model. It is possble that internal feedbacks, which are not represented in the ECBilt climate model, strongly modify the response at multi-centennial timescales. This would imply that the relatively high recon-structed trend component is realistic, arising from volcanic and solar forcing alone. Alternatively, orbital forcing or land-use changes may explain this component. Finally, there may be a random coincidence between long-term trends in NH temperatures and the external forcings over the past millenium.
Edited by: U. Mikolajewicz
References
Bauer, E., Claussen, M., Brovkin, V., and Huenerbein, A.: Assess-ing climate forcAssess-ings of the Earth system for the last millenium, Geophys. Res. Lett., 30, 1276–1279, 2003.
Bard, E., Raisbeck, G., Yiou, F., and Jouzel, J.: Solar irradiance during the last 1200 years based on cosmogenic nuclides, Tellus, 52B, 985–992, 2000.
Berger, A.: Long-term variations of daily insolation and Quaternary climatic changes, J. Atmos. Sci., 35, 2362–2367, 1978. Briffa, K. R.: Annual variability in the Holocene: interpreting the
message of ancient trees, Quat. Sci. Rev., 19, 87–105, 2000. Crowley, T. J.: Causes of climate change over the past 1000 Years,
Science, 289, 270–277, 2000.
Crowley, T. J. and Kim, K.-Y.: Comparison of proxy records of climate change and solar forcing, Geophys. Res. Lett., 23, 359–
362, 1996.
Crowley, T. J. and Lowery, T. S.: How warm was the Medieval Warm Period?, Ambio, 29, 51–54, 2000.
Cubasch, U., Voss, R., Hegerl, G. C., Waskewitz, J., and Crowley, T. J.: Simulation of the influence of solar radiation variations on the global climate with an ocean-atmosphere general circulation model, Climate Dyn., 13, 757–767, 1997.
Cubasch, U., Meehl, G. A., Boer, G. J., Stouffer, R. J., Dix, M., Noda, A., Senior, C. A., Raper, S., and Yap, K. S.: Projections of future climate change, in: Climate Change 2001: The Scientific Basis, edited by: Houghton, J. T., Ding, Y., Griggs, D. J., et al., Cambridge Univ. Press, 2001, 881p, 2001.
Esper, J., Cook, E. R., and Schweingruber, F. H.: Low-frequency signals in long tree-ring chronologies for reconstructing past temperature variability, Science, 295, 2250–2253, 2002. Esper, J., Frank, D. C., Wilson, R. J. S., and Briffa, K. R.:
Effect of scaling and regression on reconstructed temperature amplitude for the past millenium, Geophys. Res. Lett., 32, doi:10.1029/2004GL021236, 2005.
Hegerl, G. C., Crowley, T. J., Baum, S. K., Kim, K.-Y., and Hyde, W. T.: Detection of volcanic, solar and greenhouse gas signals in paleo-reconstructions of Northern Hemisphere temperature, Geophys. Res. Lett., 30, 1242–1246, 2003.
Jones, P. D., Briffa, K. R., Barnett, T. P., and Tett, S. F. B.: High-resolution paleoclimatic records for the last millenium: interpre-tation, integration and comparison to control-run temperatures, The Holocene, 8, 455–471, 1998.
Jones, P. D. and Mann, M. E.: Climate over past millenia, Rev. Geophys., 42, doi:10.1029/2003RG000143, 2004.
Lean, J., Beer, J., and Bradley, R.: Reconstruction of solar irradi-ance since 1610: implications for climate change, Geophys. Res. Lett., 19, 3195–3198, 1995.
Mann, M. E., Bradley, R. S., and Hughes, M. K.: Global-scale tem-perature patterns and climate forcing over the past six centuries, Nature, 392, 779–787, 1998.
Mann, M. E., Bradley, R. S., and Hughes, M. K.: Northern Hemi-sphere temperatures during the past millenium: inferences, un-certainties and limitations, Geophys. Res. Lett., 26, 759–762, 1999.
Mann, M. E. and Jones, P. D.: Global surface temperatures over the past two millenia, Geophys. Res. Lett., 30, 1820–1823, 2003. Moberg, A., Sonechkin, D. M., Holmgren, K., Datsenko, N. M., and
Karlen, W.: Highly variable Northern Hemisphere temperatures reconstructed from low- and high-resolution data, Nature, 433, 613–617, 2005.
Myhre, G., Highwood, E. J., Shine, K. P., and Stordal, F.: New es-timates of radiative forcing due to well mixed greenhouse gases, Geophys. Res. Lett., 25, 2715–2718, 1998.
Von Storch, H., Zorita, E., Jones, J., Dimitirev, Y., Gonzalez-Rouco, F., and Tett, S.: Reconstructing past climate from noisy data, Science, 306, 679–682, 2005.
Waple, A. M., Mann, M. E., and Bradley, R. S.: Long-term patterns of solar irradiance forcing in model experiments and proxy based surface temperature reconstructions, Clim. Dyn., 18, 563–578, 2002.
Weber, S. L. and Oerlemans, J.: Holocene glacier variability: three case studies using an intermediate-complexity climate model, The Holocene, 13, 353–363, 2003.
Weber, S. L., Crowley, T. J., and Van der Schrier, G.: Solar irradiance forcing of centennial climate variability during the Holocene, Clim. Dyn., 22, 539–553, 2004.
White, W. B., Cayan, D. R., and Lean, J.: Global upper ocean heat storage response to radiative forcing from changing solar irra-diance and increasing greenhouse gas/aerosol concentrations, J. Geophys. Res., 103, 21 355–21 366, 1998.