HAL Id: hal-00317201
https://hal.archives-ouvertes.fr/hal-00317201
Submitted on 1 Jan 2003
HAL is a multi-disciplinary open access
archive for the deposit and dissemination of
sci-entific research documents, whether they are
pub-lished or not. The documents may come from
teaching and research institutions in France or
abroad, or from public or private research centers.
L’archive ouverte pluridisciplinaire HAL, est
destinée au dépôt et à la diffusion de documents
scientifiques de niveau recherche, publiés ou non,
émanant des établissements d’enseignement et de
recherche français ou étrangers, des laboratoires
publics ou privés.
Study of mid-latitude nighttime enhancement in
F-region electron density using tomographic images over
the UK
R. S. Dabas, L. Kersley
To cite this version:
R. S. Dabas, L. Kersley. Study of mid-latitude nighttime enhancement in F-region electron density
using tomographic images over the UK. Annales Geophysicae, European Geosciences Union, 2003, 21
(12), pp.2323-2328. �hal-00317201�
Annales Geophysicae (2003) 21: 2323–2328 c European Geosciences Union 2003
Annales
Geophysicae
Study of mid-latitude nighttime enhancement in F-region electron
density using tomographic images over the UK
R. S. Dabas1and L. Kersley2
1Radio and Atmospheric Sciences Division, National Physical Laboratory, New Delhi-110012, India 2Department of Physics, University of Wales, Aberystwyth, SY23, 3BZ, UK
Received: 27 August 2002 – Revised: 24 April 2003 – Accepted: 13 May 2003
Abstract. Nighttime enhancements in ionospheric electron
content (IEC)/peak electron density (NmF2) have been stud-ied by various workers in the equatorial anomaly and mid-latitude regions. Such studies give an idea about their en-hancement over that location only. In the present study tomo-graphic images over the UK, which give a latitudinal versus height distributions of ionospheric electron density in a much wider area, have been used to study the anomalous increases in nighttime F-region electron density at mid-latitudes. From the analysis of four seasonal representative months (Novem-ber 1997, March, June and Octo(Novem-ber 1998) data it was noted that the majority of the cases of nighttime enhancements were observed after local midnight, with a maximum be-tween 03:00–04:00 LT in the month of November 1997. En-hancements were observed mostly between 45–50◦N
lati-tudes, and their positions are not affected by magnetic activ-ity (Kp) variations, whereas the separation between the
mid-latitude trough and enhancement decreases with increases in magnetic activity. This finding shows that only the trough moves equatorward with the increase in magnetic activity. It is also noted that the electron density gradient from the trough to the enhancement increases with an increase in Kp.
Results are discussed in terms of downward plasma transport from the protonosphere to the ionosphere and the nighttime neutral winds.
Key words. Ionosphere (mid-latitude ionosphere; modeling
and forecasting; instruments and techniques)
1 Introduction
It has been known for a long time that both the Ionospheric Electron Content (IEC) and peak electron density of the F-region (NmF2) show anomalous nighttime enhancement, both in the equatorial anomaly region, as well as in the mid-latitude ionosphere and this has been studied by various
re-Correspondence to: R. S. Dabas
searchers (Evans, 1965; Davies et al., 1979; Janve et al., 1979; Essex and Klobuchar, 1980; Kersley et al., 1980; Joshi and Iyer, 1990; Bailey et al., 1991; Balan et al., 1991). In the equatorial anomaly region the primary source of such nighttime enhancement is the evening increase in the upward E × B drift at the equator (Anderson and Klobuchar, 1983; Balan et al., 1994). At mid-latitudes the primary source has been identified as a downward flow of plasma from the protonosphere to the ionosphere (Bailey et al., 1991). In addition, neutral air winds modulate these enhancements at all latitudes (Anderson and Klobuchar, 1983; Bailey et al., 1991). At mid-latitudes Essex and Klobuchar (1980) re-ported that nighttime IEC enhancements, which they ob-served mostly around 03:00 LT during the December months, are accompanied by large increases in peak density of the F layer and a lowering of layer height, which shows that the enhancement takes place in the F-region of the ionosphere. Use of IEC and NmF2 in such studies tells us about such en-hancements over that particular location only, but in reality, it is observed in a wider area in space. Therefore, it is difficult to tell exactly where in the latitude range its peak occurs. In the recent past the technique of tomographic imaging of the ionosphere, which gives latitude versus height distribu-tion of ionospheric electron density, has proved its potential in studying the ionospheric properties, like the mid-latitude trough (Kersley et al., 1997; Pryse et al., 1998 and references therein), as well as its modeling in a much wider area. In the present study tomographic images over the UK have been used to study the anomalous increases in nighttime F-region electron density at mid-latitudes.
2 Data and results
Ionospheric tomography uses total electron content measure-ments made at a linear chain of stations, aligned approxi-mately along a common geographic meridian. The observa-tions are then reconstructed in an inversion algorithm to cre-ate an image of the spatial distribution of the electron
den-2324 R. S. Dabas and L. Kersley: Mid-latitude nighttime enhancement in F-region electron density
Figure 1
Fig. 1. Map showing the locations of the sites with tomography receiving equipment in the UK.
sity as a function of latitude and height. The chain of five automated receiving stations in the UK (Dartmouth, Aberys-twyth, Hawick, Lossiemouth and Unst), shown by circles in Fig. 1, monitored the phase-coherent radio signals on 150 and 400 MHz, transmitted by satellites in the Navy Iono-spheric Monitoring System (NIMS), to measure the total electron content (TEC) along many intersecting ray paths. Further information on the development of experimental ra-dio tomographic imaging can be found in many publications, including Kersley and Pryse (1994), Walker et al. (1996), and Kersley et al. (1997). The tomographic images used in the present study were reconstructed by the DIT/ART method, discussed in earlier papers, and created in a pixelised grid of some 0.25◦in latitude and 15 km in altitude. The Discrete Inversion Theory (DIT) procedure described by Fremouw et al. (1992) was used to reconstruct the large-scale background features in the ionosphere, while subsequent processing by the Algebraic Reconstruction Technique (ART) formed the smaller scale density structures. In the present study four months of data (November 1997, March, June and October 1998), roughly representing different seasons, has been used to study the nighttime enhancement in ionospheric electron density over mid-latitudes. Two examples of the nighttime enhancements observed on 16 October 1998 at 02:17 UT and 27 November 1998 at 00:17 UT, along with the mid-latitude troughs, are shown in Figs. 2a and b, which clearly show a well-defined increase in F-region electron density around 50◦N latitude, around 300 km altitude in the first case and
around 47◦N latitude in the second case, whereas the trough
locations were around 62◦N and 60◦N, respectively. Both
these days were magnetically quiet days, and Kp was one
and zero, respectively. During the period of four months of data reported here, a total of 46 cases of nighttime enhance-ment in F-region electron density were observed. From the analysis of data we observed the following main points:
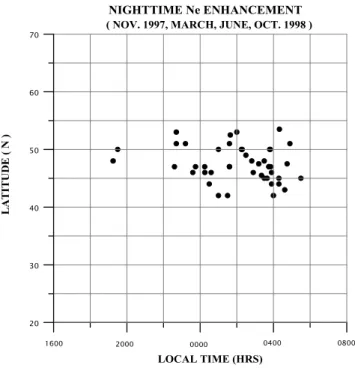
(a) It is noted that at mid-latitude the largest number of cases of nighttime enhancement in peak electron den-sity (NmF2) were observed after local midnight with a maximum occurrence between 03:00 to 04:00 LT (see Fig. 3a). In the months of March and June 1998 only a few cases of enhancements are observed and the ma-jority of them are observed in the months of October 1998 and November 1997 only (see Fig. 3b). During the period of four months of observation reported here, F10.7 cm flux values varied from 90 to 130 only. (b) Figure 4 shows the plot of the latitudes of peak electron
density enhancements versus local time. From the fig-ure it is noted that enhancements in peak electron den-sity are observed mainly between 42–53◦N latitudes, centered around 48◦N and most of these cases occurred
after local midnight.
(c) To examine the effect of magnetic activity on their lat-itudinal occurrence, the average values of the latitude of the enhancement corresponding to each Kplevel are
R. S. Dabas and L. Kersley: Mid-latitude nighttime enhancement in F-region electron density 2325
Figure 2 (a)
Figure 2 (b)
Fig. 2. Examples of mid-latitude nighttime enhancements in F-region electron density of the ionosphere, along with the occurrences of the
2326 R. S. Dabas and L. Kersley: Mid-latitude nighttime enhancement in F-region electron density 0 4 8 12 16 20 T O TA L N U MB ER O F C A S E S LOCAL TIME
NIGHT TIME Ne ENHANCEMENT
19-20 20-21 22-23 23-00 00-01 01-02 02-03 03-04 04-05 05-06
( NOV.1997, MARCH, JUNE, OCT.1998 )
21-22 Figure 3 (a) (a) 0 10 20 30 NUM B E R OF CA S E S MONTHS
MARCH-98 JUNE-98 OCT.-98 NOV.-97 NIGHT TIME Ne ENHANCEMENT
Figure 3 (b)
(b)
Fig. 3. Histograms showing (a) local time occurrences of nighttime enhancements and (b) their monthly occurrences during the four
representative months.
plotted as a function of Kp, as shown in Fig. 5. It is
noted that their latitudinal position is hardly affected by increases in magnetic activity i.e. Kp.
(d) The latitudinal separation between the mid-latitude trough minimum and the peak enhancement is also cal-culated in each case and the average values of this sep-aration within each Kp level are calculated and plotted
against Kp in Fig. 6. It is noted that the latitude
sep-aration between mid-latitude trough and the nighttime enhancement decreases with the increase in magnetic activity, Kp. This is due to the fact that with the
in-crease in magnetic activity the trough position shifted equatorward.
(e) The electron density gradient between the trough min-imum and the peak enhancement is also calculated in each case by dividing the difference in electron density between them by the latitudinal separation between the two. The mean value of the gradients is calculated at each Kplevel, i.e. 0, 1, 2 etc. and when these average
are plotted against Kp (see Fig. 7), it is noted that the
value of the gradient increases with the increase in Kp.
This is due to the fact that with the increase in Kp, the
trough position moves towards equatorward without af-fecting the enhancement location and thereby increases the electron density gradients from trough minimum to peak enhancement.
3 Discussion
From the results described in the previous section it is noted that most of the cases of nighttime enhancements in ionospheric electron density are observed during the winter month of November 1997 in the post-midnight hours, with a maximum between 03:00–04:00 LT. Latitude-wise major-ity of them were observed between 45◦ to 50◦N latitudes, and their positions are least affected by the variations in the Kpvalues. These results are in line with those reported by
other workers, e.g. Davies et al. (1979); Essex and Klobuchar (1980); Balan et al. (1994), except that local time occur-rences vary. Important mechanisms for nighttime enhance-ments at mid-latitudes are field-aligned plasma flow, cross-L plasmaspheric compression and neutral air winds interac-tions. In the winter hemisphere the field-aligned plasma flow is downwards, i.e. from protonosphere to the ionosphere, particularly during post-midnight hours, and the duration of the downward flow decreases with increasing solar activity (Evans and Holt, 1978). Thus, the protonosphere supplies ionization to the winter hemisphere. Down diffusion can be enhanced by cross L-plasmaspheric compression, since a westward electric field will move plasma from higher L-shells with the subsequent effect that the plasma pressure in the lower L-shells will increase. The effect of the ex-cess plasma pressure is to increase the downward diffusion of plasma, which, in turn, increases the ionospheric content at both ends of the L-shell (Davies et al., 1979). At mid-latitudes during all seasons the meridonal neutral wind is equatorward during nighttime and attains its maximum speed
R. S. Dabas and L. Kersley: Mid-latitude nighttime enhancement in F-region electron density 2327 20 30 40 50 60 70 LOCAL TIME (HRS) 1600 2000 0000 0400 0800 LA TIT U D E ( N ) NIGHTTIME Ne ENHANCEMENT ( NOV. 1997, MARCH, JUNE, OCT. 1998 )
Figure 4
Fig. 4. Plot showing the latitudes of nighttime enhancements versus
local time.
at around midnight (Hernandez and Roble, 1984). Thus, the strong downward diffusion of plasma from the protono-sphere, combined with the neutral air winds interactions, can easily produce enhancements in nighttime ionospheric elec-tron density at mid-latitudes during winter at solar minimum. Bailey et al. (1990a) have modeled winter nighttime values of TEC for ray paths, which traverse the mid-latitude iono-sphere. The modeled values for magnetically quiet solar min-imum conditions show enhancements, which peak during the post-midnight period, when the downward flow of plasma through the 2500 km altitude level exceeds that which is lost chemically at lower altitudes. The enhancements are found to be strong near 40◦latitude and weak near 60◦latitude. The results of these authors are in agreement with the present ob-servations.
4 Summary
Ionospheric tomography uses TEC measurements at a chain of stations along a common meridian, to produce an im-age of the spatial distribution of the electron density as a function of latitude and height. As compared to other tech-niques the main advantage in ionospheric tomography is that it gives a snapshot picture of latitudinal versus height dis-tributions of ionospheric electron density in a much wider area and is useful to characterize large-scale ionospheric fea-tures, like mid-latitude trough, ionization anomaly etc. The present study utilized the tomographic images over the UK to study the anomalous increases in nighttime F-region elec-tron density at mid-latitudes. It is observed that the majority
0 2 4 6 8 30 40 50 60 70 Kp ENHANCE M ENT LATI TUDE ( N ) NIGHTTIME Ne ENHANCEMENT
( NOV. 1997, MARCH, JUNE, OCT. 1998 )
Figure 5
Fig. 5. Variations of enhancement latitudes with Kp. Average of
latitudes with each Kpindex are plotted here.
0 2 4 6 8 10 0 4 8 12 16 20
NIGHT TIME Ne ENHANCEMENT
Kp TROUGH A ND ENHAN C EME N T SE PARAT ION ( DE G S .) CC=0.87
(NOV. 1997, MARCH, JUNE, OCT. 1998)
Figure 6
Fig. 6. Variations of latitudinal separation between trough
mini-mum and peak enhancement with Kp. Here, again, average values
with each Kpindex are shown.
of the cases of nighttime enhancements were observed after local midnight, with a maximum between 03:00–04:00 LT in the month of November 1997. Latitudinally these were confined to primarily between 45–50◦N, and their positions
2328 R. S. Dabas and L. Kersley: Mid-latitude nighttime enhancement in F-region electron density 0 2 4 6 8 0.00 0.20 0.40 0.60 Kp N e GRAD IE NT (x 10 * *11/ m* *3 /d eg ) NIGHTTIME Ne ENHANCEMENT
( NOV. 1997, MARCH, JUNE, OCT. 1998 )
CC=0.85
Figure 7
Fig. 7. Variations in electron density (Ne) gradients from trough
minimum to peak enhancement with Kp.
were not affected by magnetic disturbances, whereas the sep-aration between the mid-latitude trough and the enhancement decreases with increases in magnetic activity, indicating the equatorward movement of the trough with the increases in magnetic activity, producing a sharp electron density gra-dient from trough to enhancement. It is concluded that the ionospheric tomography technique gives a better representa-tion of the regional structure of the ionosphere.
Acknowledgements. RSD acknowledge the support of the
Lever-hulme Trust in the provision of a Fellowship to work at UWA. The experimental observations used in the present study were supported in part by DERA, Malvern, UK.
Topical Editor M. Lester thanks S. Radicella and R. Leitinger for their help in evaluating this paper.
References
Anderson, D. N. and Klobuchar, J. A.: Modeling the total electron content observations above Ascension Island, J. Geophys. Res. 88, 8020–8024, 1983.
Balan, N., Bailey, G. J., and Balachandran Nair, R.: Solar and mag-netic activity effects on the latitudinal variations of nighttime TEC enhancement, Ann. Geophysicae, 9, 60–69, 1991.
Balan, N., Bailey, G. J., Balachandran Nair, R., and Titheridge, J. E.: Nighttime enhancement in ionospheric electron content in the northern and southern hemispheres, J. Atmos. Terr. Phys., 56, 67–79, 1994.
Bailey, G. J., Sellek, R., and Balan, N.: A modeling study of nighttime enhancements in TEC during winter at solar mini-mum. Proc. URSI International Beacon Satellite Symposium, Tucuman, Argentina, March 1990, 229–236, 1990a.
Bailey, G. J., Sellek, R., and Balan, N.: The effect of inter-hemispheric coupling on nighttime enhancements in ionospheric total electron content during winter at solar minimum, Ann. Geo-physicae, 9, 738–747, 1991.
Davies, K., Anderson, D. N., Paul, A. K., Degenhardt, W., Hart-mann, G. K., and Leitinger, R.: Nighttime increases in total elec-tron content observed with the ATS6 radio beacon, J. Geophys. Res. 84, 1536–1542, 1979.
Essex, E. A. and Klobuchar, J. A.: Mid-latitude winter nighttime increases in the total electron content of the ionosphere, J. Geo-phys. Res. 85, 6011–6020, 1980.
Evans, J. V.: Cause of the mid-latitude winter night increase in foF2, J. Geophys. Res.70, 4331–4346, 1965.
Evans, J. V. and Holt, J. M.: Nighttime proton flux at Millstone Hill, Planet. Space Sci., 26, 727–744, 1978.
Fremouw, E. J., Secan, J. A., and Howe, B. M.: Application of stochastic inversion theory to ionospheric tomography, Radio Sci., 17, 721–732, 1992.
Hernandez, G. and Roble, R. G.: The geomagnetic quiet nighttime thermospheric wind pattern over Fritz Peak observatory during solar cycle minimum and maximum, J. Geophys. Res., 89, 327– 337, 1984.
Janve, A. V., Rai, R. K., Deshpande, M. R., Rastogi, R. G., Jain, A. R., Singh, M., and Grum, H. S.: On the nighttime enhance-ment in ionospheric total electron content at low latitudes, Ann. Geophysicae, 35, 159, 1979.
Joshi, H. P. and Iyer, K. N.: On the nighttime anomalous enhance-ment in ionospheric electron content at lower mid-latitude during solar maximum, Ann. Geophysicae, 8, 53, 1990.
Kersley, L., Aarons, J., and Klobuchar, J. A.: Nighttime enhance-ment in total electron content near Arecibo and their association with VHF scintillation, J. Geophys. Res., 85, 4214, 1980. Kersley, L. and Pryse, S. E.: The development of experimental
iono-spheric tomography, Int. J. Image Syst. Technol., 5, 141–147, 1994.
Kersley, L., Pryse, S. E., Walker, I. K., Heaton, J. A. T., Mitchell, C. N., Williams, M. J., and Willson, C.A.: Imaging of electron den-sity troughs by tomographic techniques, Radio Sci., 32, 1607– 1621, 1997.
Pryse, S. E., Kersley, L. Williams, M. J., and Walker, I. K.: The spatial structure of the dayside ionospheric trough, Ann. Geo-physicae, 16, 1169–1179, 1998.
Walker, I. K., Heaton, J. A. T., Kersley, L., Mitchell, C. N., Pryse, S. E., and Williams, M. J.: EISCAT verification in the development of ionospheric tomography, Ann. Geophysicae, 14, 1413–1421, 1996.