HAL Id: hal-00295580
https://hal.archives-ouvertes.fr/hal-00295580
Submitted on 17 Jan 2005
HAL is a multi-disciplinary open access
archive for the deposit and dissemination of
sci-entific research documents, whether they are
pub-lished or not. The documents may come from
teaching and research institutions in France or
abroad, or from public or private research centers.
L’archive ouverte pluridisciplinaire HAL, est
destinée au dépôt et à la diffusion de documents
scientifiques de niveau recherche, publiés ou non,
émanant des établissements d’enseignement et de
recherche français ou étrangers, des laboratoires
publics ou privés.
nitrate (PAN) vapour
G. Allen, J. J. Remedios, D. A. Newnham, K. M. Smith, P. S. Monks
To cite this version:
G. Allen, J. J. Remedios, D. A. Newnham, K. M. Smith, P. S. Monks. Improved mid-infrared
cross-sections for peroxyacetyl nitrate (PAN) vapour. Atmospheric Chemistry and Physics, European
Geo-sciences Union, 2005, 5 (1), pp.47-56. �hal-00295580�
Atmos. Chem. Phys., 5, 47–56, 2005 www.atmos-chem-phys.org/acp/5/47/ SRef-ID: 1680-7324/acp/2005-5-47 European Geosciences Union
Atmospheric
Chemistry
and Physics
Improved mid-infrared cross-sections for peroxyacetyl nitrate
(PAN) vapour
G. Allen1, J. J. Remedios1, D. A. Newnham2,*, K. M. Smith2, and P. S. Monks3
1EOS, Space Research Centre, Department of Physics and Astronomy, University of Leicester, Leicester, LE1 7RH, UK 2Space Science and Technology Department, Rutherford Appleton Laboratory, Didcot, Oxon, OX11 0QX, UK
3Department of Chemistry, University of Leicester, Leicester, LE1 7RH, UK
*now at: TeraView Limited, Platinum Building, St John’s Innovation Park, Cambridge, CB4 0WS, UK
Received: 8 July 2004 – Published in Atmos. Chem. Phys. Discuss.: 22 September 2004 Revised: 4 January 2005 – Accepted: 5 January 2005 – Published: 17 January 2005
Abstract. Absorption spectra of peroxyacetyl nitrate (PAN,
CH3C(O)OONO2)vapour at room temperature (295K) have
been measured in the mid-infrared range, 550–2200 cm−1 (18.2–4.55 µm), using a Fourier Transform infrared spec-trometer at instrument resolutions of 0.25 and 0.03 cm−1
(unapodised). Between five and eight measurements were obtained for each spectral band of PAN in the pressure range 0.24–2.20 mb showing good agreement with Beer’s law. Both cross-section data and integrated absorption inten-sities for the five principal bands in the PAN spectra in this spectral range have been derived with peak cross-sections of the 794, 1163, 1302, 1741 and 1842 cm−1bands measured to be 0.95(±0.02), 1.21(±0.03), 0.92(±0.02), 2.39(±0.06) and 0.74(±0.03) (×10−18cm2molecule−1) respectively. Band intensities and band centre absorptivities are also reported for four weaker PAN absorption bands in the mid infrared for the first time. These observations are the highest spec-tral resolution measurements of PAN bands reported in the infrared to date. For three of the five strongest bands, the ab-solute integrated absorption intensities are in excellent agree-ment with previous studies. A 4.8% lower integrated inten-sity was found for the 1741 cm−1νas(NO2)PAN absorption
band, possibly as a result of the removal in this work of spec-tra affected by acetone contamination, while a 10.6% higher intensity was determined for the 1163 cm−1ν(C-O) tion band. No resolution of fine structure in the PAN absorp-tion bands was observed at the resoluabsorp-tions studied. The con-firmation of absorption cross-sections and estimated errors in this work will allow more accurate investigations of PAN us-ing infrared spectroscopy, particularly for remote sensus-ing of PAN in the atmosphere.
Correspondence to: G. Allen
1 Introduction
Peroxyacetyl nitrate (PAN) is an important atmospheric trace species through its role as a reservoir of the active nitrogen compound, NO2, and through its impact on the oxidising
po-tential of the atmosphere. The PAN compound is formed in the atmosphere by the oxidation of acetaldehyde and further reaction with nitrogen dioxide (Singh, 1987). In the atmo-sphere, the highest concentrations of PAN are often found in so-called photochemical smog episodes, such as Los Ange-les smog events where it was first noted by Stephens (1956). The chief loss mechanism for PAN in the lower troposphere is thermolysis, which occurs readily at temperatures above 273 K with a PAN lifetime of a matter of hours (Kirchener et al., 1999). However, this thermolysis rate drops quickly with temperature allowing lifetimes in the order of months against thermolysis in the cold upper troposphere (of order 200 K). In this region of the atmosphere, the photolysis rate becomes dominant and hence the species can be an important indi-cator of the photochemical age of polluted airmasses. The long lifetime of PAN in the upper troposphere allows it to transport NO2over wide areas, taking NO2from polluted
re-gions and releasing it in remote pristine locations where ac-tive nitrogen chemistry can influence the production of sur-face ozone (Olszyna et al., 1994). PAN concentrations as high as 650 pptv are regularly seen in pollution plumes such as those observed by Roberts et al. (2004) in Asian plumes as part of the Intercontinental Transport and Chemical Trans-formation 2002 (ITCT 2K2) project.
It has now become clear that PAN is one of the most important reservoirs of active nitrogen in the troposphere and, in some regions, is the dominant form of odd nitrogen, NOy (where NOy=NO+NO2+reservoir compounds). PAN
also has an effect on the oxidising power of the atmosphere through its reaction with the hydroxyl radical, OH (Taluk-dar et al., 1995). In the atmosphere, PAN has only been
Table 1. Configuration of the Bruker IFS120 HR spectrometer for
PAN vapour sample measurements. Spectrometer Configuration
Resolution (nominal) 0.03/0.25 cm−1
Beamsplitter Ge/potassium bromide (KBr) FTIR input aperture 1.0 mm
Detectors Broadband liquid nitrogen-cooled mercury cadmium telluride (MCT-D316),DLaTGS
Source Globar
Gas cell 26.1 cm glass (evacuable) Cell windows Wedged KBr
measured by in situ studies such as those made by Gas Chro-matography Electron Capture Detection (GC-ECD) tech-niques (Tanimoto et al., 1999) during aircraft campaigns such as those detailed by Emmons et al., (1997). The typically low concentrations of PAN (<100 pptv) make it difficult to detect by these methods and errors remain high (typically 30%), with a limit of detection of around 50 pptv. New satel-lite missions could provide an alternative means to remotely detect trace organic species on a global scale through their characteristic infrared signature. The Michelson Interferom-eter for Passive Atmospheric Sounding (Nett et al., 2001) on-board the European Space Agency’s Envisat platform (Louet, 2001) launched in March 2002, is one such instrument to exploit the potential of using infrared limb emission spec-tra measured at high specspec-tral resolution to retrieve profile in-formation for trace atmospheric species (Fischer and Oelhaf, 1996).
The retrieval of concentration data from satellite-derived spectra requires accurate reference cross-sections measured in the laboratory at sufficiently high spectral resolution. The high resolution is important for two reasons: 1) accurate calculation of radiative transfer in the atmosphere requires knowledge of spectroscopic behaviour to within the typical separations of overlapping lines (less than 0.1 cm−1 for the troposphere where PAN is important); 2) the MIPAS instru-ment has an unapodised spectral resolution of 0.025 cm−1 and is therefore sensitive to spectral detail at this level. Thus appropriate data for PAN is a prerequisite for studies to ex-amine the spectral signature of this gas in infrared remote sensing data.
In this paper, we report the first data for the infrared ab-sorption cross-sections of PAN vapour to be obtained at spec-tral resolutions greater than 0.1 cm−1. The new spectral data for PAN will allow greater confidence in identification of PAN effects in infra-red spectra ranging from the MIPAS ex-ample discussed here to air quality measurements to labora-tory investigations of PAN and related compounds.
It is not possible to yet ascribe general detection limits for PAN by FTIR remote sensing due to the variability in FTIR
instrument performance (e.g. resolution and sample path-length), however the 794 and 1163 cm−1 absorption bands
of PAN are likely to be of particular interest for remote sens-ing applications as these spectral regions are not saturated by strong atmospheric absorbing compounds such as water vapour in the upper tropopause (8–15 km) region.
2 Experimental details
The spectra presented here were recorded using the Bruker IFS 120HR Fourier transform infrared (FTIR) spectrometer at the Molecular Spectroscopy Facility, Rutherford Appleton Laboratory, UK. The configuration of the instrument for the measurements reported here is listed in Table 1. A Fourier Transform spectrometer is employed here for its ability to si-multaneously measure the wide spectral range required for the broad absorption bands of PAN (typically greater than 40 cm−1). The IFS 120 HR spectrometer is noted to give
excellent radiometric accuracy in comparison to other FTIR instruments and is not observed to be subject to significant er-ror such as the warm aperture problem (Johnson et al., 2002). The apparatus consisted of an evacuated 26.1 cm path length glass absorption cell equipped with potassium bromide win-dows interfaced to a customised gas handling vacuum line.
Three overlapping spectral regions in the mid-infrared were measured using appropriate optical and electronic fil-ters. The use of optical filters covering a narrow spec-tral range improves signal to noise and together with the choice of a small stop aperture (1.0 mm) and electronic fil-ter, greatly reduces the effects of detector non-linearity. Such non-linearity is manifest by the presence of a detected signal outside of the spectral region permitted by the optical filter or detector passband. No such signal was observed in any of the measurements reported in this paper. It was decided to remove the effects of non-linearity in this study, rather than to attempt removal of such errors later.
Both DLaTGS and liquid nitrogen cooled MCT detectors were used, giving excellent signal to noise over the region of interest (typically better than 500:1 after co-addition at 1740.5 cm−1and 450:1 at worst for the 794.0 cm−1 band). Of the measurements employed in the data analysis, a total of eight spectra were measured in the 550–1650 cm−1region (five measurements at 0.25 cm−1and three at 0.03 cm−1 res-olution) and five observations of the 1650–2200 cm−1region
(two measurements at 0.25 cm−1and three at 0.03 cm−1
res-olution). Measurements made at 0.25 cm−1and 0.03 cm−1
resolution took approximately six minutes and sixteen min-utes respectively. Spectra were successfully recorded over a pressure range of 0.24–2.20 mb and employed in the data analysis to obtain absorptivities and integrated intensities. In our experiment, pressures greater than this were not used due to an inability to obtain large quantities of PAN from indi-vidually prepared samples. However, this limit does have the
G. Allen et al.: Improved mid-infrared cross-sections for PAN 49
Table 2. Spectral fitting ranges for retrieval of contaminant gas concentrations for carbon dioxide and water vapour.
Species Window 1 range/cm−1 Window 2 range/cm−1 Window 3 range/cm−1
CO2 643–697 2255–2385 3560–3750
H2O 1465–1575 1480–1625
advantage that PAN bands do not approach saturation (>20% transmission for the 1741 cm−1at 2.20 mb).
The possible effects of sample emission (Ballard et al., 1992) were also investigated by recording background spec-tra with the globar source switched on and at room tempera-ture. No significant sample emission effect was observed.
Pressure was monitored throughout the measurements by calibrated 10 Torr and 1000 Torr MKS Baratron 390 pressure gauges (1 Torr=1.33 mb). To avoid decomposition or deto-nation of the PAN sample, the Baratron gauges were op-erated at room temperature rather than at the normal 40◦C thermostated operating temperature. At the air-conditioned laboratory temperature of 295±1 K, the uncertainty in the 10 Torr Baratron calibration was determined to be small (less than 0.7% of full scale) by cross-calibration between the ther-mostated and non-heated Baratron gauges. No observable drift was seen between the gauges over a period of two hours with a static nitrogen sample.
The small leak rate of air into the absorption cell via the vacuum line was periodically measured and included in the procedure for calculating the partial pressure of PAN em-ployed in calculating the final cross-section. This leak rate was measured to be small (less than 0.001 mb/minute). Over the course of a typical measurement (approximately six min-utes), such a leak is of little significance to the sample pres-sure studied, but is included as an error for completeness.
Cell temperature was monitored by a series of eight plat-inum resistance (PT100) thermometers, with a typical mean accuracy of 0.1 K, attached in thermal contact with the exter-nal walls of the absorption cell.
The recorded spectra were averaged from 50 co-added scans at unapodised resolutions of 0.25 and 0.03 cm−1 (where resolution is defined here as 0.9/maximum optical path difference) and apodised with the Norton-Beer strong function (Norton and Beer, 1976, 1977). Transmission spec-tra were calculated by ratioing PAN sample specspec-tra with the average of background spectra recorded immediately before and after each sample measurement. PAN samples were prepared by the nitration of peracetic acid in the follow-ing synthesis based on the method detailed by Gaffney et al. (1984) and Nielsen et al. (1982). Peracetic acid (30% w/v) was first prepared by the equilibrium reaction between hydrogen peroxide (30% w/v), sulphuric acid (99.999% w/v) and glacial acetic acid. The peracetic acid mixture was then added slowly to a mixture of dodecane (cooled to 1–3◦C), fuming nitric acid and sulphuric acid (99.999% w/v). The
organic product was dried with anhydrous magnesium sul-phate and dissolved in dodecane. The success of the synthe-sis was tested spectroscopically for the first samples using a low-resolution Perkin-Elmer FTIR spectrometer and pu-rity of PAN-dodecane samples were measured by Gas Chro-matography to be greater than 99%.
The preparation of pure gaseous PAN samples is haz-ardous owing to the inherent explosive and toxic nature of the compound and required a dedicated system for gas han-dling. The PAN gas was extracted from the dodecane solvent using liquid nitrogen freeze-pump-thaw cycles on a high vac-uum line. Due to the potential for errors arising from chemi-cal loss rates of PAN to thermolysis and photolysis, samples were transferred to the absorption cell as quickly as possible after isolation from the solvent.
3 Error analysis
A number of weak spectral signatures due to contaminants were identified in some measurements. Despite several at-tempts to remove sample contaminants, small amounts of water vapour, carbon dioxide and nitrogen dioxide were ob-served in two spectra used in this paper. These spectra are in-cluded in this paper as it was possible to accurately quantify the concentration of contaminants and remove their spectral absorption through spectral fitting. The removal procedure adopted varied according to whether the spectral contami-nation was in the form of spectral lines or broad absorption bands.
Once the contaminant signatures have been removed, ab-solute absorption cross-sections can be calculated using the Beer-Lambert law
I = I0e(−nσ x) (1)
where n is the target gas number density (molecules m−3), σ is the absorption cross-section (cm2molecule−1)and x is the absorption cell path length (m). The I /I0term represents the
transmission spectra recorded in the experiment.
Contaminant partial pressures for CO2 and H2O (where
observed) were subtracted from the measured cell pressure before calculation of PAN cross-sections, absorptivities and integrated intensities. Other sources of error were also con-sidered before determining the PAN concentration including the small contribution of air leaks to the measured pressures and the small rate of decrease in PAN concentration. Table 3
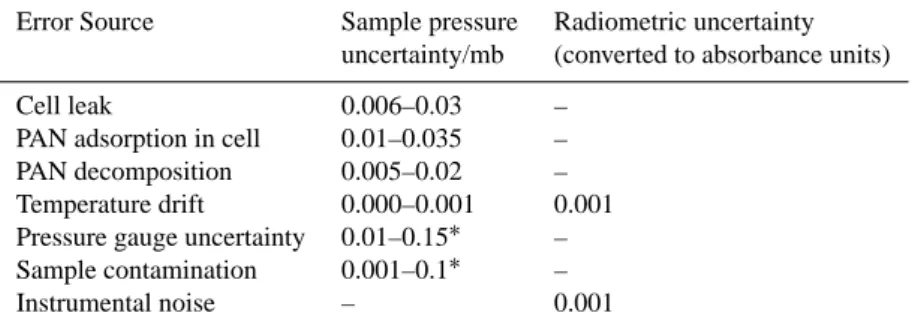
Table 3. Source and magnitude of typical errors assigned to measurements made in this study. The range in uncertainty reflects the range of
error assigned for different samples.
Error Source Sample pressure Radiometric uncertainty uncertainty/mb (converted to absorbance units)
Cell leak 0.006–0.03 –
PAN adsorption in cell 0.01–0.035 – PAN decomposition 0.005–0.02 – Temperature drift 0.000–0.001 0.001 Pressure gauge uncertainty 0.01–0.15∗ – Sample contamination 0.001–0.1∗ –
Instrumental noise – 0.001
∗For the highest PAN sample pressures (2.2 mb).
lists the typical magnitudes of such sources of error. In most cases, the errors in Table 3 correspond to an uncertainty in the PAN concentration, whilst instrumental error corresponds to a radiometric error.
There remains the possibility of the presence of non-infrared active gas species in the sample that are not intro-duced by air leaks but through release of such gases dis-solved in the dodecane. Such errors would be systematic for all bands in individual recorded spectra but can vary from sample to sample. However, since relative band intensities are derived from linear fits (see later), the resulting error on, for example, integrated band intensities is always to system-atically decrease the derived cross-section and to introduce random uncertainty into the line fit results.
3.1 Line contaminants
Carbon dioxide (CO2)along with other products of thermal
decomposition (Miller et al., 1999; von Ahsen and Willner, 2004) is produced by the breakdown of PAN during storage and sample preparation. Thermolysis products other than carbon dioxide, such as methyl nitrate (CH3ONO2), are not
observed in the measured sample as no characteristic spec-tral absorption of such products was observed. In performing simulations for the amounts of methyl nitrate and other prod-ucts that would be required to be distinguishable from base-line noise we have found that this limit is less than 100 ppmv and therefore negligible.
Various methods were employed to reduce sample impu-rities. Freshly prepared samples gave the best results, with negligible carbon dioxide levels. Long-term storage of pre-pared samples of over a week led to greater levels of impu-rity. Opaque black shielding around the apparatus reduced photolysis of PAN, which could produce nitrogen dioxide and N2O4. Care was taken to ensure as complete as
possi-ble drying with magnesium sulphate during synthesis. The effect of contaminants on the determination of ab-sorption cross-sections is two-fold. Firstly, the contribu-tion to the number density term in Eq. (1) from the
con-taminants must be removed. Secondly, the measured spectra should be corrected for the presence of contaminant spectral lines. The concentration, and hence number density contri-bution from line contaminants, was calculated by fitting the contaminant spectral lines using an optimal estimation tech-nique described by Rodgers (2000), which provides a non-linear inverse fitting technique with mathematical error es-timation. The spectral ranges used for this fitting method are shown in Table 2. Line parameters for the contaminating gases were obtained from the HITRAN 2000 database (Roth-man, 1992, 2003) and modelled spectra were produced using the Oxford Reference Forward Model described by Dudhia (http://www.atm.ox.ac.uk/RFM).
The residuals to spectra fitted in this way showed excellent results with uncertainty in contaminant concentrations of no more than 100 ppmv (0.1% of sample pressure).
3.2 Broadband contaminants
An ambiguity in the relative intensity of the 1741 cm−1
(νas(NO2)) PAN band in initial tests led to the conclusion
that a number of spectra included subtle signatures of acetone vapour. The acetone spectrum includes a band of broad shape centred also at 1741 cm−1. It should be noted that measure-ments exhibiting acetone contamination (deduced by ratioing against a spectrum known to be free from acetone contami-nation at 1220 cm−1)were discarded from the calculation of cross-sections and all other data reported in this paper. We discuss its significance here as it may have relevance to pre-viously reported PAN data.
Acetone (CH3C(O)CH3)may be a product of reactions
both in the stored sample and in the gas phase and may also be present during synthesis and hence dissolved with PAN in dodecane at this point. No other contaminant spectral fea-tures were observed other than those already discussed, with the exception of trace quantities of NO2in some early
sam-ples, which is another product of PAN thermolysis (Bruck-mann and Willner, 1983; von Ahsen and Willner, 2004).
G. Allen et al.: Improved mid-infrared cross-sections for PAN 51
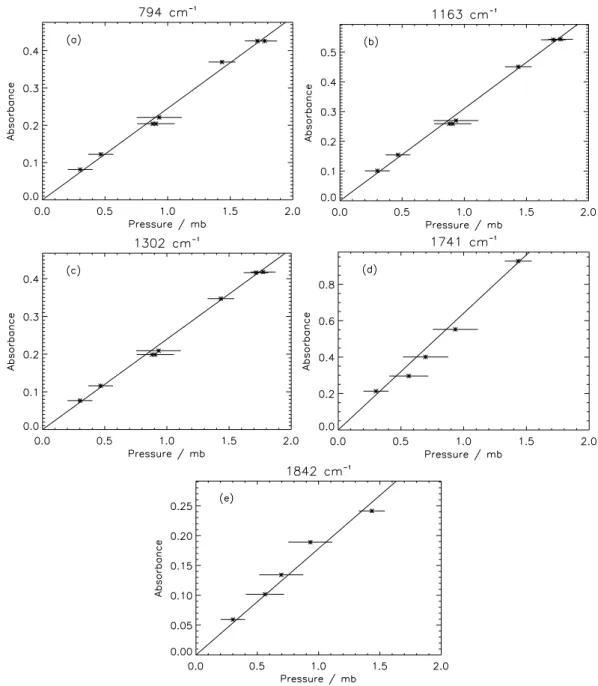
Fig. 1. Infrared absorptivities taken at the quoted band centre as a function of PAN pressure for (a) 794 cm−1, 8 samples, (b) 1163 cm−1, 8 samples, (c) 1302 cm−1, 8 samples, (d) 1741 cm−1, 5 samples and (e) 1842 cm−1, 5 samples. Errors shown represent the total error assigned for each sample measurement.
4 Results and discussion
It should be noted that measurements reported in this pa-per were conducted for samples of reasonably pure PAN vapour only and no effects of pressure broadening are dis-cussed. Measurements recorded at 0.25 and 0.03 cm−1 res-olution were compared with no differences observed in the resolution of fine structure or changes in absorption peak intensity. Very high-resolution measurements (greater than 0.005 cm−1) were not attempted in this study due to con-cerns over the stability of the sample over longer measure-ment times (greater than 1 h).
Infrared absorptivities are determined from the slope of er-ror weighted linear least squares regression fits to A=f (P ), where A is absorbance and P is pressure (Fig. 1). Similarly, integrated band intensities are calculated from such fits to in-tegrated band area (see Fig. 3). As PAN absorption bands do not approach saturation in these measurements, this er-ror weighting method was considered to be more reliable in calculating such fits to Beer’s law, rather than using the trans-mission weighting approach described by Chu et al. (1999) for bands that approach saturation.
Fig. 2. PAN absorption cross-section derived from Beer’s law
fit-ting of 8 samples in the 550–1650 cm−1 spectral region and 5 between 1650–2200 cm−1. Temperature=295 K±1 K, unapodised resolution=0.25 cm−1.
4.1 Infrared absorptivities
Figure 1 shows peak absorbances measured for each of the five principal PAN bands plotted against determined PAN partial pressure. Absorbance is calculated as usual as the negative logarithm to the base 10 of the transmission, de-fined in Sect. 3. Work by Tsalkani and Toupance (1989), on determining infrared absorptivities for the same five absorp-tion bands over a pressure range of 0.40 to 11.61 mb showed linearity of Beer’s law. This work, although over a smaller pressure range, also confirms this linearity over the pressure range 0.24–2.20 mb.
The individual error bars plotted in Fig. 1 represent the sum of all errors assigned for each sample (See Table 3 for typical sources of such error). The uncertainties in PAN con-centration and radiometric accuracy are represented on the x and y-axis respectively. For the data points with largest error, the pressure gauge uncertainty and contaminant uncertainty are the dominant factors.
There is very little scatter around the fitted regression lines, although two experimental points are not fitted within the known error budget in the 794 (δ(NO2)), 1163 (ν(C-O))
and 1302 cm−1(νs(NO2))bands. The small radiometric
er-ror represented as an erer-ror bar on the y-axis of Fig. 1 is not observable on the scale of the figure. Infrared absorptivi-ties derived from these fits for band centres of the five prin-cipal PAN bands are shown in Table 4 with a comparison to previous studies. The quoted errors represent a two stan-dard deviation (95% confidence level) obtained from the fit statistics to each Beer’s law fit in Fig. 3. The first reported absorptivities for four of the weaker PAN bands in the mid infrared are also calculated from the same spectra and are also shown in Table 4. There is excellent agreement in Ta-ble 4 for the 794, 1163 and 1302 cm−1 bands with respect
to work by Tsalkani and Toupance (1989) and by Niki et al. (1985). However, a significant difference exists between the datasets for the 1842 cm−1 band with a 15% difference
with the Tsalkani and Toupance (1989) result and 7% with that reported by Niki et al. (1985). The reason for this dif-ference is unclear. The higher absorptivities reported for the 1741 cm−1PAN band in earlier studies at lower resolutions could be subject to interference from a noted contaminant water vapour absorption line centred at 1739.850 cm−1. This contaminant absorption line would not be resolved from the 1741 cm−1 PAN band centre at spectral resolutions below 0.5 cm−1such as those resolutions employed by all but Niki et al. (1985) and in this work. Some water vapour contam-ination was noted in those studies detailed in Table 4. This interference could contribute positively to the calculated ab-sorptivity in low-resolution studies giving positively biased data for the absorptivity of the 1741 cm−1band.
A detailed comparison could also be performed for inte-grated intensities. This quantity, in principle, is not subject to resolution effects as the bandwidth considered is suitably large relative to the resolution so long as there is no spectral saturation present.
4.2 Cross-section calculation
Figure 2 shows the PAN cross-section derived from the fit to Beer’s law for all sample measurements for each spec-tral point. The resultant PAN cross-section exhibits an excel-lent zero baseline reflecting the quality of the instrument and detectors used for this investigation. The band centre posi-tions are in excellent agreement with those reported for PAN in previous studies (Stephens, 1969; Gaffney et al., 1984; Bruckmann and Willner, 1983; Niki et al., 1985; Tsalkani and Toupance, 1989). We use the band assignments for PAN previously reported by Gaffney et al. (1984) and Bruckmann and Willner (1983).
Peak cross-sections of the five principal PAN ab-sorption band centres are calculated to be 0.95(±0.02), 1.21(±0.03), 0.92(±0.02), 2.39(±0.06) and 0.74(±0.03) (×10−18cm2molecule−1)for the 794, 1163, 1302, 1741 and
1842 cm−1 bands respectively. The errors quoted represent the two standard deviation error calculated from Beer’s law fits at the band centres.
The low noise level of the FTIR cross-section shown in Fig. 2 allows the very weak 590 cm−1 (ν22), 720 cm−1
(wag(NO2))and 1375 cm−1(δsCH3)bands to be observed.
However, these bands are not easily analysed here because of detector cut-off and associated noise, signal-to-noise ra-tio, and the complexity of the band structure respectively. Hence results here are limited to the five main bands and to the weaker 606, 930, 991 and 1055 cm−1bands.
The observation of a Q-branch in the 1741 cm−1 PAN band may be of interest in remote sensing applications. The full width at half maximum of this spectral feature was measured to be 1.4 cm−1, peaking at 1740.8 cm−1, whilst
G. Allen et al.: Improved mid-infrared cross-sections for PAN 53
Fig. 3. Integrated PAN band areas calculated as a function of PAN pressure for (a) 794 cm−1, 8 samples, (b) 1163 cm−1, 8 samples, (c) 1302 cm−1, 8 samples, (d) 1741 cm−1, 5 samples and (e) 1842 cm−1, 5 samples. Errors shown represent the total error assigned for each sample measurement.
its infrared absorptivity is that listed in Table 4 for the 1741 cm−1band centre.
4.3 Integrated band intensities
Integrated band intensities for the five main bands of PAN were determined by summing the absorbances over the spec-tral ranges detailed in Table 5. The integrated band area for the 794 cm−1 absorption band, which interferes with a
smaller band centred at 822 cm−1, is calculated using a ver-tical truncation at the absorbance minimum between the 794 and 822 cm−1bands.
The results plotted in Fig. 3 show excellent internal con-sistency given the low partial pressures and limited pressure range of PAN measured. Again, only small scatter around the calculated regression fits is observed although some points remain unfitted within the known error budget. The in-tegrated absorption intensities were again determined from
Table 4. Infrared absorptivities for gaseous PAN (10−1µmol mol−1m−1, log to base 10 to 3 s. f., values refer to 1013.25 mb)∗for nine PAN absorption bands with a comparison to previously reported data. Errors for previously reported data have been modified to reflect a two standard deviation, in line with those quoted for this work.
Band centre/ Stephens, 1964 Bruckmann and Willner, 1983 Niki et al., 1985 Tsalkani and Toupance, 1989 This Work cm−1 Res.: >5.0 cm−1 Res.: 1.20 cm−1 Res.:0.06 cm−1 Res.:1.0 cm−1 Res.: 0.03/025 cm−1
606 – – – – 1.55±0.12 794 10.1 13.4 11.5±0.6 12.2±0.4 11.4±0.8 930 – – – – 1.46±0.12 991 – – – – 1.03±0.08 1055 – – – – 0.62±0.06 1163 14.3 15.8 14.5±1.4 15.7±0.6 14.6±1.0 1302 11.2 13.6 11.3±1.2 11.9±0.4 11.4±0.8 1741 23.6 32.6 31.0±3.2 31.4±1.6 30.2±3.0 1842 10.0 12.4 10.2±1.0 10.9±0.4 9.5±1.2
∗Note: 1 µmol mol−1=1 ppmv
Table 5. Spectral ranges used to calculate integrated band areas for
the nine PAN absorption bands studied.
Band centre position /cm−1 Integration range /cm−1
606 585.0–652.0 794 767.4–810.2 930 900.1–956.0 991 967.5–1008.1 1055 1035.0–1075.1 1163 1115.3–1210.2 1302 1260.7–1333.0 1740 1685.8–1780.0 1842 1802.0–1875.3
the slopes of the least squares linear regression fits and are compared with data from previous studies in Table 6. The errors in Table 6 again represent two standard deviations (95% confidence level) obtained from the fit statistics from Fig. 3. Integrated intensities for the weaker 606, 930, 991 and 1055 cm−1 bands are also shown. Our integrated ab-sorption intensity data compare well with those of Tsalkani and Toupance (1989) with a minimum 0.8% difference in the 794 cm−1absorption band and a maximum 10.6% difference in the 1163 cm−1band. Comparing our data with that orig-inally reported by Gaffney et al. (1984), however, we see differences ranging from 2.5% for the 794 cm−1 band and
50.5% for the 1741 cm−1band (see later). Large differences
were also reported by Tsalkani and Toupance (1989) in their comparison with the Gaffney et al. (1984) data. The results from this work are therefore in better agreement with those of Tsalkani and Toupance (1989). Firstly, this work has found a 4.8% lower intensity for the 1741 cm−1band. Secondly this work calculates the 1163 cm−1(ν(C-O)) band intensity to be 10.6% higher than the data of Tsalkani and Toupance (1989).
It is possible that there is a small curvature in our data for the 1741 and 1842 cm−1bands in Fig. 3, although its signif-icance cannot be addressed within the error bars.
A constant relative difference between all bands would indicate a systematic error due to incorrect pressure mea-surements for example as noted by Tsalkani and Toupance (1989), who also noted that there may be impurities in the PAN sample contributing to some bands. Tsalkani and Toupance (1989) assert that their PAN samples were >98% pure as determined by gas chromatography and state that the only contaminants identified were carbon dioxide and water vapour. These contaminants are clearly seen in the Tsalkani and Toupance (1989) spectrum with water lines visible in the 1600–1650 cm−1spectral region, even with a relatively low
resolution of 1 cm−1.
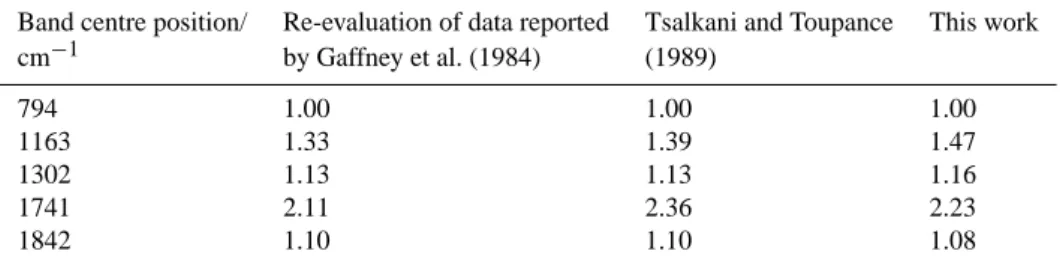
An informative way to analyse the effects of any con-taminants that may be contaminating a band is to consider the relative intensity of each band with respect to a band which shows the best internal consistency and is known to be free from any contaminants that may be thought to be present. The 794 cm−1 absorption band is chosen for this
purpose here since it shows the best agreement with pre-vious work; Tsalkani and Toupance (1989) employed the 1842 cm−1band for which some absolute intensity disagree-ments may still exist. The relative intensities for this work are calculated for each independent measurement and averaged to give the results shown in Table 7. In the table, we show the results of Tsalkani and Toupance (1989) together with their re-evaluation of the Gaffney et al. (1984) data; the relative intensities originally reported by Gaffney et al. (1984) seem to be incorrect.
The largest differences in the relative ratios are seen for the 1741 cm−1PAN band. It is possible on the basis of this result that measurement of the 1741 cm−1absorption band in earlier studies may have been affected by the same contami-nation by acetone seen in our discarded spectra.
G. Allen et al.: Improved mid-infrared cross-sections for PAN 55
Table 6. Infrared integrated intensities (atm−1cm−2to 3.s.f) of nine PAN bands with comparison to previously reported data.. (Units refer to 1 atm at ambient temperature 291 K unless otherwise stated). Errors quoted for this work represent a two standard deviation calculated from regression fits. The nature of errors from previously reported data is unknown.
Band centre/cm−1 Gaffney et al., 1984 Tsalkani and Toupance, 1989 This Work
606 – – 34.2± 1.4 794 247±6 239±4 241±6 930 – – 32.2±1.2 991 – – 20.1±0.8 1055 – – 16.0±0.8 1163 477±9 322±7 356±8 1302 405±20 270±2 281±6 1741 808±34 563±10 537±10 1842 322±9 262±4 260±6
Table 7. Relative integrated absorption intensities normalised to the 794 cm−1band intensity. The quoted data from Gaffney et al. (1984), are based on a re-evaluation of the Gaffney et al. (1984) results performed by Tsalkani and Toupance (1989).
Band centre position/ Re-evaluation of data reported Tsalkani and Toupance This work cm−1 by Gaffney et al. (1984) (1989) 794 1.00 1.00 1.00 1163 1.33 1.39 1.47 1302 1.13 1.13 1.16 1741 2.11 2.36 2.23 1842 1.10 1.10 1.08 5 Conclusions
Cross-sections of PAN vapour at spectral resolutions of 0.03 cm−1and 0.25 cm−1have been determined in the mid-infrared range of 550–2200 cm−1at 295 K.
Peak cross-sections of the five principal PAN ab-sorption band centres are calculated to be 0.95(±0.02), 1.21(±0.03), 0.92(±0.02), 2.39(±0.06) and 0.74(±0.03) (×10−18cm2molecule−1)for the 794, 1163, 1302, 1741 and 1842 cm−1PAN bands respectively.
The 794 and 1163 cm−1PAN absorption band absorptiv-ities are calculated with good accuracy in this study (<7% relative error for both bands at the 95% confidence level) and are of particular interest in FTIR remote sensing of the upper tropospheric region (8–15 km).
Integrated band intensities for the five main bands of PAN are seen to be generally in good agreement with earlier work by Tsalkani and Toupance (1989) supporting these results rather than those of Gaffney et al. (1984). The integrated intensity of the 1163 cm−1PAN band is noted to show the greatest inconsistency between the datasets. Most signif-icantly, the requirement for remote sensing applications is the confirmation of cross-sectional data with estimated er-rors. This work achieves both these advances over previously
reported data for PAN for the first time. The nature of a dif-ference in the integrated intensity reported for the 1741 cm−1 band in the datasets studied remains unresolved although it is proposed here that contamination by acetone in this band may be a source of error in previous measurements. We be-lieve similar contamination may have resulted in an overesti-mation of the reported integrated intensity for the 1741 cm−1
band in previously reported data.
In addition, probable contamination from water vapour and carbon dioxide concentrations were not removed in pre-vious calculations of PAN absorption cross-sections. Spec-tral fitting and partial pressure correction of contaminants in the Gaffney et al. (1984) and Tsalkani and Toupance (1989) datasets are imperative if these data are to be used in quan-titative applications. Without access to previous datasets it is difficult to confirm the effects of contamination on their results.
Finally, new integrated band intensities and band cen-tre absorptivities have been reported in this work for the weak PAN absorption bands centred at 606, 930, 990, and 1055 cm−1.
Acknowledgements. The authors wish to thank the Natural En-vironment Research Council (NERC) for supporting G. Allen thorough grant ref: NER/T/S/2000/01087, and for access to the Molecular Spectroscopy Facility at the Rutherford Appleton Lab-oratory (RAL). R. G. Williams is thanked for providing technical support at the Rutherford Appleton Laboratory.
Edited by: J. N. Crowley
References
Ballard, J., Remedios, J. J., and Roscoe, H. K.: Sample emission ef-fect on spectral parameters, J. Quan. Spect., 48, 733–741, 1992. Bruckmann, P. W. and Willner, H.: Infrared spectroscopic study
of peroxyacetyl nitrate (PAN) and its decomposition products, Envir. Sci. Tech., 17, 352–357, 1983.
Chu, P. M., Grunther, F. R., Rhoderick, G. C., and Lafferty, W. J.: The NIST quantitative infrared database, J. Res. Nat. I, 104 (1), 59–81, 1999.
Emmons, L. K., Carroll, M. A., Hauglustaine, D. A., Brasseur, G. P., Atherton, C., Penner, J., Sillman, S., Levy II, H., Rohrer, F., Wauben, W. M. F., van Velthoven, P. F. J., Wang Y., Jacob, D. J., Bakwin, P., Dickerson, R., Doddridge, B., Gerbig, C., Hon-rath, R., Hubler, G., Jaffe, D., Kondo, Y., Munger, J. W., Torres, A., and Volz-Thomas, A.: Climatologies of NOx and NOy: a
comparison of data and models, Atmos. Envir., 31, 1851–1903, 1997.
Fischer, H. and Oelhaf, H.: Remote sensing of vertical profiles of atmospheric trace constituents with MIPAS limb-emission spec-trometers, Appl. Opt., 35, 2787–2796, 1996.
Gaffney, J. S., Fajer, R., and Senum, G. I.: An improved procedure for high purity gaseous peroxyacetyl nitrate production: Use of heavy lipid solvents, Atmos. Envir., 18, 215–218, 1984. Johnson, T. J., Sams, R. L., Blake, T. A., Sharpe, S. W., and Chu,
P. M.: Removing aperture-induced artefacts from Fourier Trans-form infrared intensity values, Appl. Opt., 41, 2831–2839, 2002. Kirchener, F., Mayer-Figge, A., Zabel, F., and Becker, K. H.: Ther-mal stability of peroxynitrates, Int. J. Ch. K., 31, 127–144, 1999. Louet, J.: The Envisat mission and system, ESA Bulletin –
Euro-pean Space Agency, (106), 11–25, 2001.
Miller, C. E., Lynton, J. I., Keevil, D. M., and Francisco, J. S.: Dissociation pathways of Peroxyacetyl Nitrate (PAN), J. Phys. Chem. A, 103, 11 451–11 459, 1999.
Nett, H., Frerick, J., Paulsen, T., and Levrini, G.: The atmospheric instruments and their applications: GOMOS, MIPAS and SCIA-MACHY, ESA Bulletin – European Space Agency, (106), 77–87, 2001.
Nielsen, T.: A convenient method for preparation of pure standards of peroxyacetyl nitrate for atmospheric analyses, Atmos. Envir., 16, 2447–2450, 1982.
Niki, H., Maker, P. D., Savage, C. M., and Breit-enbach, L. P.: An FTIR spectroscopic study of the reactions Br+CH3CHO→HBR+CH3CO and CH3C(O)OO+NO2↔CH3C(O)OONO2(PAN), Int. J. Ch.
K., 17, 525–534, 1985.
Norton, R. H. and Beer, R.: New apodising functions for Fourier spectrometry, J. Opt. Soc. A, 66, 259–264, 1976.
Norton, R. H. and Beer, R.: New apodising functions for Fourier spectrometry – Erratum, J. Opt. Soc. A., 67, 419, 1977. Olszyna, K. J., Bailey, E. M., Simonaitis, and R., Meagher, J. F.: O3
and NOyrelationships at a rural site, J. Geo. Res-A., 99, 14 557–
14 563, 1994.
Roberts, J. M., Flocke, F., Chen, G., Gouw, J., Holloway, J. S., H¨ubler, G., Neuman, J. A., Nicks, D. K., Nowak, J. B., Parrish, D. D., Ryerson, T. B., Sueper, D. T., Warneke, C., and Fehsen-feld, F. C.: Measurement of peroxycarboxylic nitric anhydrides (PANs) during the ITCT 2K2 aircraft intensive experiment, J. Geophys. Res., 109, D23S21, 2004.
Rothman, L. S.: The HITRAN database, J. Quan. Spect., 48, 469– 507, 1992.
Rothman, L. S., Barbe, A., Benner, D.C., Brown, L. R., Camy-Peyret, C., Carleer, M. R., K. Chance, K, Clerbaux, C., Dana, V., Devi, V. M., Fayth, A. Flaud, J.M., Gamache, R. R., Gold-man, A., Jacquemart, D., Jucks, K. W., Lafferty, W. J., Mandin, J.-Y., Massie, S. T., Nemtchinov, V., Newnham, D. A., Perrin, A., Rinsland, C. P., Schroeder, J., Smith, K. M., Smith, M. A. H., Tang, K., Toth, R. A., Vander Auwera, J., Varanasi, P., and Yoshino, K.: The HITRAN molecular spectroscopic database: edition of 2000 including updates through 2001, J. Quan. Spect., 82 (1–4), 5–44, 2003.
Rodgers, C. D.: Inverse methods for atmospheric sounding: The-ory and practice (Series on atmospheric, oceanic and planetary physics), World Scientific Publishing, 2000.
Singh, H. B.: Reactive nitrogen in the troposphere – chemistry and transport of NOxand PAN, Envir. Sci. Technol., 21, 320–327,
1987.
Stephens, E. R., Hanst P. L., D¨orr, R. C, and Scott, W. E.: Re-actions of nitrogen dioxide and organic compounds in air, Ind. Eng. Chem., 48, 1498, 1956.
Talukdar, R. K., Burkholder, J. B., Schmoltner, A., Roberts, J. M., Wilson, R. R., and Ravishankara, A. R.: Investigation of the loss processes for peroxyacetyl nitrate in the atmosphere: UV pho-tolysis and reaction with OH, J. Geophys. Res. A., 100, 14 163– 14 173, 1995.
Tsalkani, N. and Toupance, G.: Infrared absorptivities and inte-grated band intensities for gaseous peroxyacetyl nitrate (PAN), Atmos. Envir., 23, 1849–1854, 1989.
von Ahsen, S. and Willner, H.: Thermal decomposition of perox-yacetyl nitrate CH3C(O)OONO2, J. Chem. Phys., 121, 2048–