HAL Id: hal-03159998
https://hal.archives-ouvertes.fr/hal-03159998
Submitted on 4 Mar 2021
HAL is a multi-disciplinary open access
archive for the deposit and dissemination of
sci-entific research documents, whether they are
pub-lished or not. The documents may come from
teaching and research institutions in France or
abroad, or from public or private research centers.
L’archive ouverte pluridisciplinaire HAL, est
destinée au dépôt et à la diffusion de documents
scientifiques de niveau recherche, publiés ou non,
émanant des établissements d’enseignement et de
recherche français ou étrangers, des laboratoires
publics ou privés.
Ethane clathrate hydrate infrared signatures for solar
system remote sensing
E Dartois, F Langlet
To cite this version:
E Dartois, F Langlet. Ethane clathrate hydrate infrared signatures for solar system remote sensing.
Icarus, Elsevier, 2021. �hal-03159998�
Ethane clathrate hydrate infrared signatures for
solar system remote sensing.
E. Dartois
1, F. Langlet
2,
1Institut des Sciences Moléculaires d’Orsay, CNRS, Université Paris-Saclay, Bât 520, Rue André Rivière, 91405 Orsay, France
e-mail: [email protected]
2Institut d’Astrophysique Spatiale (IAS), UMR8617, CNRS, Université Paris-Saclay, Bât. 121, 91405 Orsay, France
keywords: Planetary ices, IR spectroscopy, Clathrate hydrate, Ethane, Remote sensing
To appear in Icarus
Abstract
Hydrocarbons such as methane and ethane are present in many solar system objects, including comets, moons and planets. The interaction of these hydrocarbons with water ice at low temper-atures could lead to the formation of inclusion compounds, such as clathrate hydrates (water based host cages trapping hydrocar-bons guest molecules), modifying their retention, stability and
therefore evolution. The occurrence ofb=clathrate hydrates on
solar system surfaces could be established by remote sensing of their spectroscopic signatures. In this study, we measure and analyse ethane clathrate hydrate spectra recorded in the temper-ature range from 5.3 to 160K, covering most of the tempertemper-ature range of interest for solar system objects. Specific infrared band signatures are identified for the ethane encaged guest. We pro-vide epro-vidence that ethane clathrate hydrate outcrops can be de-tected by remote sensing on the surface of planetary bodies.
1. Introduction
Hydrocarbons are present in many solar system objects. The most abundant hydrocarbons species include gaseous methane or ethane present in the atmosphere of giant planets (e.g. Melin et al. 2020; Guerlet et al. 2009; Sada et al. 1996; Tokunaga et al. 1975), satellites atmospheres (Cours et al. 2020; Lom-bardo et al. 2019; Niemann et al. 2010), comets (Villanueva et al. 2011; Crovisier et al. 2004; Mumma et al. 2001, 2000),
in the liquid b=phase on Titan (Farnsworth et al. 2019; Clark
et al. 2010; Cordier et al. 2009; Lunine and Atreya 2008), solid b
=phase on Pluto and Triton (DeMeo et al. 2010), or Kuiper Belt objects (Brown et al. 2007). The coexistence of hydrocarbons with water ice at low temperatures in some of these
environ-mentsb=raises the question about their ability to form clathrate
hydrates. Clathrate hydrates are made of a 3-dimensional water-molecule connected network, linked via hydrogen bonds. To be stabilized, the clathrate network hosts cavities encapsulating guest molecules ("clathrate" meaning closure). Small molecules
can be trapped in two mainb=crystalline clathrate hydrate cubic
structures named type I and type II. The type I structure’s unit
cell (e.g. Sloan and Koh 2007) is made of two dodecahedral (512)
water cages and six larger cages containing twelve pentagonal
and two hexagonal faces (51262) per unit cell. Another structure,
the type II structure, possesses sixteen dodecahedral (512) cages
for eight large cages with twelve pentagonal and four hexagonal
faces (51264) per unit cell.
b
=For each structure, the cage’s num-ber ratio and the filling ratio with guest molecules influence the spectroscopic signatures of the trapped molecules.
When the guests are relatively volatile species, like hydrocar-bons such as methane and ethane, clathrate hydrates will modify
their retention time scales in solar system bodies, and also
mod-ify their release conditions. b=The hydrate term is sometimes
used as a semantic shortcut to designate clathrate hydrates but must not be confused neither with hydrates nor with ice mixtures where a molecule is interacting with water ice and not necessar-ily mediated via an ordered crystalline cage.
Many models do include clathrate hydrates in the evolution or geophysical structure of solar system bodies, (e.g. Combe et al. 2019; Marounina et al. 2018; Castillo-Rogez et al. 2018; Fu et al. 2017; Luspay-Kuti et al. 2016; Marboeuf et al. 2012). A better understanding of clathrate kinetics and their spectroscopic signatures is needed to continue addressing constraints on these clathrate hydrate models. A prerequisite for the identification of clathrate hydrates in the solar system is a thorough characterisa-tion of the vibracharacterisa-tional spectroscopic signatures in the infrared, or the specific spectral fingerprints, and their evolution with the ice structure and temperature. For small guest molecules, clathrate
hydrates can crystallise in two different cubic structures (I and
II), that will affect the filling of the ice cages and therefore the interactions and spectroscopy of the trapped species. Methane is the main hydrocarbon found in cold solar system environments
b=(e.g. Glein and Zolotov 2020; Guzmán-Marmolejo and Segura
2015, and citations above). Dedicated experiments (Dartois et al.
2010; Dartois and Schmitt 2009; Dartois and Deboffle 2008, and
references therein) have recorded the clathrate hydrate infrared signatures in the 4K to 140K range, in the 2-4 µm (5000-2500
cm−1) range covering the fundamental stretching modes as well
as the strongest combinations/overtones.
In addition to methane, ethane has been detectedb=on Titan
and contributes to the hydrocarbon cycle (Brown et al. 2008;
Mousis and Schmitt 2008; Barth and Toon 2006; Griffith et al.
2006; Lunine et al. 1983). In some instances, such as the sur-face of Titan, the lower abundance of the ethane hydrocarbon with respect to methane can be compensated by ethane’s lower vapour pressure, or its liquid state, and could favour the ethane inclusion in the formation of clathrate hydrates. Missions
target-ing Titan, such as Dragonfly should betterb=constrain the surface
and lower atmosphere conditions (e.g. Turtle et al. 2020; Voosen 2019; Lorenz et al. 2018). In this article we explore the infrared spectra of the ethane clathrate hydrate in the 5.3-160K range, and provide the spectroscopic signature and band frequencies of the guest ethane trapped molecules.
2. Experiments
To form the ethane clathrate hydrate we followed a previously proven protocol in evacuated cryogenic cells (Dartois et al. 2010;
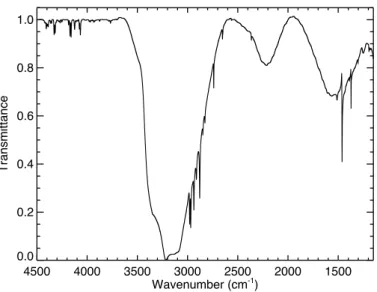
4500 4000 3500 3000 2500 2000 1500 Wavenumber (cm-1) 0.0 0.2 0.4 0.6 0.8 1.0 Transmittance
Fig. 1. Baseline corrected ethane clathrate hydrate transmittance spectrum recorded at 5.3K. Note the imperfect cancelation of the Fabry-Perot
fringes in the space between the ZnSe windows, leading to small waves observed superimposed on theb=spectrum (e.g. in the 2500-1700 cm−1
interval). Scattering effects deform the water ice bands because of imperfect film surface roughness once clathration is achieved.
3000 2900 2800 2700 Wavenumber (cm-1) 0.0 0.5 1.0 1.5
Optical depth + offset
5.3 K 20 K 40 K 60 K 80 K 100 K 120 K 140 K 160 K 90 K C 2H6/Oxirane Type I * * * * * 15 K Cryst. C 2H6 20 K H 2O:C2H6 20:1 ν7 ν1 ,ν8 + ν11 ν 8 + ν 11 ν5 ν 2 + ν 4 + ν 12 ν6 + ν11 ν2 + ν6 ν 8 + ν 12 1500 1450 1400 1350 1300 1250 1200 Wavenumber (cm-1) 0.0 0.5 1.0 1.5
Optical depth + offset
90 K C 2H6/Oxirane Type I * * 20 K H 2O:C2H6 20:1 15 K Cryst. C 2H6 ν 8 ν 6 ? ? ?
Fig. 2. Temperature-dependent infrared spectra of the ethane clathrate in the fundamental modes regions. The crystalline pure ethane spectrum
of Hudson et al. (2014) recorded at 15K is shown above. The infrared spectrum of an H2O:C2H6 (20:1) ice mixture from the Cosmic Ice
Laboratory (Hudson et al., https://science.gsfc.nasa.gov/691/cosmicice/spectra.html), recorded at 20K, is shown above. The ethane:oxirane (7:3) mixed clathrate spectrum from Richardson et al. (1985) recorded at 90K is also shown. It is baseline corrected, and oxirane features are labelled
with asterisks for clarity. Tentative assignments of the implied vibrational modes are given (see text for details). Spectra are offset for clarity.
was built around two ZnSe windows facing each other, for in-frared transmission analysis, sealed to an oxygen-free high ther-mal conductivity (OFHC), gold coated, copper closed cell. It was thermally coupled to a cold finger whose temperature can be lowered using a liquid He transfer, balanced by a surrounding
Minco polyimide thermofoil heater, b=which maintains a
con-stant temperature. A high vacuum evacuated cryostat (P <
10−7mbar) surrounded the cell. Gases were injected
b=into the
cell (or evacuated) with a stainless steel injection tube brazed at the bottom of the cell. In these experiments, a water ice film was
formed first, by injecting water vapourb=into the cell maintained
just below the water ice freezing point, forming an Ih ice. De-ionized water was used. Several freeze-pump-thaw degassing cycles were applied to remove any dissolved gases. The cell tem-perature was then lowered to 267 K for the clathrate formation.
The cell was pressurised with ethane gas at about 25 bars. This {pressure,temperature} couple is well above the stability curve for ethane clathrate hydrate, which is about 3.5 bars at 267 K.
The system was kept under pressureb=for approximately fifteen
days, much above the expected diffusion kinetics time scale. If
one assumes a typical diffusion coefficient around 10−12m2/h at
267K (e.g. Falenty et al. 2013, and references therein), in fifteen
days the diffusion pervaded ∼20µm. The deposited water ice
film thickness was several microns thick (the film deposited on each face of the cell is about 3±1µm thick), thus fully penetrated by diffusion by the ethane gas to make the clathrate. The
tem-perature was then progressively lowered (at a rate of ∼1K/min)
while evacuating the ethane gas. During this operation, we
4400 4300 4200 4100 Wavenumber (cm-1) 0.0 0.1 0.2 0.3
Optical depth + offset
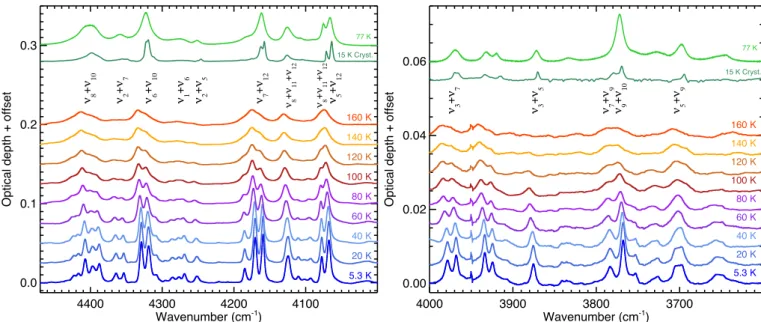
5.3 K 20 K 40 K 60 K 80 K 100 K 120 K 140 K 160 K 77 K 15 K Cryst. ν 8 + ν 10 ν2 + ν7 ν6 + ν10 ν1 + ν6 ν2 + ν5 ν7 + ν12 ν8 + ν11 + ν12 ν8 + ν11 + ν12 ν 5 + ν 12 4000 3900 3800 3700 Wavenumber (cm-1) 0.00 0.02 0.04 0.06
Optical depth + offset
5.3 K 20 K 40 K 60 K 80 K 100 K 120 K 140 K 160 K 77 K 15 K Cryst. ν5 + ν9 ν 9 + ν 10 ν7 + ν9 ν3 + ν5 ν 3 + ν 7
Fig. 3. Temperature dependent infrared spectra of the ethane clathrate in the combination/overtone regions. The crystalline pure ethane spectrum of Hudson et al. (2014) recorded at 15K is shown above. The pure ethane spectrum recorded in the cell at 77K is shown above too. Tentative assignments of the implied vibrational modes are given (see text for details). Spectra are offset for clarity.
0 50 100 150 Temperature (K) 4415 4410 0 50 100 150 Temperature (K)
ν
8+
ν
10 4335 4330ν
6+
ν
10 4325 4320ν
6+
ν
10 4175 4170ν
7+
ν
12 4165 4160ν
7+
ν
12 4130 4125ν
8+
ν
11+
ν
12 4072 4068ν
5+
ν
12 0 50 100 150 Temperature (K) 2984 2980 0 50 100 150 Temperature (K) Wavenumber (cm-1)ν
7 2972 2968ν
7 2940 2938ν
8+
ν
11 2916 2912ν
8+
ν
11 2882 2880ν
5 1464 1462 1460ν
8 1374 1372 1370ν
6Fig. 4. Temperature dependent positions for selected transitions (circles),b=with their tentative vibrational assignments, given in Table 1. The
ethane centroid vibrational positions for an ethane:oxirane (7:3) mixed clathrate spectrum from Richardson et al. (1985) recorded at 90K, are shown with green diamonds. Oxirane is known to form and induce a clathrate hydrate type I structure, helping to confirm the structure formed and
also assign the C2H6vibrational bands in this mixed oxirane clathrate hydrate.
of pure ethane, and above the ethane clathrate hydrate expected stability curve (Roberts et al. 1940).
When the system was at a temperature sufficiently low
enough so that the kinetics of the clathrate destabilisation be-comes very long (typically below 100 K), the system was fully evacuated while the temperature continued to be lowered to its minimum of about 5.3K. The infrared spectra were then recorded with steps of 20K, which allowed us to follow the evolution of
the spectral signatures, up to the clathrate hydrate rapid disso-ciation occurring above 160 K over an hour under our experi-mental conditions. (In between each temperature stabilised step,
the temperature was raised at a rate of ∼1K/min, allowing for
proper thermalisation of the clathrate hydrate.) The spectra were recorded with a Bruker Fourier transform infrared
0.5 cm−1, with a globar source, KBr beamsplitter and an HgCdTe
detector cooled with liquid N2.
3. Results
The ethane clathrate hydrate transmittance spectrum, at 5.3K, af-ter baseline correction, is shown in Fig.1. The ethane clathrate hydrate bands in the infrared recorded from 5.3 to 160K are shown in Fig.2 for the fundamental vibrational modes range
(3000-2700 and 1500-1100 cm−1), and in Fig.3 for the
combina-tions/overtones (4470-3600 cm−1). These spectra are compared
to the spectra of pure ethane ice recorded in the same cell at
77K,b=crystalline ethane recorded at 15K (Hudson et al. 2014),
and an amorphous H2O:C2H6 (20:1) ice mixture from the
Cos-mic Ice Laboratory1in the fundamental modes regions. A
spec-trum of an ethane:oxirane (7:3) mixed clathrate from Richard-son et al. (1985) recorded at 90K, is shown above the spectra in the mid-infrared. The oxirane vibrational mode contribution is identified with asterisks. Oxirane is known to form and induce a clathrate hydrate type I structure. Its clathrate type I and II spectral positions are well known, helping to confirm the struc-ture formed and thus assign the vibrational spectrum for other
guests trapped in mixed oxiraneb=clathrate hydrates. A tentative
attribution of the vibrational modes and combinations/overtones
is over-plotted on these figures. The assignments are based on the gas phase rovibrational analysis presented by Hepp and Her-man (2000, 1999b,a, 1998); Hepp et al. (1997), and assumes a bathochromic shift (a few wavenumbers for fundamental vibra-tions and up to ten to twenty for the combination modes regions) induced by the ethane clathration in a clathrate hydrate large cage (see Table 1). We also report the band position evolution as a function of temperature in Fig.4 for selected intense transi-tions, and compare these band transitions with positions from the ethane:oxirane mixed clathrate spectrum from Richardson et al. (1985) for the mid-infrared modes.
4. Discussion
Pure ethane clathrate hydrate is expected to form a type I
clathrate hydrate.b=The positions of the ethane bands in our
ex-periment, when compared to the Richardson et al. (1985) mixed ethane:oxirane band positions (shown with green diamond in Fig.4) coincide well with the expected type I clathrate hydrate
positions. Richardson et al. (1985) however point toward
unusual relative intensities of the oxirane band intensities in this experiment, requiring further analysis. It may suggest that the presence of ethane in this mixed clathrate may deform the structure more than for smaller guest species. Peak positions and tentative assignments are reported in Table 1 for the two measured extreme temperatures, 5.3 and 160 K, respectively.
The main outcome of this study is that the formation of an ethane clathrate hydrate gives rise to a recorded very unique band pattern, distinct from the other observed features for ethane in other possible phases. In particular the band splitting in the
fundamental ν7 degenerate mode region around 2970 cm−1
(already observed by Richardson et al. (1985)), with a splitting
amplitude of a bit more than 10 cm−1) is characteristic of the
ethane clathrate hydrate, and not observed in other pure ethane
or mixed ethane/water ice phases. In the combinations/overtone
near infrared region, many bands observed in the pattern are also
characteristic (in particular the ∼4400, 4320, 4170, 3980 cm−1
1 Hudson et al., https://science.gsfc.nasa.gov/691/cosmicice/spectra.html
combinations modes splittings). They are clearly distinctive
from the other possible solid ethane or ethane simple hydrate phases, pointing toward the uniqueness of the identification of a clathrate hydrate through the observation of these modes.
In planetary environments such as Jupiter, Saturn and its satellite Titan, Pluto and other TNOs, as well as comets, ethane is less abundant than methane. When type I clathrate hydrate formers are mixed, they may induce the formation of a type II hydrate, under specific ratios. Subramanian et al. (2000) report that in mixed methane and ethane clathrate hydrate studied by Raman spectroscopy, both type I formers taken individually, formed a type II clathrate hydrate under specific composition
ranges, typically starting above 72 to 75% of methane. b=The
structure will go back to type I clathrate hydrate when ethane becomes a trace species, above the upper bound of 95% methane
in these experiments. The mixed methane/ethane clathrate
hy-drate is metastable in some casesb=as shown by, e.g., Takeya
et al. (2003). Takeya et al. (2005) measured the lattice constants of mixed methane and ethane clathrate hydrate at 113 K as a
function of CH4gas content. The mixed system forms the type
II clathrate hydrate for about 60 to 80% methane content and type I above and below, with values close to the pure methane hydrate lattice parameters of type I at high methane content.
b=Type I and type II mixed methane+ethane clathrate hydrates
can coexist. The type II has been shown to be a metastable kinetically favoured stage during some mixed clathrate hydrate nucleation experiments, with a slow transformation into sI, the type I being the stable phase to long time scales (Kida et al. 2010; Ohno et al. 2009; Murshed and Kuhs 2009). In both type I and II clathrates, the ethane molecules occupies the large
cage (the 51262 in type I and 51264 in type II), as ethane is too
large to fit into the small cage. The proportions at which this change occurs will vary with the formation temperature of the
clathrate hydrate because of the difference in fugacity of these
two species. The ratio of small to large cages in each unit of the two clathrate ice structures favours type I when only the large cages are filled. The band positions are expected to shift by a few wavenumbers in between type I and type II clathrate hydrate
large cages, being about 4 cm−1redder for type II with respect
to type I in the stretching modes, based on Raman spectroscopy (Subramanian et al. 2000). Apart from the shift specific to each clathrate hydrate structure, the pattern observed in the present
experiments should be representative. b=Several splittings for
some vibrational modes/combinations, distinct from the known
crystalline phase splittings, characteristic of ethane trapped in the large cages of a clathrate hydrate of type I (or II with an expected moderate shift) should be actively searched for to establish such clathrate hydrates occurence.
b
=Saturn’s moon Titan, with an atmospheric temperature in the 70-180K range (Hörst 2017; Niemann et al. 2010; McKay et al. 1989), hosts conditions for hydrocarbon rains, and, with a surface temperature around 90K, harbours liquid hydrocarbons, including methane and ethane lakes (e.g. Mastrogiuseppe et al. 2019; Hayes et al. 2008; Stofan et al. 2007). The stability zone for the formation of methane and ethane clathrate hydrate falls in this temperature range (Kalousová and Sotin 2020; Tobie et al. 2009; Lunine and Atreya 2008; Thomas et al. 2008, 2007; Atreya et al. 2006; Osegovic and Max 2005). Vu et al. (2020) recently showed that the kinetics of formation at low temperature of an ethane clathrate hydrate is kinetically possible under Titan con-ditions, using Raman spectroscopy. These authors report that with a surface temperature of 90K, a full clathration of ice in
contact with ethane will occur in about four (Earth) years, i.e.
within a time scale shorter than Titan’s seasonsb=(winter and
summer solstices are separated by about 15 years, directly re-lated to Saturn’s orbital period of slightly more than 29 years). An alternative formation at the surface invoked in this study is the contact of ethane rain directly on exposed ice slabs, a
situa-tion for which the clathrate hydrate kinetics is more difficult to
estimate. However, for such exposed fields, the spectroscopic signatures obtained by remote sensing are directly accessible,
and would provide constraints onb=clathrates occurrence. In
Ti-tan’s lakes, the density of liquid ethane being higher than
liq-uid methane (e.g., about 462.7 kg/m3 (melting line) and 662.8
kg/m3 (melting line) at 100K for methane and ethane,
respec-tively (Younglove and Ely 1987)), a methane/ethane phase
sep-aration should occur. b=The full nitrogen, methane and ethane
system must be investigated under Titan conditions (e.g. Hanley 2017). At the bottom of these lakes, ethane may therefore be in direct contact with an ice bedrock like the one observed
else-where on Titan (e.g. Griffith et al. 2019), but residing well below
the lake’s surface. b=Additionally, if the temperature at the
bot-tom of the lakes is higher than the surface temperature, the for-mation kinetics should be thermally enhanced. Vu et al. (2020) consider the domain of formation at greater depths if ethane per-colates deeper through the surface, with corresponding higher temperatures and favourable formation kinetics, but hardly ac-cessible to spectroscopic means. Many experiments following the cage evolution and spectral signatures of clathrate hydrates
are performed using Raman spectroscopy.b=In the spectral range
considered here, if both Raman and infrared spectrometers can be integrated in space probes that would land on solar system ob-jects, and perform an analysis of the local field, a vast majority of the spectroscopic information is still obtained using infrared only remote sensing by space probes using on-board spectrom-eters. An outcrop on the surface of icy bodies, or a terrain re-cently exposed when there is a space probe fly-by may allow for the identification of clathrate hydrates by infrared spectroscopic means. Such a direct spectroscopic detection would consider-ably anchor our view on the geophysical evolution of these ob-jects.
5. Conclusion
We measured the temperature dependence, in the 5.3 to 160 K range, of the near and mid-infrared spectral signatures of ethane trapped in a type I clathrate hydrate structure, identified by com-parison to literature spectra of mixed oxirane:ethane clathrate
hydrate. The b=ethane molecule occupies the large cages of
the ice crystal structure formed by the host water molecules. The large number of individual transitions observed in the fundamental modes of vibration and the numerous
combina-tions/harmonics represent distinctive spectroscopic fingerprints
that will allow remote identification if ethane is present in a clathrate hydrate in solar system ices. Further experiments are
foreseen to explore the type I and II clathrate hydrate differences
in the infrared over a large range of temperatures. When ethane occupies the large cage of type I or II clathrate hydrates, only a mild shift of about four wavenumbers between ethane bands in
each structure is expected,b=and, apart from a shift of such
mag-nitude, the measured spectra in this study will be similar to those of both structures. These signatures can be used to analyse plan-etary remote sensing data and may be used for future proposed missions exploring the icy worlds of the solar system, in partic-ular, ones targeting Saturn’s moon Titan, such as the Dragonfly mission.
Acknowledgments
This work was supported by the CNRS/INSU and CNRS/INP. The authors want to thank M. Bouzit, B. Crane, for their techni-cal support to the initial design of the cell.
References
Atreya, S.K., Adams, E.Y., Niemann, H.B., Demick-Montelara, J.E., Owen, T.C., Fulchignoni, M., Ferri, F., Wilson, E.H., 2006. Titan’s methane cycle. Planetary and Space Science 54, 1177–1187. doi:.
Barth, E.L., Toon, O.B., 2006. Methane, ethane, and mixed clouds in Titan’s atmosphere: Properties derived from microphysical modeling. Icarus 182, 230–250. doi:.
Brown, M.E., Barkume, K.M., Blake, G.A., Schaller, E.L., Rabinowitz, D.L., Roe, H.G., Trujillo, C.A., 2007. Methane and Ethane on the Bright Kuiper Belt Object 2005 FY9. Astronomical Journal 133, 284–289. doi:.
Brown, R.H., Soderblom, L.A., Soderblom, J.M., Clark, R.N., Jaumann, R., Barnes, J.W., Sotin, C., Buratti, B., Baines, K.H., Nicholson, P.D., 2008. The identification of liquid ethane in Titan’s Ontario Lacus. Nature 454, 607–610. doi:.
Castillo-Rogez, J., Neveu, M., McSween, H.Y., Fu, R.R., Toplis, M.J., Pret-tyman, T., 2018. Insights into Ceres’s evolution from surface composition. Meteoritics and Planetary Science 53, 1820–1843. doi:.
Clark, R.N., Curchin, J.M., Barnes, J.W., Jaumann, R., Soderblom, L., Cruik-shank, D.P., Brown, R.H., Rodriguez, S., Lunine, J., Stephan, K., Hoefen, T.M., Le Mouélic, S., Sotin, C., Baines, K.H., Buratti, B.J., Nicholson, P.D., 2010. Detection and mapping of hydrocarbon deposits on Titan. Journal of Geophysical Research (Planets) 115, E10005. doi:.
Combe, J.P., McCord, T.B., Matson, D.L., Johnson, T.V., Davies, A.G., Scipioni, F., Tosi, F., 2019. Nature, distribution and origin of CO2on Enceladus. Icarus 317, 491–508. doi:.
Cordier, D., Mousis, O., Lunine, J.I., Lavvas, P., Vuitton, V., 2009. An Estimate of the Chemical Composition of Titan’s Lakes. Astrophysical Journal letters 707, L128–L131. doi:, arXiv:0911.1860.
Cours, T., Cordier, D., Seignovert, B., Maltagliati, L., Biennier, L., 2020. The 3 . 4 µm absorption in Titan’s stratosphere: Contribution of ethane, propane, butane and complex hydrogenated organics. Icarus 339, 113571. doi:, arXiv:2001.02791.
Crovisier, J., Bockelée-Morvan, D., Colom, P., Biver, N., Despois, D., Lis, D.C., Teamtarget-of-opportunity radio observations of comets, 2004. The com-position of ices in comet C/1995 O1 (Hale-Bopp) from radio spectroscopy. Further results and upper limits on undetected species. Astronomy and As-trophysics 418, 1141–1157. doi:.
Dartois, E., Deboffle, D., 2008. Methane clathrate hydrate FTIR spectrum. Impli-cations for its cometary and planetary detection. Astronomy and Astrophysics 490, L19–L22. doi:.
Dartois, E., Deboffle, D., Bouzit, M., 2010. Methane clathrate hydrate infrared spectrum. II. Near-infrared overtones, combination modes and cages assign-ments. Astronomy and Astrophysics 514, A49. doi:.
Dartois, E., Schmitt, B., 2009. Carbon dioxide clathrate hydrate FTIR spectrum. Near infrared combination modes for astrophysical remote detection. Astron-omy and Astrophysics 504, 869–873. doi:.
DeMeo, F.E., Dumas, C., de Bergh, C., Protopapa, S., Cruikshank, D.P., Geballe, T.R., Alvarez-Candal, A., Merlin, F., Barucci, M.A., 2010. A search for ethane on Pluto and Triton. Icarus 208, 412–424. doi:.
Falenty, A., Salamantin, A.N., Kuhs, W.F., 2013. Kinetics of CO2-Hydrate For-mation from Ice Powders: Data Summary and Modeling Extended to Low Temperatures. J. Phys. Chem. C 117, 8443–8457. doi:.
Farnsworth, K., Soderblom, J., Rodriguez, S., Czaplinski, E., Chevrier, V., 2019. Constraining Ethane Concentration in Titan’s Lakes and Seas., in: EPSC-DPS Joint Meeting 2019, pp. EPSC–DPS2019–1220.
Fu, R.R., Ermakov, A.I., Marchi, S., Castillo-Rogez, J.C., Raymond, C.A., Hager, B.H., Zuber, M.T., King, S.D., Bland , M.T., Cristina De Sanctis, M., Preusker, F., Park, R.S., Russell, C.T., 2017. The interior structure of Ceres as revealed by surface topography. Earth and Planetary Science Letters 476, 153–164. doi:.
Glein, C.R., Zolotov, M.Y., 2020. Hydrogen, hydrocarbons, and habitability across the solar system. Elements: An International Magazine of Mineralogy, Geochemistry, and Petrology 16, 47–52.
Griffith, C.A., Penteado, P., Rannou, P., Brown, R., Boudon, V., Baines, K.H., Clark, R., Drossart, P., Buratti, B., Nicholson, P., McKay, C.P., Coustenis, A., Negrao, A., Jaumann, R., 2006. Evidence for a Polar Ethane Cloud on Titan. Science 313, 1620–1622. doi:.
Griffith, C.A., Penteado, P.F., Turner, J.D., Neish, C.D., Mitri, G., Montiel, N.J., Schoenfeld, A., Lopes, R.M.C., 2019. A corridor of exposed ice-rich bedrock across Titan’s tropical region. Nature Astronomy 3, 642–648. doi:.
Guerlet, S., Fouchet, T., Bézard, B., Simon-Miller, A.A., Michael Flasar, F., 2009. Vertical and meridional distribution of ethane, acetylene and propane in Saturn’s stratosphere from CIRS/Cassini limb observations. Icarus 203, 214–232. doi:.
Guzmán-Marmolejo, A., Segura, A., 2015. Methane in the solar system. Boletín de la Sociedad Geológica Mexicana 67, 377–385.
Hanley, J., 2017. Titan: Bubbles in focus. Nature Astronomy 1, 1–2.
Hayes, A., Aharonson, O., Callahan, P., Elachi, C., Gim, Y., Kirk, R., Lewis, K., Lopes, R., Lorenz, R., Lunine, J., Mitchell, K., Mitri, G., Stofan, E., Wall, S., 2008. Hydrocarbon lakes on Titan: Distribution and interaction with a porous regolith. Geophysics Research Letters 35, L09204. doi:.
Hepp, M., Georges, R., Herman, M., 1997. The v6+ v10band of ethane. Chem-ical Physics Letters 275, 513–518. doi:.
Hepp, M., Herman, M., 1998. The jet cooled spectrum of ethane between 4000 and 4500cm-1. Molecular Physics 94, 829–838. doi:.
Hepp, M., Herman, M., 1999a. Effective Rotation-Vibration Parameters for the ν8and ν4+ ν12Bands of Ethane. Journal of Molecular Spectroscopy 194, 87–94. doi:.
Hepp, M., Herman, M., 1999b. Weak Combination Bands in the 3-µm Region of Ethane. Journal of Molecular Spectroscopy 197, 56–63. doi:.
Hepp, M., Herman, M., 2000. RESEARCH NOTE Vibration-rotation bands in ethane. Molecular Physics 98, 57–61. doi:.
Hörst, S.M., 2017. Titan’s atmosphere and climate. Journal of Geophysical Research (Planets) 122, 432–482. doi:, arXiv:1702.08611.
Hudson, R.L., Gerakines, P.A., Moore, M.H., 2014. Infrared spectra and optical constants of astronomical ices: II. Ethane and ethylene. Icarus 243, 148–157. doi:.
Kalousová, K., Sotin, C., 2020. The Insulating Effect of Methane Clathrate Crust on Titan’s Thermal Evolution. Geophysical Research Letters 47, e87481. doi:.
Kida, M., Jin, Y., Takahashi, N., Nagao, J., Narita, H., 2010. Dissociation behav-ior of methane- ethane mixed gas hydrate coexisting structures i and ii. The Journal of Physical Chemistry A 114, 9456–9461.
Lombardo, N.A., Nixon, C.A., Sylvestre, M., Jennings, D.E., Teanby, N., Ir-win, P.J.G., Flasar, F.M., 2019. Ethane in Titan’s Stratosphere from Cassini CIRS Far- and Mid-infrared Spectra. Astronomical Journal 157, 160. doi:, arXiv:1908.01926.
Lorenz, R.D., Turtle, E.P., Barnes, J.W., Trainer, M.G., Adams, D.S., Hibbard, K.E., Sheldon, C.Z., Zacny, K., Peplowski, P.N., Lawrence, D.J., et al., 2018. Dragonfly: A rotorcraft lander concept for scientific exploration at titan. Johns Hopkins APL Technical Digest 34, 14.
Lunine, J.I., Atreya, S.K., 2008. The methane cycle on Titan. Nature Geoscience 1, 159–164. doi:.
Lunine, J.I., Stevenson, D.J., Yung, Y.L., 1983. Ethane Ocean on Titan. Science 222, 1229–1230. doi:.
Luspay-Kuti, A., Mousis, O., Hässig, M., Fuselier, S.A., Lunine, J.I., Marty, B., Mand t, K.E., Wurz, P., Rubin, M., 2016. The presence of clathrates in comet 67P/Churyumov-Gerasimenko. Science Advances 2, 1501781. doi:. Marboeuf, U., Schmitt, B., Petit, J.M., Mousis, O., Fray, N., 2012. A cometary
nucleus model taking into account all phase changes of water ice: amorphous, crystalline, and clathrate. Astronomie and Astrophysics 542, A82. doi:. Marounina, N., Grasset, O., Tobie, G., Carpy, S., 2018. Role of the global water
ocean on the evolution of Titan’s primitive atmosphere. Icarus 310, 127–139. doi:, arXiv:1711.09128.
Mastrogiuseppe, M., Poggiali, V., Hayes, A.G., Lunine, J.I., Seu, R., Mitri, G., Lorenz, R.D., 2019. Deep and methane-rich lakes on Titan. Nature Astron-omy 3, 535–542. doi:.
McKay, C.P., Pollack, J.B., Courtin, R., 1989. The thermal structure of Titan’s atmosphere. Icarus 80, 23–53. doi:.
Melin, H., Fletcher, L.N., Irwin, P.G.J., Edgington, S.G., 2020. Jupiter in the Ultraviolet: Acetylene and Ethane Abundances in the Stratosphere of Jupiter from Cassini Observations between 0.15 and 0.19 µm. Astronomical Journal 159, 291. doi:, arXiv:2005.09895.
Mousis, O., Schmitt, B., 2008. Sequestration of Ethane in the Cryovol-canic Subsurface of Titan. Astrophysical Journal, Letters 677, L67. doi:, arXiv:0802.1033.
Mumma, M.J., DiSanti, M.A., Dello Russo, N., Magee-Sauer, K., Rettig, T.W., 2000. Detection of CO and Ethane in Comet 21P/Giacobini-Zinner: Evidence for Variable Chemistry in the Outer Solar Nebula. Astrophysical Journal let-ters 531, L155–L159. doi:.
Mumma, M.J., McLean, I.S., DiSanti, M.A., Larkin, J.E., Dello Russo, N., Magee-Sauer, K., Becklin, E.E., Bida, T., Chaffee, F., Conrad, A.R., Figer, D.F., Gilbert, A.M., Graham, J.R., Levenson, N.A., Novak, R.E., Reuter, D.C., Teplitz, H.I., Wilcox, M.K., Xu, L.H., 2001. A Survey of Organic Volatile Species in Comet C/1999 H1 (Lee) Using NIRSPEC at the Keck Ob-servatory. Astrophysical Journal 546, 1183–1193. doi:.
Murshed, M.M., Kuhs, W.F., 2009. Kinetic studies of methane–ethane mixed gas hydrates by neutron diffraction and raman spectroscopy. The Journal of Physical Chemistry B 113, 5172–5180.
Niemann, H.B., Atreya, S.K., Demick, J.E., Gautier, D., Haberman, J.A., Har-pold, D.N., Kasprzak, W.T., Lunine, J.I., Owen, T.C., Raulin, F., 2010. Com-position of Titan’s lower atmosphere and simple surface volatiles as measured by the Cassini-Huygens probe gas chromatograph mass spectrometer experi-ment. Journal of Geophysical Research (Planets) 115, E12006. doi:. Ohno, H., Strobel, T.A., Dec, S.F., Sloan, Jr, E.D., Koh, C.A., 2009. Raman
studies of methane- ethane hydrate metastability. The Journal of Physical Chemistry A 113, 1711–1716.
Osegovic, J.P., Max, M.D., 2005. Compound clathrate hydrate on Titan’s sur-face. Journal of Geophysical Research (Planets) 110, E08004. doi:. Richardson, H.H., Woolridge, P.J., Devlin, J.P., 1985. FT-IR spectra of vacuum
deposited clathrate hydrate of oxirane H_2S, THF, and ethane. Journal of Chemical Physics 83, 4387–4394. doi:.
Roberts, O., Brownscombe, E., Howe, L., Ramser, H., 1940. Constitution di-agrams and composition of methane and ethane hydrates. Oil & Gas J. 39, 37.
Sada, P.V., McCabe, G.H., Bjoraker, G.L., Jennings, D.E., Reuter, D.C., 1996. 13C-Ethane in the Atmospheres of Jupiter and Saturn. Astrophysical Journal 472, 903. doi:.
Sloan, E.D., Koh, C.A., 2007. Clathrate hydrates of Natural Gases. 3 ed., CRC Press.
Stofan, E.R., Elachi, C., Lunine, J.I., Lorenz, R.D., Stiles, B., Mitchell, K.L., Os-tro, S., Soderblom, L., Wood, C., Zebker, H., Wall, S., Janssen, M., Kirk, R., Lopes, R., Paganelli, F., Radebaugh, J., Wye, L., Anderson, Y., Allison, M., Boehmer, R., Callahan, P., Encrenaz, P., Flamini, E., Francescetti, G., Gim, Y., Hamilton, G., Hensley, S., Johnson, W.T.K., Kelleher, K., Muhleman, D., Paillou, P., Picardi, G., Posa, F., Roth, L., Seu, R., Shaffer, S., Vetrella, S., West, R., 2007. The lakes of Titan. Nature 445, 61–64. doi:.
Subramanian, S., Kini, R.A., Dec, S.F., Sloan, E. D., J., 2000. Structural Transi-tion Studies in Methane+ Ethane Hydrates Using Raman and NMR. Annals of the New York Academy of Sciences 912, 873–886. doi:.
Takeya, S., Kamata, Y., Uchida, T., Nagao, J., Ebinuma, T., Narita, H., Hori, A., Hondoh, T., 2003. Coexistence of structure I and II hydrates formed from a mixture of methane and ethane gases. Canadian Journal of Physics 81, 479– 484. doi:.
Takeya, S., Uchida, T., Kamata, Y., Nagao, J., Kida, M., Minami, H., Sakagami, H., Hachikubo, A., Takahashi, N., Shoji, H., Khlystov, O., Grachev, M., Soloviev, V. Ebinuma, T., Narita, H., Hori, A., Hondoh, T., 2005. Lattice Ex-pansion of Clathrate Hydrates of Methane Mixtures and Natural Gas. Angew. Chem. 117, 7088 –7091. doi:.
Thomas, C., Mousis, O., Ballenegger, V., Picaud, S., 2007. Clathrate hydrates as a sink of noble gases in Titan’s atmosphere. Astronomy and Astrophysics 474, L17–L20. doi:, arXiv:0708.2158.
Thomas, C., Picaud, S., Mousis, O., Ballenegger, V., 2008. A theoretical inves-tigation into the trapping of noble gases by clathrates on Titan. Planetary and Space Science 56, 1607–1617. doi:, arXiv:0803.2884.
Tobie, G., Choukroun, M., Grasset, O., Le Mouélic, S., Lunine, J.I., Sotin, C., Bourgeois, O., Gautier, D., Hirtzig, M., Lebonnois, S., Le Corre, L., 2009. Evolution of Titan and implications for its hydrocarbon cycle. Philosophical Transactions of the Royal Society of London Series A 367, 617–631. doi:. Tokunaga, A., Knacke, R.F., Owen, T., 1975. The detection of ethane on Saturn.
Astrophysical Journal, Letters 197, L77. doi:.
Turtle, E.P., Trainer, M.G., Barnes, J.W., Lorenz, R.D., Hibbard, K.E., Adams, D.S., Bedini, P.D., Brinckerhoff, W.B., Burks, M.T., Cable, M.L., Ernst, C., Freissinet, C., Hand, K., Hayes, A.G., Hörst, S.M., Johnson, J.R., Karkoschka, E., Langelaan, J.W., Lawrence, D.J., Le Gall, A., Lora, J.M., MacKenzie, S.M., McKay, C.P., Miller, R.S., Murchie, S., Neish, C.D., New-man, C.E., Núñez, J.I., Palacios, J., Panning, M.P., Parsons, A.M., Peplowski, P.N., Quick, L.C., Radebaugh, J., Rafkin, S.C.R., Ravine, M.A., Schmitz, S., Shiraishi, H., Soderblom, J.M., Sotzen, K.S., Stickle, A.M., Stofan, E.R., Szopa, C., Tokano, T., Wilson, C., Yingst, R.A., Zacny, K., 2020. Dragonfly: In Situ Exploration of Titan’s Organic Chemistry and Habitability, in: Lunar and Planetary Science Conference, p. 2288.
Villanueva, G.L., Mumma, M.J., Magee-Sauer, K., 2011. Ethane in planetary and cometary atmospheres: Transmittance and fluorescence models of the ν7 band at 3.3 µm. Journal of Geophysical Research (Planets) 116, E08012. doi:. Voosen, P., 2019. NASA to fly drone on Titan. Science 365, 15–15. doi:. Vu, T.Â.H., Choukroun, M., Sotin, C., Muñoz-Iglesias, V., Maynard-Casely,
H.Â.E., 2020. Rapid Formation of Clathrate Hydrate From Liquid Ethane and Water Ice on Titan. Geophysics Research Letters 47, e86265. doi:. Younglove, B.A., Ely, J.F., 1987. Thermophysical Properties of Fluids. II.
Methane, Ethane, Propane, Isobutane, and Normal Butane. Journal of Physi-cal and ChemiPhysi-cal Reference Data 16, 577–798. doi:.
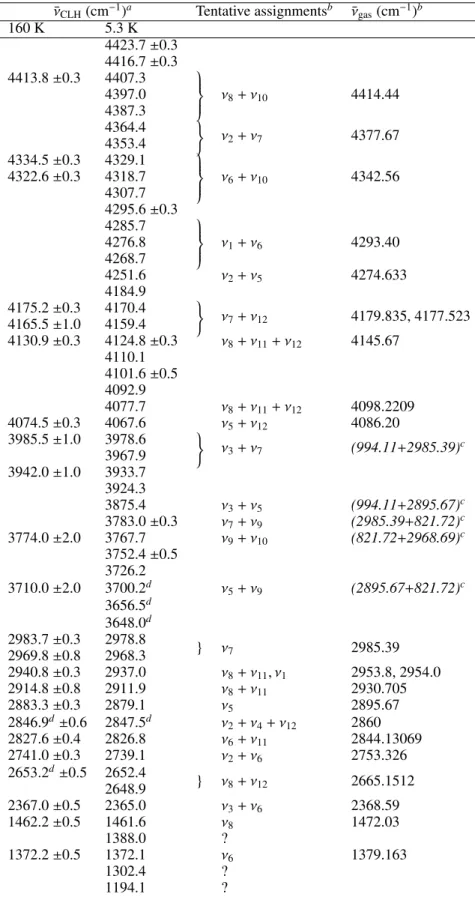
Table 1. Observed clathrate hydrate ethane positions and tentative assignments
¯νCLH(cm−1)a Tentative assignmentsb ¯νgas(cm−1)b
160 K 5.3 K 4423.7 ±0.3 4416.7 ±0.3 4413.8 ±0.3 4407.3 ν8+ ν10 4414.44 4397.0 4387.3 4364.4 ) ν2+ ν7 4377.67 4353.4 4334.5 ±0.3 4329.1 ν6+ ν10 4342.56 4322.6 ±0.3 4318.7 4307.7 4295.6 ±0.3 4285.7 ν1+ ν6 4293.40 4276.8 4268.7 4251.6 ν2+ ν5 4274.633 4184.9 4175.2 ±0.3 4170.4 ) ν7+ ν12 4179.835, 4177.523 4165.5 ±1.0 4159.4 4130.9 ±0.3 4124.8 ±0.3 ν8+ ν11+ ν12 4145.67 4110.1 4101.6 ±0.5 4092.9 4077.7 ν8+ ν11+ ν12 4098.2209 4074.5 ±0.3 4067.6 ν5+ ν12 4086.20 3985.5 ±1.0 3978.6 ) ν3+ ν7 (994.11+2985.39)c 3967.9 3942.0 ±1.0 3933.7 3924.3 3875.4 ν3+ ν5 (994.11+2895.67)c 3783.0 ±0.3 ν7+ ν9 (2985.39+821.72)c 3774.0 ±2.0 3767.7 ν9+ ν10 (821.72+2968.69)c 3752.4 ±0.5 3726.2 3710.0 ±2.0 3700.2d ν 5+ ν9 (2895.67+821.72)c 3656.5d 3648.0d 2983.7 ±0.3 2978.8 } ν7 2985.39 2969.8 ±0.8 2968.3 2940.8 ±0.3 2937.0 ν8+ ν11, ν1 2953.8, 2954.0 2914.8 ±0.8 2911.9 ν8+ ν11 2930.705 2883.3 ±0.3 2879.1 ν5 2895.67 2846.9d±0.6 2847.5d ν 2+ ν4+ ν12 2860 2827.6 ±0.4 2826.8 ν6+ ν11 2844.13069 2741.0 ±0.3 2739.1 ν2+ ν6 2753.326 2653.2d±0.5 2652.4 } ν8+ ν12 2665.1512 2648.9 2367.0 ±0.5 2365.0 ν3+ ν6 2368.59 1462.2 ±0.5 1461.6 ν8 1472.03 1388.0 ? 1372.2 ±0.5 1372.1 ν6 1379.163 1302.4 ? 1194.1 ?
aAt 5.3K, unless stated, positions uncertainties for the strongest bands are of the order of ±0.2 cm−1. bTentative assignments are
based on gas phase positions from Hepp and Herman (2000), and references therein, assuming a redshift induced by the clathrate